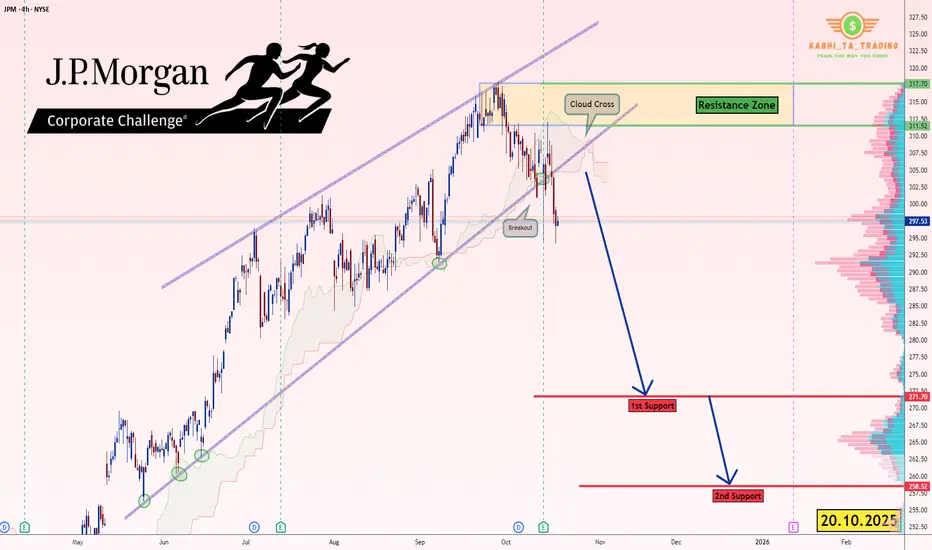
JP Morgan (JPM) - H4 - Breakout Pattern (20.10.2025)📊 Setup Overview:
J.P. Morgan ( NYSE:JPM ), presenting a bearish outlook based on the price action.
📈 Trade Plan:
Bias: Bearish below $310
1st Target: $272 ✅
2nd Target: $258.52 🎯
Resistance Zone: $311 – $318
🧩 Technical Confluence:
1.Price Breaks the Wedge Pattern.
2.Trendline break confirming reversal
3.Ichimoku Cloud crossover indicating bearish momentum
🏦 Key Fundamentals & Recent Performance
1.JPM reported third-quarter 2025 adjusted revenue of ~$47.12 billion, topping estimates.
2.Net interest income (NII) rose only ~2% YoY in Q3 to $24.1 billion, and the bank raised its 2025 NII outlook to ~$95.8 billion.
3.JPM itself flags major risks: ongoing geopolitical uncertainty, elevated asset valuations, potential credit stress and slower growth.
#JPM #JPMStock #NASDAQ #USStocks #TechnicalAnalysis #wedgePattern #BearishSetup #PriceAction #EarningsWatch #StockMarket #SwingTrading #TradingView #Ichimoku #CloudCrossover #ChartsDontLie #Kabhi_TA_Trading
⚠️ Disclaimer:
This analysis is for educational purposes only and not investment advice. Always perform your own due diligence and manage risk appropriately before taking any position.
💬 Support the Analysis:
If this chart helped you — LIKE 👍, COMMENT 💬 your thoughts, and FOLLOW ✅ for more daily stock & forex chart breakdowns from Kabhi_TA_Trading!
Jpmorganchase
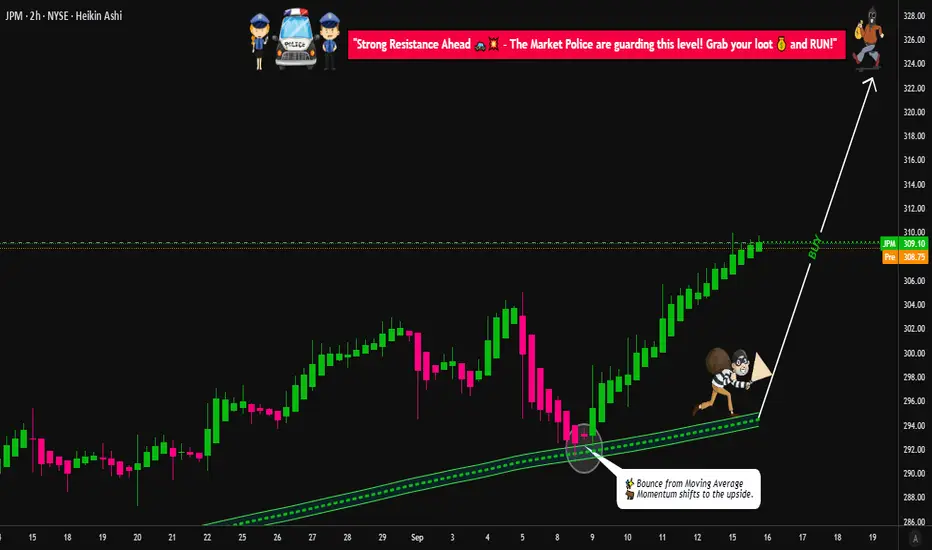
JPM Swing Plan → Layered Entries & Profit Targets Mapped😂 JPMorgan Chase (JPM) Swing/Day Trade: The Great Heist Blueprint 🤑💰
🚀 Asset: JPMorgan Chase & Co. ( NYSE:JPM )🎯 Market Profit Realization Plan: Swing/Day Trade📈 Outlook: Bullish vibes confirmed! 💪
📜 The Setup: Why JPM is Ready to Pop! 🎉
Bullish Confirmation: The chart is screaming BULLISH! 📈 A clean pullback to the moving average shows institutional big dogs 🐶 holding strong. This isn’t just a random pump — it’s a calculated move!
Market Context: JPM’s price action shows resilience, with buyers stepping in at key levels. The moving average is acting like a trusty springboard for the next leg up. 🏀
🕵️♂️ The Thief Strategy: Layered Entries for Max Gains! 🏦
Dear Ladies & Gentlemen, Thief OGs 😎, here’s how we pull off this heist with style:
Entry Plan: Use a layering strategy with multiple limit orders to stack your position like a pro. 🧱
Suggested buy limit layers: $302, $304, $306, $308, $310.
Pro Tip: Feel free to add more layers based on your risk appetite and account size! More layers = more flexibility. 🥞
New traders? You can enter at any price level within this range — the trend is your friend! 🤝
Why Layering?: This strategy lets you scale into the trade, reducing risk while catching the move. It’s like sneaking into the vault with multiple keys! 🔑
🛑 Stop Loss: Protect Your Loot! 💼
Thief SL: Set your stop loss at $298, just below the breakout level to dodge any fakeouts. 🕳️
Note: Dear Thief OGs, this SL is a suggestion. Adjust it based on your strategy and risk tolerance. You’re the mastermind of your own heist! 🧠
Risk Management: Never risk more than you’re willing to lose. Protect your hard-earned cash! 💸
🎯 Target: Cash Out Before the Trap! 🏃♂️
Profit Target: Aim for $325, where we expect strong resistance and potential overbought conditions. 📉
Why $325?: Historical resistance + overbought signals = a classic trap zone. Cash out your profits before the market pulls a fast one! 🪤
Note: Dear Thief OGs, this TP is a guideline. Take profits at your own discretion — secure the bag when you feel it’s right! 💰
🔗 Related Pairs to Watch (with $ Correlations) 👀
Keep an eye on these financial sector buddies to gauge market sentiment:
NYSE:BAC (Bank of America): Moves in tandem with JPM as a fellow banking giant. If BAC is pumping, it’s a good sign for JPM! 📈
Correlation: High positive correlation (~0.8). Strong financial sector momentum often lifts both.
NYSE:WFC (Wells Fargo): Another banking heavyweight. Watch for similar price action to confirm sector strength. 🏦
Correlation: Moderate positive correlation (~0.7). WFC’s moves can signal broader banking trends.
AMEX:XLF (Financial Select Sector SPDR Fund): Tracks the financial sector as a whole. If XLF is bullish, it’s a tailwind for JPM! 🌬️
Correlation: Strong positive correlation (~0.85). XLF’s direction often sets the tone for JPM’s price action.
Key Point: Monitor these pairs for confirmation of JPM’s bullish move. If they’re lagging, proceed with caution — the heist might need a backup plan! 🕵️♀️
✨ If you find value in my analysis, a 👍 and 🚀 boost is much appreciated — it helps me share more setups with the community!
#TradingView #JPM #StockMarket #SwingTrading #DayTrading #TechnicalAnalysis #ThiefStrategy #Bullish
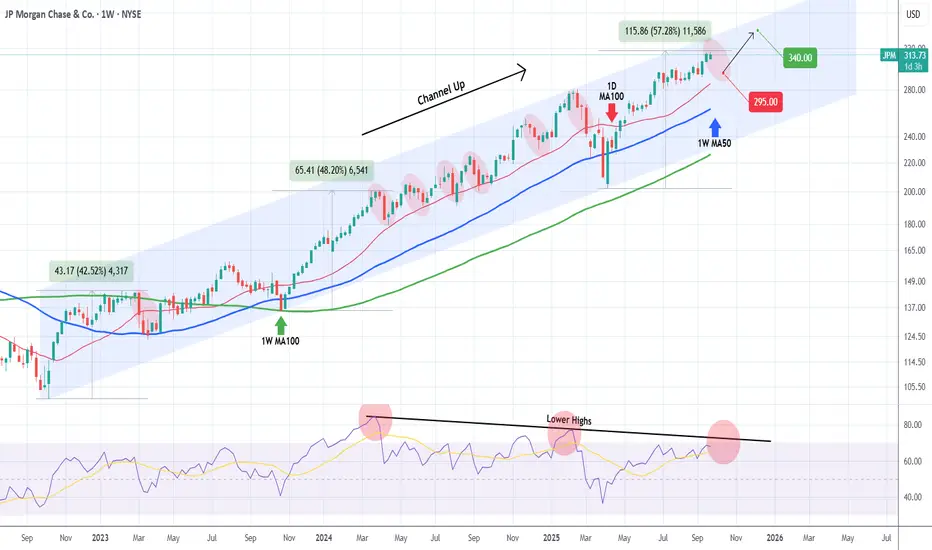
JP MORGAN In need of a relief correction.Last time we took a look at JP Morgan Chase (JPM) was 5 months ago (April 28, see chart below), issuing a strong long-term buy signal, which 2 weeks ago hit our $310 Target:
This time, having already completed a +57.28% rise from the April 07 bottom (Higher Low for the 3-year Channel Up), we expect a medium-term pull-back towards its 1D MA100 (red trend-line), which has systematically been its most common buy entry. The 1W MA50 (blue trend-line) - 1W MA100 (green trend-line) Zone has been the ultimate buy range but since March 2023 has only emerged 3 times.
As a result, given the trajectory of the 1D MA100, we expect the stock to pull-back to $295.00 and if it holds, rebound for an end-of-year rally to $340.00.
-------------------------------------------------------------------------------
** Please LIKE 👍, FOLLOW ✅, SHARE 🙌 and COMMENT ✍ if you enjoy this idea! Also share your ideas and charts in the comments section below! This is best way to keep it relevant, support us, keep the content here free and allow the idea to reach as many people as possible. **
-------------------------------------------------------------------------------
💸💸💸💸💸💸
👇 👇 👇 👇 👇 👇
🇪🇺 EUR/USD — Fundamental Outlook: Constructive / Bullish BiasThe euro continues to benefit from the shift in relative monetary policy. While the Fed is preparing to ease, the ECB remains on hold near 2%, with little pressure to act as Eurozone inflation gradually normalizes. Although growth remains subdued, the ECB is expected to maintain restrictive settings to anchor inflation expectations, providing relative yield support to the EUR.
JPMorgan and Goldman Sachs have reiterated their bullish EUR/USD forecasts, projecting levels between 1.18–1.20 in the next 12 months, citing policy convergence, diversification flows out of U.S. assets, and the euro’s undervaluation. September’s flash HICP (due Sep 2) will be crucial: a stable reading should reinforce the ECB’s stance and underpin EUR/USD.
➡️ Bias: EUR/USD remains a buy-on-dips candidate, with the Fed’s dovish pivot and steady ECB policy driving upside.

ETH/USDT ETH/SDT 1W The market has priced in most scenarios. At this point, the chart tells the story — and it’s playing out as expected

JP MORGAN's long-term bullish trend restored above the 1D MA50.JP Morgan Chase (JPM) broke above its 1D MA50 (red trend-line) last week for the first time since the first week of March and technically put an official end to the 3-month 'Trade War' correction.
This correction has technically been the Bearish Leg of the 2.5-year Channel Up. Every time the 1D MA50 broke and closed a 1W candle above it, the stock started the new Bullish Leg of the pattern. The last Bullish Leg was +6% (+48% against +42%) stronger than the previous one before the first pull-back to the 1D MA50 again.
As a result, we expect to see $310 (+54%) before this year is over.
-------------------------------------------------------------------------------
** Please LIKE 👍, FOLLOW ✅, SHARE 🙌 and COMMENT ✍ if you enjoy this idea! Also share your ideas and charts in the comments section below! This is best way to keep it relevant, support us, keep the content here free and allow the idea to reach as many people as possible. **
-------------------------------------------------------------------------------
💸💸💸💸💸💸
👇 👇 👇 👇 👇 👇

JPMorgan Chase Reports Earnings Today, Topping Q1 EstimatesShares of JPMorgan Chase (NYSE: NYSE:JPM ) are currently up 3% in Friday's premarket session as the asset tops Q1 estimates.
The company reported better-than-expected fiscal first-quarter results as big banks kicked off the new earnings season.
The banking giant reported earnings per share (EPS) of $5.07 on revenue of $45.31 billion, each up from $4.44 and $41.93 billion, respectively, a year ago. According to estimates compiled by Visible Alpha, some analysts had expected $4.64 and $43.55 billion. It generated $23.4 billion in net interest income (NII), above the $23.00 billion consensus.
Shares of JPMorgan were up 3% immediately following the release of Friday's report. They entered the day down roughly 5% year-to-date but up about 16% in the last 12 months.
"The economy is facing considerable turbulence (including geopolitics), with the potential positives of tax reform and deregulation and the potential negatives of tariffs and 'trade wars,' ongoing sticky inflation, high fiscal deficits and still rather high asset prices and volatility," JPMorgan CEO Jamie Dimon said. "As always, we hope for the best but prepare the Firm for a wide range of scenarios."
Dimon wrote in his annual letter to shareholders this week that he expected the Trump administration's tariffs "will slow down growth."
technical Outlook
As of the time of writing, NYSE:JPM shares are already up 1.5% with the asset trading above the support point. A break above the 1-month high pivot could set the course for a bullish campaign eyeing the $260- $280 region.
With the last close RSI at 46, NYSE:JPM shares has more room to capitalize on the dip and make a comeback prior the earnings beat.

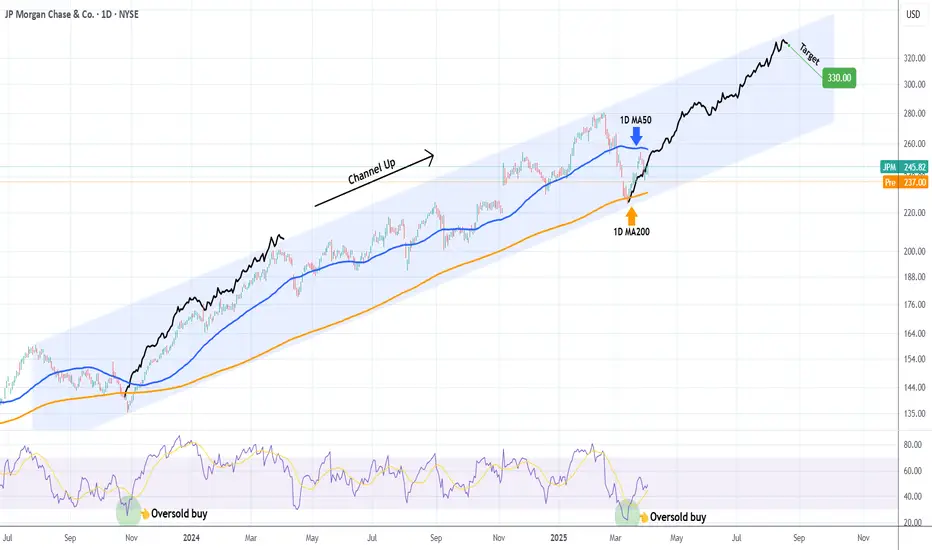
JP MORGAN won't give a better buy opportunity in 2025.Last time we looked at JP Morgan Chase (JPM) on November 27 2024 (see chart below), it gave us a clear sell signal that went straight to our $236 Target:
Now that the price rebounded not only on the 1D MA200 (orange trend-line) but also on the bottom (Higher Lows trend-line) of the long-term Channel Up, we are switching back to buying a we even got the first pull-back on the 1D MA50 (blue trend-line).
Given that the 1D RSI also rebounded from oversold (<30.00) territory like the October 27 2023 Low did, we expect a similar Bullish Leg to follow and thus our Target is $330 at the top of the Channel Up.
-------------------------------------------------------------------------------
** Please LIKE 👍, FOLLOW ✅, SHARE 🙌 and COMMENT ✍ if you enjoy this idea! Also share your ideas and charts in the comments section below! This is best way to keep it relevant, support us, keep the content here free and allow the idea to reach as many people as possible. **
-------------------------------------------------------------------------------
💸💸💸💸💸💸
👇 👇 👇 👇 👇 👇
JP MORGAN: Perfect 1W MA50 rebound targeting $350. JP Morgan is neutral both on its 1D and 1W technical outlooks (RSI = 54.173, MACD = 7.520, ADX = 32.502), suggesting that it remains inside the best buy zone for the long term. As a matter of fact, having rebounded exactly on its 1W MA50, this is the best buy opportunity since October 23rd 2023, which was the last time it hit the 1W MA50. As shown, the long term pattern is a Channel Up and every contact with the 1W MA50 has coincided with a 1W RSI test of the S1 Zone. There is no better buy entry than the current level and we can safely aim for yet another +57.76% run (TP = $350.00).
## If you like our free content follow our profile to get more daily ideas. ##
## Comments and likes are greatly appreciated. ##

JPM JPMorgan Chase Options Ahead of EarningsIf you haven`t bought JPM before the breakout:
Now analyzing the options chain and the chart patterns of JPM JPMorgan Chase prior to the earnings report this week,
I would consider purchasing the 245usd strike price Calls with
an expiration date of 2025-1-17,
for a premium of approximately $5.05.
If these options prove to be profitable prior to the earnings release, I would sell at least half of them.

JPM Bullish Breakout? JPMorgan Trend & Seasonal Insights In this video, we analyze JPM, JP Morgan Chase, which is currently exhibiting a strong bullish trend on the daily timeframe. The stock has consistently retraced to 50% of its previous price swings. Adding a seasonality perspective, we observe a historical pattern where the market tends to sell off into December 20th before rallying through the first or second week of January. My bias remains bullish, with a potential buy at the current price contingent on a break of structure. Please note, this is not financial advice.

JPM. JP Morgan Chase_1Mhello
Analysis of JP Morgan Chase in monthly and long-term timeframes The market is in an upward trend and can move towards 330 Wave 3 Elliot number 1300 Elliot wave 4 number 330 Wave 5 Elliott 3333
Greetings to this great bank

JP MORGAN Expect a 1D MA50 correction before it turns into a buyJP Morgan Chase (JPM) posted a strong bullish leg on our last analysis (September 17, see chart below) that easily hit our $229 Target:
From a wider perspective on the 1D time-frame, the price is now right at the top of the 13-month Channel Up on an overbought 1D RSI and a 1D MACD that is about to form a Bearish Cross.
All previous Higher Highs of the pattern formed MACD Bearish Crosses and pulled back to the 1D MA50 (blue trend-line) on a minimum of -7.35% correction. Note that the 1D MA200 (orange trend-line) never broke, so as long as it holds, the long-term bullish trend is intact.
As a result, we now expect a pull-back to the 1D MA50 and a minimum of -7.35% decline puts the Target a $236.00.
-------------------------------------------------------------------------------
** Please LIKE 👍, FOLLOW ✅, SHARE 🙌 and COMMENT ✍ if you enjoy this idea! Also share your ideas and charts in the comments section below! This is best way to keep it relevant, support us, keep the content here free and allow the idea to reach as many people as possible. **
-------------------------------------------------------------------------------
💸💸💸💸💸💸
👇 👇 👇 👇 👇 👇

JP Morgan Chase weekly (log)Hello commuté,
Weekly chart still in log with linear regression channels
The trend is magnificent, nothing to say it is indeed the first US bank.
The upward trend has been since 2011, it's crazy, right?
The 200-period simple average is in orange on the chart.
Make your opinion, before placing an order.
► Thank you for boosting, commenting, subscribing!

JPM
A correction might not occur, so we position ourselves for the continuation of the movement with a wide stop, but with a high probability of movement in the 5th wave

JP MORGAN to rise at least +14% on this rally.We haven't looked into JP Morgan Chase (JPM) in almost 6 months (March 25, see chart below) and the excellent sell signal it gave us:
That was right at the top of its 2-year Channel Up. Right now we have the price rebounding an pricing a Higher Low on a shorter-term Channel Up since the March 25 High. Being still below its 1D MA50 (blue trend-line), gives time for an early buy.
The minimum % of a Bullish Leg within this Channel Up has been +14.07% so our Target is at $229.00 accordingly.
-------------------------------------------------------------------------------
** Please LIKE 👍, FOLLOW ✅, SHARE 🙌 and COMMENT ✍ if you enjoy this idea! Also share your ideas and charts in the comments section below! This is best way to keep it relevant, support us, keep the content here free and allow the idea to reach as many people as possible. **
-------------------------------------------------------------------------------
💸💸💸💸💸💸
👇 👇 👇 👇 👇 👇

JPMorgan Stock Slumps Amid Interest Income ConcernsJPMorgan Chase & Co. (NYSE: NYSE:JPM ) recently experienced a significant drop in its stock price, slumping over 7% following warnings from its President and COO, Daniel Pinto, about the bank’s net interest income (NII) outlook. As the largest U.S. bank by assets, JPMorgan's financial health is closely watched as a bellwether for the broader banking sector. Here's a deep dive into both the technical and fundamental aspects affecting JPMorgan’s stock.
Fundamental Analysis
JPMorgan's recent stock decline was triggered by Pinto’s comments that NII expectations are overly optimistic given the expected Federal Reserve rate cuts. The Fed is anticipated to lower its key policy rate by at least 25 basis points during its upcoming September meeting, initiating a potential monetary easing cycle. Lower rates are likely to compress NII, which represents the spread between what the bank earns on loans and what it pays on deposits.
Previously, JPMorgan (NYSE: NYSE:JPM ) forecasted its NII to rise to $91 billion this year, excluding its markets division. However, with the Fed’s rate cuts on the horizon, future projections have been adjusted downward. Investors are now concerned that the bank may not hit its 2025 NII target of approximately $90 billion, especially with Pinto's warning that "next year is going to be a bit more challenging."
Expense Outlook and Broader Concerns
Additionally, the analyst estimates for JPMorgan’s expenses in 2025, pegged around $94 billion, have been deemed overly optimistic by Pinto. With inflationary pressures and new investments looming, the bank’s expense base is expected to be higher than current projections. This dual concern over income and expenses has rattled investor confidence, making it JPMorgan's worst drop since June 2020.
Despite these challenges, JPMorgan’s position as a leader in gathering deposits and making loans remains strong. The bank's trading revenue is projected to be flat to slightly up year-over-year, and investment banking fees are expected to rise by about 15%, indicating resilience in other business segments. However, slowing economic growth in the U.S. and an anticipated decline in new loan yields due to rate cuts continue to cloud the outlook.
Technical Analysis
Current Price Action
As of the latest trading session, JPMorgan stock was down 5.19% in extended market trading, reflecting the broader market's nervous reaction to Pinto’s comments. The stock has been under pressure, but the Relative Strength Index (RSI) at 53 suggests that the stock isn’t yet in overbought or oversold territory, indicating a potential for reversal if sentiment shifts positively.
Key Technical Patterns
- Golden Cross Pattern: The daily chart shows a golden cross pattern formed earlier in the year, a bullish indicator where the 50-day moving average crosses above the 200-day moving average. Historically, this pattern has been associated with upward momentum, suggesting potential long-term strength despite current headwinds.
- Support and Resistance Levels: Currently, JPM is trying to establish a base around $133, which acts as a critical support level. A break below this pivot would confirm a bearish reversal pattern, potentially leading to further declines. Conversely, holding above this level could set the stage for a recovery, especially if NII concerns are tempered by unexpected positive news.
- RSI Analysis: The RSI of 53 implies that JPMorgan stock (NYSE: NYSE:JPM ) is positioned for a possible trend reversal. If buying pressure increases, the stock could move towards its next resistance levels near $145 and then $155.
- Bearish Divergence: However, caution is advised as there has been a recent bearish divergence between price and momentum indicators, which could signal further downside if investor sentiment does not improve.
Outlook and Key Considerations
JPMorgan remains fundamentally strong, with robust trading and investment banking revenues cushioning some of the expected pressure on NII. However, the market's reaction to the tempered guidance reflects broader concerns about the impact of lower rates on bank profitability.
For investors, the key takeaway is that while JPMorgan’s stock faces near-term challenges, the bank’s dominant market position, diversified revenue streams, and proactive management strategies still provide a solid foundation. Technically, a close watch on support levels and RSI dynamics will be crucial in determining the stock's short-term direction.
Conclusion
JPMorgan’s recent slump highlights the balancing act the bank must perform amid changing economic conditions. While the market’s reaction has been swift, the long-term narrative for JPMorgan remains constructive, provided the bank can navigate the expected rate cuts and maintain control over rising expenses. For traders and investors, staying informed on both the fundamental outlook and technical patterns will be essential in making well-timed decisions regarding $JPM.

JPM JPMorgan Chase & Co Options Ahead of EarningsIf you haven`t bought the dip on JPM:
Now analyzing the options chain and the chart patterns of JPM JPMorgan Chase & Co prior to the earnings report this week,
I would consider purchasing the 200usd strike price in the money in the money Calls with
an expiration date of 2025-1-17,
for a premium of approximately $17.25.
If these options prove to be profitable prior to the earnings release, I would sell at least half of them.

Buy JP Morgan ChaseShort Term Trading Advice by Naranj Capital
Buy JP Morgan Chase
● Buy Range- 209 - 212
● Target- 222 - 225
● StopLoss- 205
● Potential Return- 5-6%
● Duration- 14-15 Trading Days

JP Morgan Surprises Investors with Strong EarningsOn Friday, JP Morgan surprised investors with a robust earnings release, posting an impressive +4.01% increase and a revenue surge of 20.78% above estimates. This positive news has ignited investor confidence and set the stage for a potential bullish trend.
Historically, JP Morgan's stock has shown a seasonal pattern of growth during this period. Over the past 15 years, the company's stock price has typically increased during the summer months. This historical trend, combined with the recent strong earnings report, suggests a favorable outlook for JP Morgan's stock in the near term.
The pre-market indicators are already showing gains, reflecting investor optimism. Given these positive signals, we are looking to open a long position at the start of the New York session today.
✅ Please share your thoughts about JPM in the comments section below and HIT LIKE if you appreciate my analysis. Don't forget to FOLLOW ME; you will help us a lot with this small contribution.

JPMorgan Chase Stock Dip: An Opportunity Amidst the NumbersIn the wake of last week's unexpected setback for JPMorgan Chase's stock, investors are presented with a perplexing narrative. Contrary to expectations, the banking giant refrained from revising its 2024 revenue guidance, leading to a notable 6% drop in share price. Yet, beneath this seemingly negative surface lies a compelling investment opportunity, driven by robust performance metrics and strategic positioning within the financial sector.
Despite the initial market reaction, JPMorgan Chase's first-quarter results surpassed expectations, with impressive revenue and per-share profit figures. While the lack of upward revision to net interest income guidance caused temporary turbulence, a deeper analysis reveals several positive indicators supporting a bullish outlook.
Notably, JPMorgan Chase has outperformed its competitors in key areas, including loan losses, interest income growth, and revenue diversification. The bank's proactive measures to optimize its balance sheet and enhance fiscal flexibility further underscore its resilience in the face of market challenges.
Moreover, the company's solid financial foundation, highlighted by robust return on equity metrics, distinguishes it as a top performer within the industry. Compared to peers, JPMorgan Chase's profitability remains unmatched, reflecting its ability to deliver consistent shareholder value over the long term.
While market dynamics and external factors may influence short-term stock movements, the intrinsic strength of JPMorgan Chase as a company remains steadfast. As such, the recent dip in share price presents an attractive entry point for investors seeking exposure to a leading player in the financial sector.
In conclusion, JPMorgan Chase stands as a beacon of stability and profitability in an ever-evolving market landscape. The recent downturn in stock price offers investors an opportunity to capitalize on the company's enduring strength and potential for future growth. As always, prudent investors should conduct thorough due diligence and consider their investment objectives before making any decisions.

JPMorgan profit rises 6% But stock Plummets by 4.82%Amidst a 6% surge in profit, JPMorgan Chase ( NYSE:JPM ) faces a rocky road ahead as its interest income forecast falls short, resulting in a 4.82% stock plummet.
Despite the bank's robust financial performance in the first quarter, JPMorgan's ( NYSE:JPM ) projection for income from interest payments failed to meet analysts' expectations, triggering a dip in its shares. CEO Jamie Dimon's cautious outlook underscores the uncertainties looming over the economic horizon, including global conflicts, inflationary pressures, and quantitative tightening.
While the bank anticipates an uptick in net interest income (NII) for the full year, it fell short of market predictions, signaling potential challenges ahead. The dip in share value, however, contrasts analysts' positive sentiments regarding JPMorgan's overall performance in what was described as another "solid" quarter.
As the banking giant grapples with economic uncertainties, its succession plans come into focus, with potential successors to Dimon's leadership identified by the board. Amidst speculation about Dimon's future, both within the bank and potentially in a governmental role, the stability and trajectory of JPMorgan remain under scrutiny.
Despite the challenges, JPMorgan ( NYSE:JPM ) continues to expand its workforce and navigate evolving market dynamics, demonstrating resilience in a volatile financial landscape.
Technical Outlook
JPMorgan ( NYSE:JPM ) stock is nosediving toward a new support zone. The Relative Strength Index (RSI) of 36.91 reaffirms the thesis. The stock is trading below the 50-day Moving Average (MA).
JPMorgan's ( NYSE:JPM ) 4-month Price chart shows a "Bearish Harami" candlestick pattern.

JPM JPMorgan Chase & Co Options Ahead of EarningsIf you haven`t bought JPM before the previous earnings:
Then analyzing the options chain and the chart patterns of JPM JPMorgan Chase & Co prior to the earnings report this week,
I would consider purchasing the 170usd strike price in the money Calls with
an expiration date of 2024-4-19,
for a premium of approximately $28.00.
If these options prove to be profitable prior to the earnings release, I would sell at least half of them.
