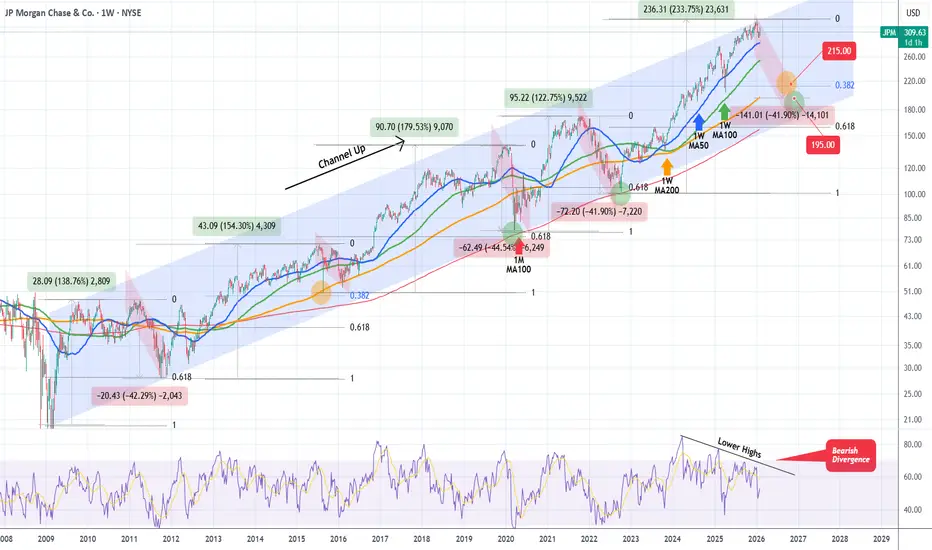
JP MORGAN topped on its 17-year Channel Up. Bear Cycle started.JP Morgan Chase (JPM) has been trading within a 17-year Channel Up since the March 2009 market bottom of the U.S. Housing Crisis. Last month the price hit the exact top of that multi-year pattern and got rejected. Despite the recent rebound, we expect that to be short-lived, as it's not just the Head and Shoulders (H&S) pattern that is being formed but that Channel Up Top alone calls for a strong, potentially 1-year long Bear Cycle.
Such have historically been most major corrections within this pattern, with the last two (2022 Inflation Crisis and 2020 COVID crash) bottomed near the 1M MA100 (red trend-line), which is the utmost long-term Support and the before (2015) bottoming on the 1W MA200 (orange trend-line).
With the 1W RSI currently on a huge Bearish Divergence (Lower Highs against price's Higher Highs) since March 2024, we expect the stock to drop to at least $215.00, which like 2015 will make contact with both the 1W MA200 and the 0.382 Fibonacci retracement level. At most, if the market repeats the -41.90% decline of 2022, we expect it to hit $195.00 just above the 1M MA100.
A deeper correction (which is quite unlikely based on the current fundamentals) would see JPM target the 0.618 Fib, which is where the 2022 and 2020 corrections bottomed, at $160.00.
---
** Please LIKE 👍, FOLLOW ✅, SHARE 🙌 and COMMENT ✍ if you enjoy this idea! Also share your ideas and charts in the comments section below! This is best way to keep it relevant, support us, keep the content here free and allow the idea to reach as many people as possible. **
---
💸💸💸💸💸💸
👇 👇 👇 👇 👇 👇
Jpmorgansignals
JPMorgan( $JPM) Gains on New Paid Fintech Data DealsJPMorgan Chase & Co. (JPM) has reached a series of landmark agreements requiring fintech companies to pay for access to customer bank-account data, marking a major shift in how financial data is shared across the U.S. banking ecosystem.
For years, data aggregators such as Plaid, Yodlee, Morningstar, and Akoya accessed JPMorgan customer data for free, enabling popular fintech apps to offer budgeting tools, payments, and portfolio tracking. Banks have long argued this model was unfair and risky, raising concerns over data privacy, security, and uncompensated use of bank infrastructure.
JPMorgan spokesperson Drew Pusateri confirmed the new paid arrangements, calling them a step toward a safer and more sustainable open-banking framework. The deals were finalized after weeks of negotiation, with JPMorgan reportedly settling for lower fees than initially proposed. In return, aggregators secured concessions on how data requests are processed and stored.
These agreements come as the CFPB’s updated “open banking” rule continues to reshape the data-sharing landscape. Introduced last year, the rule allows consumers to move financial data freely at no cost, sparking pushback from banks but support from fintechs and crypto-adjacent firms. After industry pressure, regulators began revising the rule earlier this year.
For JPMorgan, the new paid model could generate a fresh revenue stream while tightening oversight on third-party data access. It also positions the bank strategically as demand grows for secure data connectivity across fintech platforms.
Technical Outlook: JPM Eyes Bounce Toward $350
JPM has pulled back from recent highs and is now approaching a major support zone around $280, which previously acted as a breakout level. If the stock retests this area and holds, the structure favors a strong upside continuation.
A rebound from support could send JPM back toward $330 and $350, aligning with the stock external bullish trend.

JP MORGAN eyes a potential correction to $210 at least.JP Morgan Chase (JPM) has been trading within a Channel Up since the 2009 bottom of the Housing Crisis. Throughout its course, it has posted 5 strong Bullish Legs, with the current one being the strongest (+221% so far). The result of its strength is the price being exactly at the top (Higher Highs trend-line) of the Channel.
With the 1M RSI extremely overbought and on its highest level since February 2018, the pattern may have reached its upper limit and could be calling for a technical correction. This correction should be in the form of a long-term Bear Cycle (Bearish Leg). Out of the 4 previous Bearish Legs, 3 pulled-back to their 0.618 Fibonacci retracement levels, while 1 to its 0.382 (Fib). That was the only one that found Support on the 1W MA50 (blue trend-line), while the most recent two bottomed on the 1M MA100 (green trend-line).
Note also that 3 of those corrections dropped by around the same %, with the 'weakest' being -41.90% (also the most recent in 2022).
As a result, if JPM has indeed priced its new Top (Channel Up Higher High) currently, a minimum correction to the 0.382 Fib would target $210, while a -41.90% (also minimum) drop would test $190. The latter would also potentially made an ideal contact with the 1M MA100. A 0.618 Fib correction would be at $158, but also below the Channel Up, unless executed very violently, which makes it a less realistic scenario.
---
** Please LIKE 👍, FOLLOW ✅, SHARE 🙌 and COMMENT ✍ if you enjoy this idea! Also share your ideas and charts in the comments section below! This is best way to keep it relevant, support us, keep the content here free and allow the idea to reach as many people as possible. **
---
💸💸💸💸💸💸
👇 👇 👇 👇 👇 👇

JPM Swing Plan → Layered Entries & Profit Targets Mapped😂 JPMorgan Chase (JPM) Swing/Day Trade: The Great Heist Blueprint 🤑💰
🚀 Asset: JPMorgan Chase & Co. ( NYSE:JPM )🎯 Market Profit Realization Plan: Swing/Day Trade📈 Outlook: Bullish vibes confirmed! 💪
📜 The Setup: Why JPM is Ready to Pop! 🎉
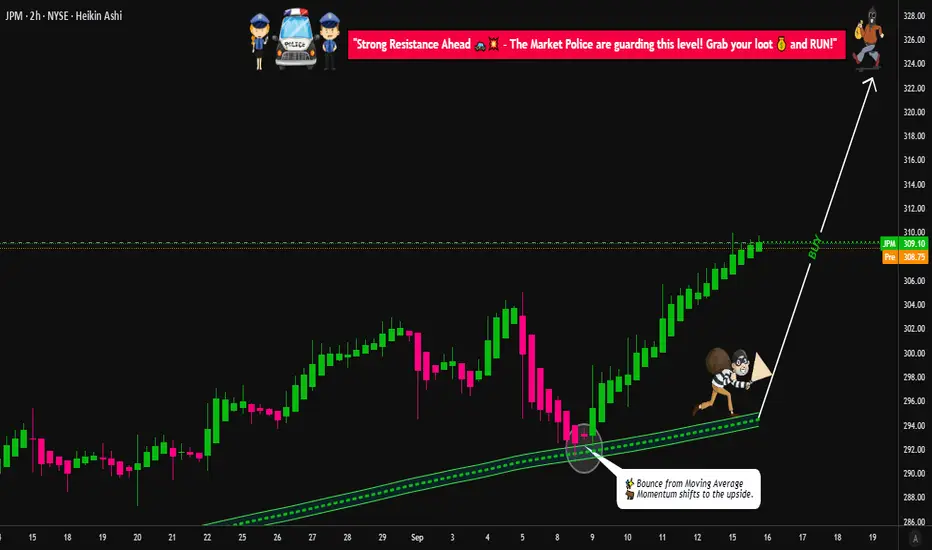
Bullish Confirmation: The chart is screaming BULLISH! 📈 A clean pullback to the moving average shows institutional big dogs 🐶 holding strong. This isn’t just a random pump — it’s a calculated move!
Market Context: JPM’s price action shows resilience, with buyers stepping in at key levels. The moving average is acting like a trusty springboard for the next leg up. 🏀
🕵️♂️ The Thief Strategy: Layered Entries for Max Gains! 🏦
Dear Ladies & Gentlemen, Thief OGs 😎, here’s how we pull off this heist with style:
Entry Plan: Use a layering strategy with multiple limit orders to stack your position like a pro. 🧱
Suggested buy limit layers: $302, $304, $306, $308, $310.
Pro Tip: Feel free to add more layers based on your risk appetite and account size! More layers = more flexibility. 🥞
New traders? You can enter at any price level within this range — the trend is your friend! 🤝
Why Layering?: This strategy lets you scale into the trade, reducing risk while catching the move. It’s like sneaking into the vault with multiple keys! 🔑
🛑 Stop Loss: Protect Your Loot! 💼
Thief SL: Set your stop loss at $298, just below the breakout level to dodge any fakeouts. 🕳️
Note: Dear Thief OGs, this SL is a suggestion. Adjust it based on your strategy and risk tolerance. You’re the mastermind of your own heist! 🧠
Risk Management: Never risk more than you’re willing to lose. Protect your hard-earned cash! 💸
🎯 Target: Cash Out Before the Trap! 🏃♂️
Profit Target: Aim for $325, where we expect strong resistance and potential overbought conditions. 📉
Why $325?: Historical resistance + overbought signals = a classic trap zone. Cash out your profits before the market pulls a fast one! 🪤
Note: Dear Thief OGs, this TP is a guideline. Take profits at your own discretion — secure the bag when you feel it’s right! 💰
🔗 Related Pairs to Watch (with $ Correlations) 👀
Keep an eye on these financial sector buddies to gauge market sentiment:
NYSE:BAC (Bank of America): Moves in tandem with JPM as a fellow banking giant. If BAC is pumping, it’s a good sign for JPM! 📈
Correlation: High positive correlation (~0.8). Strong financial sector momentum often lifts both.
NYSE:WFC (Wells Fargo): Another banking heavyweight. Watch for similar price action to confirm sector strength. 🏦
Correlation: Moderate positive correlation (~0.7). WFC’s moves can signal broader banking trends.
AMEX:XLF (Financial Select Sector SPDR Fund): Tracks the financial sector as a whole. If XLF is bullish, it’s a tailwind for JPM! 🌬️
Correlation: Strong positive correlation (~0.85). XLF’s direction often sets the tone for JPM’s price action.
Key Point: Monitor these pairs for confirmation of JPM’s bullish move. If they’re lagging, proceed with caution — the heist might need a backup plan! 🕵️♀️
✨ If you find value in my analysis, a 👍 and 🚀 boost is much appreciated — it helps me share more setups with the community!
#TradingView #JPM #StockMarket #SwingTrading #DayTrading #TechnicalAnalysis #ThiefStrategy #Bullish
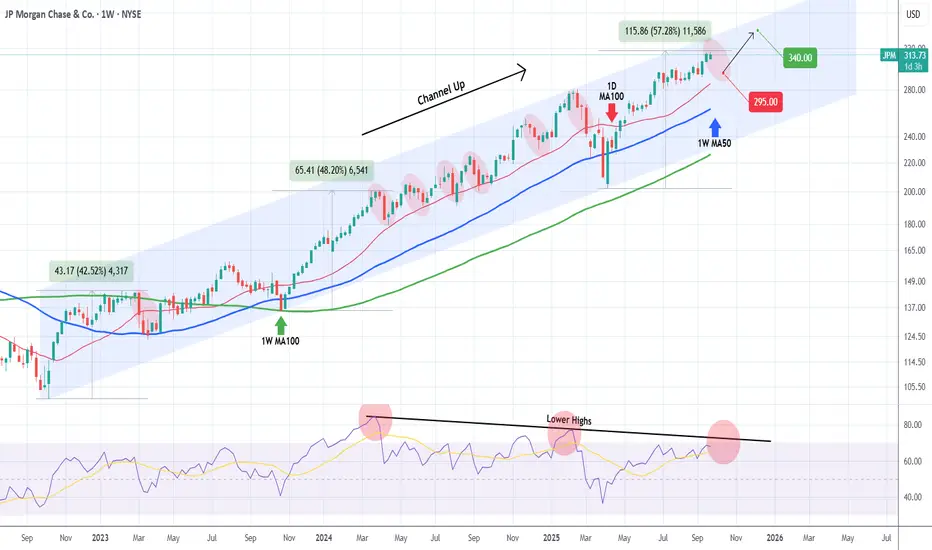
JP MORGAN In need of a relief correction.Last time we took a look at JP Morgan Chase (JPM) was 5 months ago (April 28, see chart below), issuing a strong long-term buy signal, which 2 weeks ago hit our $310 Target:
This time, having already completed a +57.28% rise from the April 07 bottom (Higher Low for the 3-year Channel Up), we expect a medium-term pull-back towards its 1D MA100 (red trend-line), which has systematically been its most common buy entry. The 1W MA50 (blue trend-line) - 1W MA100 (green trend-line) Zone has been the ultimate buy range but since March 2023 has only emerged 3 times.
As a result, given the trajectory of the 1D MA100, we expect the stock to pull-back to $295.00 and if it holds, rebound for an end-of-year rally to $340.00.
-------------------------------------------------------------------------------
** Please LIKE 👍, FOLLOW ✅, SHARE 🙌 and COMMENT ✍ if you enjoy this idea! Also share your ideas and charts in the comments section below! This is best way to keep it relevant, support us, keep the content here free and allow the idea to reach as many people as possible. **
-------------------------------------------------------------------------------
💸💸💸💸💸💸
👇 👇 👇 👇 👇 👇
JP MORGAN's long-term bullish trend restored above the 1D MA50.JP Morgan Chase (JPM) broke above its 1D MA50 (red trend-line) last week for the first time since the first week of March and technically put an official end to the 3-month 'Trade War' correction.
This correction has technically been the Bearish Leg of the 2.5-year Channel Up. Every time the 1D MA50 broke and closed a 1W candle above it, the stock started the new Bullish Leg of the pattern. The last Bullish Leg was +6% (+48% against +42%) stronger than the previous one before the first pull-back to the 1D MA50 again.
As a result, we expect to see $310 (+54%) before this year is over.
-------------------------------------------------------------------------------
** Please LIKE 👍, FOLLOW ✅, SHARE 🙌 and COMMENT ✍ if you enjoy this idea! Also share your ideas and charts in the comments section below! This is best way to keep it relevant, support us, keep the content here free and allow the idea to reach as many people as possible. **
-------------------------------------------------------------------------------
💸💸💸💸💸💸
👇 👇 👇 👇 👇 👇

JPM Bullish Breakout? JPMorgan Trend & Seasonal Insights In this video, we analyze JPM, JP Morgan Chase, which is currently exhibiting a strong bullish trend on the daily timeframe. The stock has consistently retraced to 50% of its previous price swings. Adding a seasonality perspective, we observe a historical pattern where the market tends to sell off into December 20th before rallying through the first or second week of January. My bias remains bullish, with a potential buy at the current price contingent on a break of structure. Please note, this is not financial advice.

JP MORGAN Expect a 1D MA50 correction before it turns into a buyJP Morgan Chase (JPM) posted a strong bullish leg on our last analysis (September 17, see chart below) that easily hit our $229 Target:
From a wider perspective on the 1D time-frame, the price is now right at the top of the 13-month Channel Up on an overbought 1D RSI and a 1D MACD that is about to form a Bearish Cross.
All previous Higher Highs of the pattern formed MACD Bearish Crosses and pulled back to the 1D MA50 (blue trend-line) on a minimum of -7.35% correction. Note that the 1D MA200 (orange trend-line) never broke, so as long as it holds, the long-term bullish trend is intact.
As a result, we now expect a pull-back to the 1D MA50 and a minimum of -7.35% decline puts the Target a $236.00.
-------------------------------------------------------------------------------
** Please LIKE 👍, FOLLOW ✅, SHARE 🙌 and COMMENT ✍ if you enjoy this idea! Also share your ideas and charts in the comments section below! This is best way to keep it relevant, support us, keep the content here free and allow the idea to reach as many people as possible. **
-------------------------------------------------------------------------------
💸💸💸💸💸💸
👇 👇 👇 👇 👇 👇

JP MORGAN to rise at least +14% on this rally.We haven't looked into JP Morgan Chase (JPM) in almost 6 months (March 25, see chart below) and the excellent sell signal it gave us:
That was right at the top of its 2-year Channel Up. Right now we have the price rebounding an pricing a Higher Low on a shorter-term Channel Up since the March 25 High. Being still below its 1D MA50 (blue trend-line), gives time for an early buy.
The minimum % of a Bullish Leg within this Channel Up has been +14.07% so our Target is at $229.00 accordingly.
-------------------------------------------------------------------------------
** Please LIKE 👍, FOLLOW ✅, SHARE 🙌 and COMMENT ✍ if you enjoy this idea! Also share your ideas and charts in the comments section below! This is best way to keep it relevant, support us, keep the content here free and allow the idea to reach as many people as possible. **
-------------------------------------------------------------------------------
💸💸💸💸💸💸
👇 👇 👇 👇 👇 👇

JP MORGAN -15% correction very likely.JP Morgan Chase (JPM) has been trading within a Channel Up since the October 12 2022 market bottom. Friday's high is technically at the top (Higher Highs trend-line) of that Channel Up. The 1D RSI sequence is similar to the one that led March 06 2023 High and subsequent correction.
As you can see, every Higher High rejection (two so far on that pattern) has corrected by around -15%. As a result, we expect a minimum pull-back, below the 1D MA50 (blue trend-line) and towards the 1D MA200 (orange trend-line) of -14.77%, giving us a target of 173.00. That would be exactly on the 0.382 Fibonacci retracement level of the last Higher Low of the Channel Up, similar to March 23 2023.
-------------------------------------------------------------------------------
** Please LIKE 👍, FOLLOW ✅, SHARE 🙌 and COMMENT ✍ if you enjoy this idea! Also share your ideas and charts in the comments section below! This is best way to keep it relevant, support us, keep the content here free and allow the idea to reach as many people as possible. **
-------------------------------------------------------------------------------
💸💸💸💸💸💸
👇 👇 👇 👇 👇 👇

JP MORGAN Approaching the ideal sell level.JP Morgan Chase (JPM) has been trading within a Channel Up pattern since the October 12 2022 market bottom. Currently it is on a relentless rally since the October 27 2023 Higher Low, which is technically the Bullish Leg towards the Channel's top and new Higher High.
The peak points of the previous two main Bullish Legs of the Channel Up, took place when the 1D RSI formed Lower Highs against the price's Higher Highs, which is a technical Bearish Divergence. Since the price is currently so close to the top of the Channel Up, we will wait for the RSI to form that Lower High sequence and enter a confirmed sell. Our target will be 163.00, which is a projected contact with the 1D MA50 (blue trend-line) and the 0.382 Fibonacci Channel level, which has always been reached during Bearish Legs.
-------------------------------------------------------------------------------
** Please LIKE 👍, FOLLOW ✅, SHARE 🙌 and COMMENT ✍ if you enjoy this idea! Also share your ideas and charts in the comments section below! This is best way to keep it relevant, support us, keep the content here free and allow the idea to reach as many people as possible. **
-------------------------------------------------------------------------------
💸💸💸💸💸💸
👇 👇 👇 👇 👇 👇

JPM continuously negative for 6 weeksJPM continuously negative for 6 weeks
This chart shows the weekly candle chart of JP Morgan's stocks over the past two years. The top to bottom golden section at the end of 2021 is superimposed in the figure. As shown in the figure, JP Morgan's stock hit its high point at the end of July and early August of this year, hitting the top to bottom golden ratio of 0.618 in the chart. Then, it has been continuously negative for 6 weeks, and its low point in the past two weeks has hit the top to bottom golden ratio of 1.382 in the chart! So in the future, just use the lowest point of the previous week as the watershed to determine the strength of JP Morgan's stock!

An opportunity to buy JPMorgan stockHi, according to my analysis of .jp morgan stock. There is a fantastic long term investment opportunity. Especially with the price breaking the resistance area at the level of 144. Likewise, the stock exited the sideways channel. We also notice a rising channel as shown in the analysis. good luck for everbody .Note: If you like this analysis, please give your opinion on it. in the comments. I will be happy to share ideas. Like and click to get free content. Thank you

JPMorganstock is breaking through the upper limit!JP Morgan stock is breaking through the upper limit!
This chart shows the weekly level candle chart of JP Morgan stock in the past two years. The graph overlays the top to bottom golden section at the end of 2021. As shown in the figure, the low point of JP Morgan stock at the end of 2022 happens to be around 3.414 points in the golden section, and the high point in November happens to be 1.618 points in the golden section. The high points in January, March, and May this year are exactly 1.382 points in the golden section! Now that JP Morgan stock has broken the upper limit, it is about to test the first wave of low points at the end of 2021 from the top to the bottom!

JP MORGAN Ahead of a Golden Cross. Strong bullish signal!JP Morgan Chase & Co. (JPM) has basically turned sideways since November 11 (despite the marginal November 25 Higher High) putting a pause to the enormous 1-month rally since the October 12 bottom.
The big news on this chart is that the 1D MA50 (blue trend-line) is about to cross above the 1D MA200 (orange trend-line) to form the infamous pattern of the Golden Cross on the 1D time-frame. This is technically very bullish and in fact the last time we saw this formation was on November 13 2020, almost 2 years ago!
As with today, the price was again just below the 0.5 Fibonacci retracement level, just a few days before the Golden Cross formation and after it was completed, started one of the strongest rallies in recent times, making a new All Time High on January 12 2021, essentially just 2 months after.
Now obviously that was the era of 'cheap money', when the Fed printed trillions of USD in a very short period of time to support the economy during the COVID lockdowns. We can't expect the stock to rally as fast and as aggressively but still, as long as the Golden Cross is formed and the 1D MA50 supports, we can target one Fibonacci level at a time.
Notice how similar the 2020 COVID recovery is with the 2022 (today) one. The 1W MA200 is in a symmetrical place, the 1D RSI was pulling back on the same fractal and the 1W MACD rebounded on the same level.
-------------------------------------------------------------------------------
** Please LIKE 👍, SUBSCRIBE ✅, SHARE 🙌 and COMMENT ✍ if you enjoy this idea! Also share your ideas and charts in the comments section below! This is best way to keep it relevant, support me, keep the content here free and allow the idea to reach as many people as possible. **
-------------------------------------------------------------------------------
You may also TELL ME 🙋♀️🙋♂️ in the comments section which symbol you want me to analyze next and on which time-frame. The one with the most posts will be published tomorrow! 👏🎁
-------------------------------------------------------------------------------
💸💸💸💸💸💸
👇 👇 👇 👇 👇 👇
