Bearish reversal off pullback resistance?USD/JPY is reacting off the pivot which is a pullback resistance and could reverse to the overlap support.
Pivot: 156.06
1st Support: 154.92
1st Resistance: 156.87
Disclaimer:
The opinions given above constitute general market commentary and do not constitute the opinion or advice of IC Markets or any form of personal or investment advice.
Any opinions, news, research, analyses, prices, other information, or links to third-party sites contained on this website are provided on an "as-is" basis, are intended to be informative only, and are not advice, a recommendation, research, a record of our trading prices, an offer of, or solicitation for, a transaction in any financial instrument and thus should not be treated as such. The information provided does not involve any specific investment objectives, financial situation, or needs of any specific person who may receive it. Please be aware that past performance is not a reliable indicator of future performance and/or results. Past performance or forward-looking scenarios based upon the reasonable beliefs of the third-party provider are not a guarantee of future performance. Actual results may differ materially from those anticipated in forward-looking or past performance statements. IC Markets makes no representation or warranty and assumes no liability as to the accuracy or completeness of the information provided, nor any loss arising from any investment based on a recommendation, forecast, or any information supplied by any third party
Jpy

GBPJPY SELL SETUP📌 Trade Plan (GBP/JPY – Short Setup)
🔻 Entry Reason
Clear BOS to the downside, confirming bearish structure.
Price is pulling back into a supply zone (red zone) that caused the break of structure.
You’re looking to enter as price mitigates the supply zone and shows rejection.
🔻 Entry
Sell inside the 208.80–208.90 supply zone (upper red box).
Aggressive entry at mitigation or conservative entry after bearish confirmation candle.
🛑 Stop Loss (SL)
Above the supply zone: 209.00–209.05
🎯 Take Profit (TP)
Target the next liquidity area / downside imbalance:
207.50–207.45
This is the projected downside zone shown by the blue arrow.
📉 Why This Trade Makes Sense
Bearish BOS → confirms sellers in control.
Price returning to the origin of the sell-off → ideal supply mitigation.
Expecting continuation toward fresh liquidity below.

Bullish momentum to extend?CAD/JPY could fall to the pivot and could bounce to the 1st resistance.
Pivot: 112.21
1st Support: 111.60
1st Resistance: 113.86
Disclaimer:
The opinions given above constitute general market commentary and do not constitute the opinion or advice of IC Markets or any form of personal or investment advice.
Any opinions, news, research, analyses, prices, other information, or links to third-party sites contained on this website are provided on an "as-is" basis, are intended to be informative only, and are not advice, a recommendation, research, a record of our trading prices, an offer of, or solicitation for, a transaction in any financial instrument and thus should not be treated as such. The information provided does not involve any specific investment objectives, financial situation, or needs of any specific person who may receive it. Please be aware that past performance is not a reliable indicator of future performance and/or results. Past performance or forward-looking scenarios based upon the reasonable beliefs of the third-party provider are not a guarantee of future performance. Actual results may differ materially from those anticipated in forward-looking or past performance statements. IC Markets makes no representation or warranty and assumes no liability as to the accuracy or completeness of the information provided, nor any loss arising from any investment based on a recommendation, forecast, or any information supplied by any third party

USDJPY DUBBLE BOTTOM (READ CAPTION)Hi trader's what do you think about USDJPY
The market is currently forming a Double Bottom structure, showing early signs of a potential bullish reversal. Price is moving inside a falling channel, and buyers are starting to react strongly from the lower support zone.
🔹 Key Levels
Support (FVG Support Zone): Strong reaction area around 153.90–154.10 where buyers stepped in.
Double Bottom: Price has formed two equal lows, indicating seller exhaustion and buyer interest.
Resistance: 155.78 — This is the major intraday resistance level.
🔹 Breakout Confirmation
If price breaks and closes above 155.78, this will confirm the reversal and open the path toward the 156.30 demand zone.
🔹 Demand Zone – 156.30
This is the upside target where price is expected to move if the breakout is successful.
This zone previously acted as a supply area and now serves as a potential bullish target.
📉 Scenario if No Breakout
If the market fails to break 155.78, price can make another retest toward the FVG support before another attempt to move upward.
📈 Market Outlook
Breakout above 155.78 → Bullish continuation
Target → 156.30 Demand Zone
Double Bottom + Channel Break = Strong reversal structure
FVG support holding → Buyer strength confirmed
please don't forget to like comment thank you

Is EJ Going Higher?EURJPY Weekly Chart Analysis — December 9, 2025
The Euro/Japanese Yen (EURJPY) displayed strong movement this week on the 1-week timeframe. The pair opened at 180.775 and closed at 182.010, resulting in a solid weekly gain of +1.164 (+0.64%). During the session, EURJPY hit a high of 182.146 and a low of 180.490. This range points to heightened activity and a clear upward bias during the week.
The Parabolic SAR (0.02) continues to offer guidance for trend-following traders. With the weekly candle closing near its high and above its opening, bullish sentiment persists in the medium-term outlook.
Key Technical Levels:
Weekly Resistance: 182.146 (high)
Weekly Support: 180.490 (low)
Outlook:
Buyers currently appear to have the upper hand, with the price edging toward resistance. A break above 182.146 could signal continued upward momentum. Conversely, a shift below 180.490 would be an early warning for a possible bearish reversal. As always, supporting indicators and broader market trends should be checked for confirmation.
Stay tuned for more weekly insights as EURJPY charts unfold!

Big Week for USD: USDJPY Approaches Major Sell Zone!Hey Traders,
In today's trading session we are monitoring USDJPY for a selling opportunity around the 155.750 zone. USDJPY is trading in a downtrend and is currently in a correction phase, approaching the trend area at 155.750, which acts as a key support-turned-resistance level.
On the fundamental side, recent U.S. data continues to support a weaker Dollar as markets increasingly price in a 25bps cut heading into the FOMC. With traders front-running the event, USD momentum remains fragile. If the market over-prices the move ahead of Wednesday, be cautious of the classic "buy the rumor, sell the fact" dynamic.
This broader Dollar softening environment supports further downside in USDJPY as long as the pair remains below the trend structure.
Trade safe,
Joe.

Bullish momentum to continue?USD/JPY is reacting off the pivot which is a pullback resistance, a breakout of this level could lead the price to rise to the 1st resistance.
Pivot: 156.06
1st Support: 155.46
1st Resistance: 157.18
Disclaimer:
The opinions given above constitute general market commentary and do not constitute the opinion or advice of IC Markets or any form of personal or investment advice.
Any opinions, news, research, analyses, prices, other information, or links to third-party sites contained on this website are provided on an "as-is" basis, are intended to be informative only, and are not advice, a recommendation, research, a record of our trading prices, an offer of, or solicitation for, a transaction in any financial instrument and thus should not be treated as such. The information provided does not involve any specific investment objectives, financial situation, or needs of any specific person who may receive it. Please be aware that past performance is not a reliable indicator of future performance and/or results. Past performance or forward-looking scenarios based upon the reasonable beliefs of the third-party provider are not a guarantee of future performance. Actual results may differ materially from those anticipated in forward-looking or past performance statements. IC Markets makes no representation or warranty and assumes no liability as to the accuracy or completeness of the information provided, nor any loss arising from any investment based on a recommendation, forecast, or any information supplied by any third party

USD/JPY - Interest Rate Ahead! (08.12.2025) 📝 Description FX:USDJPY
USD/JPY continues to respect the Bearish Channel Pattern, with price rejecting the upper boundary and failing to break the resistance zone. Combined with strong fundamentals—expected Fed rate cut and potential BoJ tightening—the setup favors downside movement.
A break and retest of intraday support confirms continuation toward lower channel targets.
📌 Trading Plan📉 Bearish Continuation
Entry Idea: Look for sells below 155.00 after confirmation
Target 1: 154.28 (1st Support)
Target 2: 153.94 (2nd Support / Channel Bottom)
Bearish Confirmation: Clean rejection from resistance zone + break below small retracement support
⚠️ Fundamental Updates (Today)
1️⃣ Federal Reserve Meeting
→ Markets widely expect a rate cut, weakening the USD.
2️⃣ Bank of Japan Rate Outlook
→ BoJ may increase interest rates, a JPY-strengthening factor.
Combined effect:
🔻 USD weak + 🔺 JPY strong → Bearish USD/JPY bias
⚠️ Disclaimer
This idea is for educational analysis only.
Not financial advice. Always trade with proper risk management.
👍 Support the Analysis❤️ LIKE the post💬 COMMENT your view🔁 SHARE to help others
Your support motivates more high-quality analysis! 🙌
#USDJPY #ForexTrading #BearishSetup #ChannelPattern #TechnicalAnalysis #FundamentalAnalysis #JPY #USD #FXMarket #TradingView #PriceAction #Kabhi_TA_Trading

EUR/JPY Breakout On the Horizon?The daily chart shows an established uptrend on EUR/JPY, which is respecting the 20-day EMA as support. Prices have been within a consolidation the past couple of weeks which a symmetrical triangle. The pattern projects an upside target near the monthly R1 pivot, just above the 183 handle.
Bulls could seek dips within Monday's range in anticipation of a break above the November high and run towards 183.
Matt Simpson, Market Analyst at City Index.

USD/JPY Turns Higher Ahead of FOMCUSD/JPY has turned higher after an 11-day pullback from the November peak. Two bullish hammers formed around the October high, supported by RSI(2) divergence and RSI(14) holding above 50 — a sign momentum never fully shifted to bears.
Price continues to close above the key 155 level, often watched for potential MOF sensitivity, though intervention risk typically hinges on volatility rather than a specific number.
On the 1-hour chart, a clear bullish structure is in place with higher highs and higher lows while the 10-bar EMA acts as dynamic support. The pair is now eyeing the weekly R1 pivot at 156.20 and the high-volume node near 156.35. A break above 156.50 would open the path towards 157, with follow-through likely dictated by the market’s read on this week’s FOMC tone.
Matt Simpson, Market Analyst at City Index

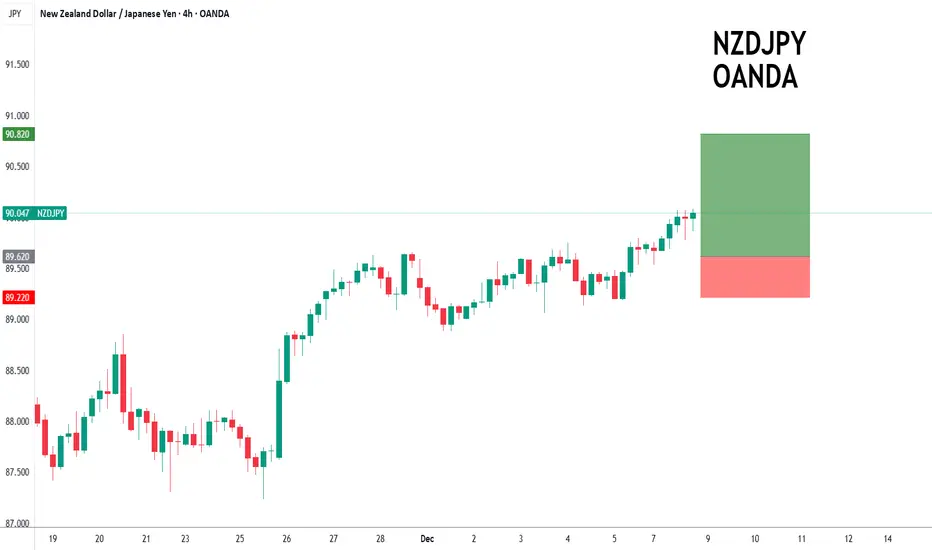
NZDJPY intraday dips continue to attract buyers.NZDJPY - 24h expiry
Intraday dips continue to attract buyers and there is no clear indication that this sequence for trading is coming to an end.
88.88 has been pivotal.
20 4hour EMA is at 89.62.
The RSI is trending higher.
Dip buying offers good risk/reward.
We look to Buy at 89.62 (stop at 89.22)
Our profit targets will be 90.82 and 91.02
Resistance: 90.07 / 90.50 / 91.00
Support: 89.60 / 89.06 / 88.88
Risk Disclaimer
The trade ideas beyond this page are for informational purposes only and do not constitute investment advice or a solicitation to trade. This information is provided by Signal Centre, a third-party unaffiliated with OANDA, and is intended for general circulation only. OANDA does not guarantee the accuracy of this information and assumes no responsibilities for the information provided by the third party. The information does not take into account the specific investment objectives, financial situation, or particular needs of any particular person. You should take into account your specific investment objectives, financial situation, and particular needs before making a commitment to trade, including seeking, under a separate engagement, as you deem fit.
You accept that you assume all risks in independently viewing the contents and selecting a chosen strategy.
Where the research is distributed in Singapore to a person who is not an Accredited Investor, Expert Investor or an Institutional Investor, Oanda Asia Pacific Pte Ltd (“OAP“) accepts legal responsibility for the contents of the report to such persons only to the extent required by law. Singapore customers should contact OAP at 6579 8289 for matters arising from, or in connection with, the information/research distributed.
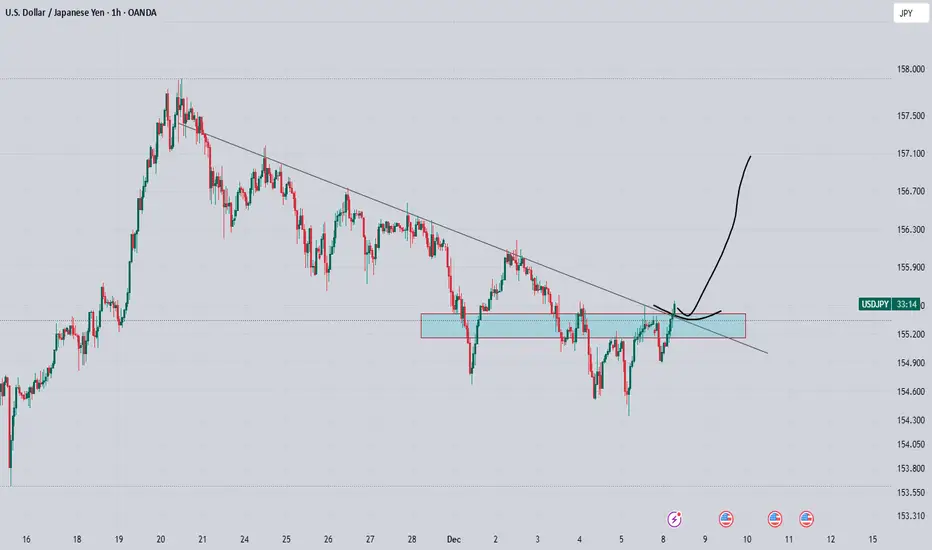
usdjpy looking bullish over all trend is bullish and now trying to break this trendline, successful breakout of tl and horizontal zone can lead 100 pips bullish rally from here
Bullish bounce off?USD/JPY is reacting off the pivot, which has been identified as a pullback support and could rise to the 1st resistanceance.
Pivot: 154.41
1st Support: 151.03
1st Resistance: 158.33
Disclaimer:
The opinions given above constitute general market commentary and do not constitute the opinion or advice of IC Markets or any form of personal or investment advice.
Any opinions, news, research, analyses, prices, other information, or links to third-party sites contained on this website are provided on an "as-is" basis, are intended to be informative only, and are not advice, a recommendation, research, a record of our trading prices, an offer of, or solicitation for, a transaction in any financial instrument and thus should not be treated as such. The information provided does not involve any specific investment objectives, financial situation, or needs of any specific person who may receive it. Please be aware that past performance is not a reliable indicator of future performance and/or results. Past performance or forward-looking scenarios based upon the reasonable beliefs of the third-party provider are not a guarantee of future performance. Actual results may differ materially from those anticipated in forward-looking or past performance statements. IC Markets makes no representation or warranty and assumes no liability as to the accuracy or completeness of the information provided, nor any loss arising from any investment based on a recommendation, forecast, or any information supplied by any third party.

Bearish reversal setup?USD/JPY is rising towards the resistance level, which his a pullback resistance that aligns with the 50% Fibonacci retracement and could reverse from this level to our take profit.
Entry: 156.29
Why we like it:
There is a pullback resistance level that aligns with the 50% Fibonacci retracement.
Stop loss: 157.56
Why we like it:
There is a swing high resistance level.
Take profit: 154.27
Why we like it:
There is an overlap support level.
Enjoying your TradingView experience? Review us!
Please be advised that the information presented on TradingView is provided to Vantage (‘Vantage Global Limited’, ‘we’) by a third-party provider (‘Everest Fortune Group’). Please be reminded that you are solely responsible for the trading decisions on your account. There is a very high degree of risk involved in trading. Any information and/or content is intended entirely for research, educational and informational purposes only and does not constitute investment or consultation advice or investment strategy. The information is not tailored to the investment needs of any specific person and therefore does not involve a consideration of any of the investment objectives, financial situation or needs of any viewer that may receive it. Kindly also note that past performance is not a reliable indicator of future results. Actual results may differ materially from those anticipated in forward-looking or past performance statements. We assume no liability as to the accuracy or completeness of any of the information and/or content provided herein and the Company cannot be held responsible for any omission, mistake nor for any loss or damage including without limitation to any loss of profit which may arise from reliance on any information supplied by Everest Fortune Group.

Bullish reversal setup?USD/JPY has bounced off the pivot which acts as an overlap support and could potentially rise to the 50% Fibonacci resistance.
Pivot: 154.44
1st Support: 153.45
1st Resistance: 156.28
Disclaimer:
The opinions given above constitute general market commentary and do not constitute the opinion or advice of IC Markets or any form of personal or investment advice.
Any opinions, news, research, analyses, prices, other information, or links to third-party sites contained on this website are provided on an "as-is" basis, are intended to be informative only, and are not advice, a recommendation, research, a record of our trading prices, an offer of, or solicitation for, a transaction in any financial instrument and thus should not be treated as such. The information provided does not involve any specific investment objectives, financial situation, or needs of any specific person who may receive it. Please be aware that past performance is not a reliable indicator of future performance and/or results. Past performance or forward-looking scenarios based upon the reasonable beliefs of the third-party provider are not a guarantee of future performance. Actual results may differ materially from those anticipated in forward-looking or past performance statements. IC Markets makes no representation or warranty and assumes no liability as to the accuracy or completeness of the information provided, nor any loss arising from any investment based on a recommendation, forecast, or any information supplied by any third party.

Bullish reversal off overlap support?USDJPY is falling towards the support level, which is an overlap support that is slightly above the 618% Fibonacci retracement and also aligns with the 61.8% Fibonacci projection and could bounce from this level to our take profit.
Entry: 154.23
Why we like it:
There is an overlap support level that is slightly above the 618% Fibonacci retracement and also aligns with the 61.8% Fibonacci projection.
Stop loss: 153.04
Why we like it:
There is an overlap support that aligns with he 78.6% Fibonacci retracement and the 100% Fibonacci projection.
Take profit: 156.21
Why we like it:
There is an overlap resistance level.
Enjoying your TradingView experience? Review us!
Please be advised that the information presented on TradingView is provided to Vantage (‘Vantage Global Limited’, ‘we’) by a third-party provider (‘Everest Fortune Group’). Please be reminded that you are solely responsible for the trading decisions on your account. There is a very high degree of risk involved in trading. Any information and/or content is intended entirely for research, educational and informational purposes only and does not constitute investment or consultation advice or investment strategy. The information is not tailored to the investment needs of any specific person and therefore does not involve a consideration of any of the investment objectives, financial situation or needs of any viewer that may receive it. Kindly also note that past performance is not a reliable indicator of future results. Actual results may differ materially from those anticipated in forward-looking or past performance statements. We assume no liability as to the accuracy or completeness of any of the information and/or content provided herein and the Company cannot be held responsible for any omission, mistake nor for any loss or damage including without limitation to any loss of profit which may arise from reliance on any information supplied by Everest Fortune Group.

USDJPY Channel Up is pulling back in search of a bottom.The USDJPY pair has been trading within a Channel Up pattern since the April 22 market bottom. Right now it is on its latest Bearish Leg, correcting the rally that priced the Higher High, in search of a bottom (Higher Low).
The last pure Higher Low was priced exactly on the 1D MA100 (green trend-line). We expect the price to bounce either on the 1D MA50 or on the 1D MA100, which means for traders that they can allocate the risk (lots) evenly on those entries. The Target is the 162.000 Resistance.
---
** Please LIKE 👍, FOLLOW ✅, SHARE 🙌 and COMMENT ✍ if you enjoy this idea! Also share your ideas and charts in the comments section below! This is best way to keep it relevant, support us, keep the content here free and allow the idea to reach as many people as possible. **
---
💸💸💸💸💸💸
👇 👇 👇 👇 👇 👇

USDJPY H4 | Bearish Drop In PlayMomentum: Bullish
The price has rejected the sell entry, which aligns with the 50% Fibonacci retracement, adding significant strength to this level.
Sell entry: 156.30
Pullback resistance
50% Fibonacci retracement
Stop loss: 157.63
Swing high resistance
Take profit: 154.30
Overlap support
Slightly below the 38.2% Fibonacci retracement
High Risk Investment Warning
Stratos Markets Limited (tradu.com ), Stratos Europe Ltd (tradu.com ):
CFDs are complex instruments and come with a high risk of losing money rapidly due to leverage. 70% of retail investor accounts lose money when trading CFDs with this provider. You should consider whether you understand how CFDs work and whether you can afford to take the high risk of losing your money.
Stratos Global LLC (tradu.com ): Losses can exceed deposits.
Please be advised that the information presented on TradingView is provided to Tradu (‘Company’, ‘we’) by a third-party provider (‘TFA Global Pte Ltd’). Please be reminded that you are solely responsible for the trading decisions on your account. Any information and/or content is intended entirely for research, educational and informational purposes only and does not constitute investment or consultation advice or investment strategy. The information is not tailored to the investment needs of any specific person and therefore does not involve a consideration of any of the investment objectives, financial situation or needs of any viewer that may receive it. Past performance is not a reliable indicator of future results. Actual results may differ materially from those anticipated in forward-looking or past performance statements. We assume no liability as to the accuracy or completeness of any of the information and/or content provided herein and the Company cannot be held responsible for any omission, mistake nor for any loss or damage including without limitation to any loss of profit which may arise from reliance on any information supplied by TFA Global Pte Ltd.

USDJPY H4 | Potential Bullish BounceMomentum: Bullish
The price is falling towards the buy entry, which is an overlap support and also aligns with the 38.2% Fibonacci retracement.
Buy etry: 154.68
Overlap support
38.2% FIbonacci retraceemt
Stop loss: 153.49
Pullback support
50% FIbonacci retracement
Take profit: 156.32
Pullback resistance
High Risk Investment Warning
Stratos Markets Limited (tradu.com ), Stratos Europe Ltd (tradu.com ):
CFDs are complex instruments and come with a high risk of losing money rapidly due to leverage. 70% of retail investor accounts lose money when trading CFDs with this provider. You should consider whether you understand how CFDs work and whether you can afford to take the high risk of losing your money.
Stratos Global LLC (tradu.com ): Losses can exceed deposits.
Please be advised that the information presented on TradingView is provided to Tradu (‘Company’, ‘we’) by a third-party provider (‘TFA Global Pte Ltd’). Please be reminded that you are solely responsible for the trading decisions on your account. Any information and/or content is intended entirely for research, educational and informational purposes only and does not constitute investment or consultation advice or investment strategy. The information is not tailored to the investment needs of any specific person and therefore does not involve a consideration of any of the investment objectives, financial situation or needs of any viewer that may receive it. Past performance is not a reliable indicator of future results. Actual results may differ materially from those anticipated in forward-looking or past performance statements. We assume no liability as to the accuracy or completeness of any of the information and/or content provided herein and the Company cannot be held responsible for any omission, mistake nor for any loss or damage including without limitation to any loss of profit which may arise from reliance on any information supplied by TFA Global Pte Ltd.

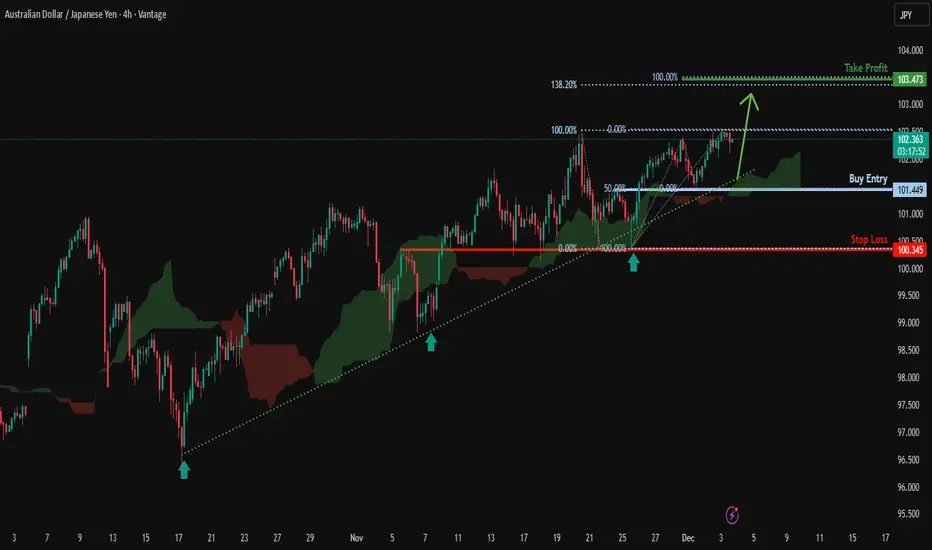
Bullish momentum to extend?AUD/JPY has bounced off the support level, which is a pullback support that aligns with the 50% Fibonacci retracement and could rise from this level to our take profit.
Entry: 101.44
Why we like it:
There is a pullback support level that aligns with the 50% Fibonacci retracement.
Stop loss: 100.34
Why we lik eit:
There is an overlap support level.
Take profit: 103.47
Why we like it:
There is a resistance level that aligns with the 138.2% Fibonacci extension and the 100% Fibonacci projection.
Enjoying your TradingView experience? Review us!
Please be advised that the information presented on TradingView is provided to Vantage (‘Vantage Global Limited’, ‘we’) by a third-party provider (‘Everest Fortune Group’). Please be reminded that you are solely responsible for the trading decisions on your account. There is a very high degree of risk involved in trading. Any information and/or content is intended entirely for research, educational and informational purposes only and does not constitute investment or consultation advice or investment strategy. The information is not tailored to the investment needs of any specific person and therefore does not involve a consideration of any of the investment objectives, financial situation or needs of any viewer that may receive it. Kindly also note that past performance is not a reliable indicator of future results. Actual results may differ materially from those anticipated in forward-looking or past performance statements. We assume no liability as to the accuracy or completeness of any of the information and/or content provided herein and the Company cannot be held responsible for any omission, mistake nor for any loss or damage including without limitation to any loss of profit which may arise from reliance on any information supplied by Everest Fortune Group.
Bearish drop?USD/JPY is reacting off the pivot, which acts as a pullback resistance and could drop to the 1st support.
Pivot: 155.79
1st Support: 154.14
1st Resistance: 156.91
Disclaimer:
The opinions given above constitute general market commentary and do not constitute the opinion or advice of IC Markets or any form of personal or investment advice.
Any opinions, news, research, analyses, prices, other information, or links to third-party sites contained on this website are provided on an "as-is" basis, are intended to be informative only, and are not advice, a recommendation, research, a record of our trading prices, an offer of, or solicitation for, a transaction in any financial instrument and thus should not be treated as such. The information provided does not involve any specific investment objectives, financial situation, or needs of any specific person who may receive it. Please be aware that past performance is not a reliable indicator of future performance and/or results. Past performance or forward-looking scenarios based upon the reasonable beliefs of the third-party provider are not a guarantee of future performance. Actual results may differ materially from those anticipated in forward-looking or past performance statements. IC Markets makes no representation or warranty and assumes no liability as to the accuracy or completeness of the information provided, nor any loss arising from any investment based on a recommendation, forecast, or any information supplied by any third party.

Potential bearish reversal?USD/JPY is rising towards the resistance level, which is a pullback resistance that aligns with the 50% Fibonacci retracement and could reverse from this level to our take profit.
Entry: 156.32
Why we like it:
There is a pullback resistance level that aligns with the 50% Fibonacci retracement.
Stop loss: 157.56
Why we like it:
There is a swing high resistance level.
Take profit: 154.30
Why we like it:
There is an overlap support level that is slightly above the 61.8% Fibonacci retracement.
Enjoying your TradingView experience? Review us!
Please be advised that the information presented on TradingView is provided to Vantage (‘Vantage Global Limited’, ‘we’) by a third-party provider (‘Everest Fortune Group’). Please be reminded that you are solely responsible for the trading decisions on your account. There is a very high degree of risk involved in trading. Any information and/or content is intended entirely for research, educational and informational purposes only and does not constitute investment or consultation advice or investment strategy. The information is not tailored to the investment needs of any specific person and therefore does not involve a consideration of any of the investment objectives, financial situation or needs of any viewer that may receive it. Kindly also note that past performance is not a reliable indicator of future results. Actual results may differ materially from those anticipated in forward-looking or past performance statements. We assume no liability as to the accuracy or completeness of any of the information and/or content provided herein and the Company cannot be held responsible for any omission, mistake nor for any loss or damage including without limitation to any loss of profit which may arise from reliance on any information supplied by Everest Fortune Group.

Live trade: CAD JPY long, fundamental analysis The overall market mood remains positive and following a brief period of 'UEDA hike chatter strength', the JPY is weakening again.
You could put forward a case to long any of the currencies Vs the JPY as a 'risk on' trade. I've chosen the CAD as has it has maintained Friday's 'post GDP positivity'.
The risk to the trade is negative market sentiment, BOJ hike chatter, possibly the falling oil price, or, once again, the stop loss is 'only' behind a 15min swing.
I will hold the trade through market close if required.
