Elite | USDJPY – H1 | Range Compression & Key Decision ZoneFX:USDJPY
The pair remains range-bound between 157.75 resistance and 155.80–156.00 support. Current price action reflects equilibrium, with liquidity resting above range highs and below range lows. Directional bias will depend on confirmation, not anticipation.
Key Scenarios
✅ Bullish Case 🚀
– Hold above range mid + trendline
– H1 close above 157.75 → Bullish BOS
🎯 Target 1: 158.20
🎯 Target 2: 159.00
🎯 Target 3: 160.00 (HTF liquidity)
❌ Bearish Case 📉
– Failure at range mid
– Acceptance below 155.80
🎯 Downside Target: 154.35
Current Levels to Watch
Resistance 🔴: 157.75
Support 🟢: 156.00
Invalidation ❌: H1 close below 155.80
⚠️ Disclaimer: This analysis is for educational purposes only. Not financial advice.
JPYUSD

JPYUSD (Japanese Yen vs US Dollar) 1H OutlookJPYUSD (Japanese Yen vs US Dollar) 1H Outlook – Range-to-Break Setup Using EMA, Fibonacci, RSI
On the 1H chart, JPYUSD has transitioned from a clear bearish sequence into a stabilization phase, driven by a sharp rebound from the recent weak low. Price is now consolidating beneath a marked strong high, creating a classic “compression under resistance” structure. Today’s trade plan focuses on two outcomes: breakout continuation or rejection back into the range.
Market Structure and Trend Context (1H)
Earlier price action shows multiple BOS/CHoCH events consistent with a prior downtrend, followed by a strong rebound.
The rebound stalled at the strong high area, and price is now rotating in a tight band around the EMA cluster.
This is typically where liquidity builds before the next directional move.
Bias for today:
Neutral to mildly bullish while price holds above the mid-range Fibonacci support.
Bearish only if the structure loses the rebound base and momentum fails below key EMAs.
Key Support and Resistance Levels (Intraday)
Resistance
0.006386 – 0.006393: First sell zone (EMA compression + Fibonacci 0.382/0.236 area)
0.006400 – 0.006405: Strong high / breakout trigger zone
0.006410 – 0.006420: Higher supply zone (next major upside magnet)
Support
0.006381: Mid-range pivot (often becomes the “line in the sand” intraday)
0.006376: Fibonacci 0.618 retracement (important dip-buy/defense level)
0.006368: Fibonacci 0.786 retracement (last support before deeper pullback)
0.006360 – 0.006358: Rebound base / weak low area (critical downside test)
0.006352 – 0.006345: Deeper demand zone (only in play if breakdown accelerates)
Fibonacci Map (Rebound Swing Low → Swing High)
Using the visible rebound leg (approx. 0.006358 low → 0.006404 high), the key pullback levels align cleanly with current price:
0.382: ~0.006386
0.5: ~0.006381
0.618: ~0.006376
0.786: ~0.006368
This explains why price is “sticking” around 0.006381–0.006386: it’s a Fibonacci equilibrium zone plus EMA friction.
EMA Read (Trend Filter)
Price is currently interacting with the EMA cluster, which often acts as a “decision band.”
Bullish continuation becomes higher probability if price can reclaim and hold above the faster EMAs, then break the strong-high ceiling.
If price keeps closing below the EMA cluster, rallies into 0.006386–0.006393 are more likely to be sold.
RSI Confirmation (Momentum Trigger)
Use RSI as execution confirmation rather than prediction:
Bullish trigger: RSI holds above 50 and makes higher lows while price defends 0.006381–0.006376
Bearish trigger: RSI fails below 50 and breaks down while price loses 0.006376
High-Probability Trade Plans (Today)
Plan A: Breakout Long (Best If Market Expands)
Condition: 1H close above 0.006400 – 0.006405
Entry: breakout pullback/retest into 0.006400
Stop: below 0.006393
Targets: 0.006410 – 0.006420 (primary), extension if momentum stays strong
Logic: breaking the strong high usually releases trapped liquidity and opens the next supply zone.
Plan B: Range Dip Buy (Controlled Re-Entry)
Entry zone: 0.006381 → 0.006376
Stop: below 0.006368
Targets: 0.006386 – 0.006393, then 0.006400 – 0.006405
Logic: buying the Fibonacci equilibrium/0.618 zone only works if RSI stabilizes and price respects the rebound structure.
Plan C: Rejection Sell (If Resistance Holds Firm)
Entry zone: 0.006386 – 0.006393 on bearish rejection
Stop: above 0.006400
Targets: 0.006381, 0.006376, then 0.006368
Logic: if EMA band keeps acting as a cap, the market often rotates back into the mid-range supports.
Plan D: Breakdown Continuation (Only After Confirmation)
Condition: 1H close below 0.006368
Entry: retest failure back under 0.006368
Stop: above 0.006376
Targets: 0.006360 – 0.006358, then 0.006352 – 0.006345
Logic: losing 0.786 and the rebound base typically invites a deeper liquidity sweep.
Summary Bias
Bullish continuation requires a clean break and hold above 0.006400–0.006405
Otherwise, expect range rotation between 0.006393 resistance and 0.006376/0.006368 support
A confirmed close below 0.006368 shifts bias bearish toward the rebound base
Risk note: This is educational analysis, not financial advice. Always manage position size and define invalidation before entry.

JPYUSD 1H Technical Analysis TodayJPYUSD 1H Technical Analysis Today: Weak Low Sweep Risk, Fibonacci Rebound Zone, EMA Overhead Pressure, Clean Support and Resistance Map
JPYUSD (Japanese Yen / U.S. Dollar) on the 1H chart is still operating in a bearish environment: repeated bearish BOS prints, price trading below a downward EMA stack, and a fresh impulsive drop into a clearly marked weak low area. This is the type of location where the market often pauses first (liquidity grab), then prints a corrective rebound into Fibonacci + EMA resistance before choosing the next continuation leg.
Today’s edge comes from separating two phases:
A likely corrective bounce from the weak low
The higher-probability sell opportunity at the Fibonacci retracement and EMA confluence
1H Market Structure: Bearish Control, Now Testing a Weak Low
The sequence into the right side of the chart shows consistent lower highs and lower lows with bearish BOS labels.
Price just expanded down aggressively into the weak low area around 0.006338, which is a typical liquidity target.
In this context, a bounce is common, but a bounce does not equal reversal unless structure flips (bullish CHoCH + acceptance above key resistance).
Bias:
Bearish overall, with a short-term corrective rebound risk from current lows.
EMA Context: Dynamic Resistance Above Price
The EMA cluster is stacked above price and sloping down, which usually means:
Rallies into the EMA band tend to be sold.
Trend change requires a strong 1H close back above the EMA cluster, followed by a hold on retest.
This aligns perfectly with a “sell-the-rally” framework.
Fibonacci: The Rebound Levels Match Your Chart Levels Cleanly
Using the most recent downswing (from the last swing high before the drop to the current weak low), the main retracement band sits right on your visible level ladder:
Key Fibonacci retracement zone (from the current low region):
38.2%: ~0.006360
50%: ~0.006366
61.8%: ~0.006373
These levels align tightly with your marked prices:
0.006357 (near the first bounce trigger)
0.006368 (mid retracement pivot)
0.006375 (deeper retracement / EMA confluence)
0.006381 (upper resistance pocket)
This cluster is the primary decision area for today.
Key Support and Resistance Levels (From the Screenshot)
Support
0.006338: weak low / current base (first liquidity pool)
0.006329–0.006330: next support pocket if the weak low fails (based on the visible scale extension)
Resistance
0.006357: first rebound checkpoint
0.006368: mid-level pivot (often acts like a magnet during pullbacks)
0.006375–0.006381: EMA + Fibonacci confluence (premium sell zone)
0.006400: higher resistance / strong high reference above (major ceiling if reversal builds)
RSI Guide (How to Use It Today)
Even without the RSI panel displayed, the price action suggests momentum likely pushed into oversold during the sharp drop. Use RSI as a filter:
Long bounce is cleaner if RSI reclaims 30 and pushes toward 50 during the rebound.
Shorts are higher quality if RSI fails below 50 while price taps the Fibonacci/EMA zone (0.006368–0.006381).
In bearish structure, RSI failing at 50 is often the “green light” for continuation shorts.
Trading Plans for Today (Practical, Level-Based)
Plan A: Tactical Bounce From the Weak Low (Short-Term Only)
This is a corrective move, not a trend reversal.
Entry idea:
Buy only after confirmation (1H/15m rejection wick + bullish close) holding above 0.006338.
Targets:
TP1: 0.006357
TP2: 0.006368
TP3: 0.006375 (only if rebound is strong)
Invalidation:
A clean 1H close below 0.006338 (signals weak low failure and continuation risk)
Best use:
Quick execution, partial profits early, do not overstay.
Plan B: Sell the Retracement Rally (Higher-Probability Setup)
This is the main plan aligned with the trend.
Sell zones:
0.006368–0.006373 (mid retracement)
0.006375–0.006381 (premium zone: EMA + 61.8% + level confluence)
Confirmation triggers:
Bearish rejection candle from the zone on 15m/1H
Lower-high formation under 0.006381
RSI fails to reclaim 50 during the pullback
Targets:
TP1: 0.006357
TP2: 0.006338 (retest weak low)
Extension: 0.006330 area if breakdown confirms
Invalidation:
1H acceptance above 0.006381 and hold on retest
Plan C: Reversal Scenario (Only With Structure Flip)
If you want a true reversal trade, require proof:
Bullish CHoCH + 1H close above 0.006381
Retest holds 0.006375–0.006381 as support
Targets:
0.006390 then 0.006400
Failure sign:
Break above 0.006381 that immediately gets rejected back below (bull trap behavior)
Summary
Structure is bearish, but the market is sitting at a weak low where a corrective bounce is likely.
The best “decision zone” for today is 0.006368–0.006381 (Fibonacci + EMA resistance).
Treat rallies into that zone as sell opportunities unless price proves a real reversal with acceptance above resistance.

USDJPY (JPYUSD) Forecast TodayUSDJPY (JPYUSD) Forecast Today – H1 Range Structure, Liquidity Targeting in Focus
Market Overview
USDJPY (JPYUSD chart format) is currently trading in a neutral-to-corrective structure on the H1 timeframe after completing a strong bearish leg followed by a technical rebound. Price is now consolidating below a major supply zone, while holding above a recently defended demand area.
This market condition favors range trading and liquidity-based setups, rather than aggressive trend-following positions.
Market Structure & Price Action Analysis
The prior bearish sequence printed multiple BOS (Break of Structure) signals, confirming downside dominance earlier.
Recent CHoCH (Change of Character) near the lows indicates bearish momentum has weakened.
Price is now forming compressed candles and equal highs/lows, suggesting accumulation before the next directional move.
Current behavior reflects a mid-range equilibrium, where liquidity above and below becomes the primary target.
EMA Structure Analysis (20 / 50 / 100 / 200)
Price is currently interacting with the EMA 20 and EMA 50, showing short-term indecision.
EMA 100 and EMA 200 remain above price, acting as dynamic resistance.
EMA compression confirms low momentum and balance, often preceding expansion.
Bias remains neutral until price clearly escapes the EMA cluster with volume.
Key Liquidity Zones & Levels
Resistance / Supply Zones
0.006410 – 0.006430: Strong high liquidity zone and higher-timeframe supply
This area is likely to attract sell-side reaction if reached
Support / Demand Zones
0.006355 – 0.006345: Weak low liquidity pool
Sweep of this zone may trigger short-term bullish reaction
Intraday Trading Scenarios
Scenario 1: Buy from Demand (Liquidity Sweep Play)
Buy Zone: 0.006355 – 0.006345
Stop Loss: Below 0.006335
Targets:
TP1: 0.006385
TP2: 0.006410
TP3: 0.006425
Scenario 2: Sell from Supply (Preferred if Tapped)
Sell Zone: 0.006410 – 0.006430
Stop Loss: Above 0.006440
Targets:
TP1: 0.006385
TP2: 0.006360
Market Bias for Today
Intraday Bias: Neutral / Range-bound
Bullish case valid only after a confirmed H1 close above 0.006430
Bearish continuation favored if price rejects supply with bearish structure confirmation
Conclusion
USDJPY is currently trading in a liquidity-driven range, defined by clear weak lows and strong highs. The presence of EMA compression, CHoCH signals, and equal-level formations suggests the next move will likely be driven by a liquidity sweep rather than trend continuation.

Selena | USDJPY–Japenese Yen |Demand Hold After CHoCH |BUY SETUPFX:USDJPY
After breaking the previous internal bearish structure (CHoCH), price continued higher and formed higher highs and higher lows inside an ascending channel. A liquidity sweep below the channel followed by strong rejection suggests smart money accumulation. Price is now reacting from demand, favoring continuation toward upside liquidity and previous highs.
Key Scenarios
✅ Bullish Case 🚀
As long as price holds above the marked demand zone and channel support, continuation toward upper channel resistance and external liquidity remains the primary bias.
🎯 Target 1: Channel high
🎯 Target 2: Previous high / buy-side liquidity
🎯 Target 3: Trendline extension
❌ Bearish Case 📉
A clean breakdown and close below the demand zone and channel support would invalidate the bullish continuation and expose price to deeper retracement.
Current Levels to Watch
Resistance 🔴: 157.20 – 157.70
Support 🟢: Demand zone + channel base
⚠️ Disclaimer: This analysis is for educational purposes only. It is not financial advice.

JP225 Bullish Continuation Confirmed | Nikkei 225 Swing🇯🇵 JP225 / NIKKEI 225: The "Thief OG" Swing Blueprint
Title: NIKKEI 225 Bullish Moon Mission 🚀 | The Thief Layering Strategy 🕵️♂️
📊 Market Intel
The Nikkei 225 has exploded on the first trading day of 2026, surging nearly 3% to close at 51,832. We are seeing a massive "Risk-On" rotation. The technical structure is a textbook breakout—institutions are loading up, and it's time for the Thief OGs to secure their spot before the next leg up! 📈🔥
🏹 The Execution Plan: Bullish Swing
We don’t chase green candles. We use the Thief Strategy (layering) to "steal" entries during intraday volatility.
Entry Strategy (The Thief Layering): Spread your buy limit orders across these levels to get the best average price.
Layer 1: 51,000 (Immediate liquidity grab)
Layer 2: 50,500 (Major support retest)
Layer 3: 50,000 (The psychological "Thief" floor)
Note: Feel free to adjust your layers based on your own capital! 💸
Stop Loss (The Thief SL): 49,500 🛑
OG Note: This is my line in the sand. I am not recommending you only use my SL. It's your account—if you like making money, protect it at your own risk. 🛡️
Final Target (The Great Escape): 55,000 🏁
Why? The "Police Force" (Institutional Resistance) is waiting at the 55k overbought zone. There is a massive liquidity trap there, so we plan to escape with our bags full before the reversal! 🚔🏃♂️
⛓️ Global Correlations & Pairs to Watch
To trade the Nikkei like a pro, you must watch these correlated assets:
FX:USDJPY (The Engine): Trading in the 156.50 – 157.20 range. A stronger Dollar usually helps Japanese exporters, providing a tailwind for the JP225. 💴💹
CAPITALCOM:US30 / FOREXCOM:SPX500 : Wall Street's momentum is currently leading the global trend. If the US markets stay bullish, the Nikkei will follow. 🇺🇸🤝🇯🇵
TVC:JP10Y (Yields): The Japanese 10-year yield has hit a multi-decade high of 2.13%. Watch this closely; if yields spike too fast, the "Police" might step in with Bank of Japan intervention! 🏛️⚡
🌍 Fundamental & Economic Catalysts
The "Takaichi Trade": Prime Minister Takaichi has just approved a record ¥122.3 trillion budget. This massive fiscal stimulus is pumping the markets with optimism for 2026. 🏦💎
Bank of Japan (BoJ): Governor Ueda has held interest rates at 0.75%, the highest in 30 years. The market has priced this in, and investors are now focused on the "virtuous cycle" of rising wages and corporate growth. ✅
Semiconductor Surge: Major players like Tokyo Electron and Advantest are leading the rally today. As long as the global AI boom continues, the Nikkei remains the place to be! 🤖💻
⚠️ FINAL NOTE
Dear Ladies & Gentlemen (Thief OG’s),
I do not recommend copying stops or targets blindly.
Trade with your own plan, manage your risk, protect your capital, and take profits like a professional.
📌 Discipline > Emotion | Risk First, Profit Follows
🔥 If this setup adds value, hit LIKE ❤️, SAVE 📌, and SHARE
Let’s trade smart and stay consistent 📈

JPYUSD 1H Trendline SetupJPYUSD 1H Trendline Setup: Sell the Retest or Wait for Breakout Confirmation | Fibonacci + EMA + RSI
JPYUSD remains in a clear 1H downtrend under a descending trendline. Price has recently bounced, but the structure still favors sell-the-rally until the market can reclaim and hold above the trendline with strength. Today’s plan is built around one decision point: trendline retest rejection vs. trendline breakout and hold.
1H Market Structure
Sequence is still lower highs and lower lows.
The descending trendline has capped multiple recovery attempts.
Current price is sitting near the mid-range, meaning both sides will be tested: first a pullback up, then a decision.
Bias for today:
Bearish while below the trendline and below the 0.00638–0.00639 resistance band
Neutral-to-bullish only if a breakout holds above 0.00639 and retests successfully
Key Resistance Levels (Sell Pressure Zones)
0.006379–0.006380: Trendline area + first rejection zone
0.006387–0.006390: Pivot supply and common reversal band
0.006395–0.006405: Fibonacci retracement cluster (deep pullback zone)
0.006410–0.006420: Major swing supply (trend changes only above this region)
Key Support Levels (Buy Response Zones)
0.006360–0.006354: First support pocket (intraday reaction zone)
0.006348: Next demand step
0.006336: Extension support (high importance)
0.006314–0.006290: Only in case of strong continuation (lower extension path)
Fibonacci Map (Swing High 0.006420 to Swing Low 0.006355)
Retracements (where sells often trigger in a downtrend):
61.8%: 0.0063798
50%: 0.0063875
38.2%: 0.0063952
23.6%: 0.0064047
Downside extensions (targets if the downtrend continues):
1.272: 0.0063373
1.618: 0.0063148
2.0: 0.0062900
This creates a clean roadmap: sell pullbacks into 0.006379–0.006405, target 0.006360 → 0.006348 → 0.006336.
EMA Filter (Trend Confirmation)
Use EMA50 and EMA200 on 1H:
Bearish continuation is favored when price stays below EMA50, and EMA50 is below EMA200.
If price reclaims EMA50 and holds above it while breaking the trendline, expect a larger corrective push toward 0.006395–0.006405.
RSI Rules (Momentum Confirmation)
RSI(14) on 1H:
In a downtrend, RSI typically struggles below 50.
Best short setups occur when RSI approaches 50–55, then rolls over.
Bullish shift requires RSI holding above 50 on pullbacks after a trendline breakout.
Trading Strategies for Today
Setup A: Trendline Retest Short (Primary Plan)
Entry zone: 0.006379 to 0.006390 (trendline + fib 61.8%/50%)
Trigger: bearish rejection candle or failed retest (wick + close back below level)
Stop-loss: above 0.006395 (tight) or above 0.006405 (safer)
Targets: 0.006360 → 0.006348 → 0.006336
Why it works: you align with the dominant trend and use a clear invalidation level.
Setup B: Breakout Long (Only If Confirmed)
Condition: 1H close above the trendline, then a retest holds above 0.006387–0.006390
Entry: on successful retest confirmation
Stop-loss: back below 0.006379
Targets: 0.006395 → 0.006405 → 0.006410–0.006420
Rule: If price breaks out but immediately falls back under the trendline, treat it as a trap and return to Setup A.
Setup C: Continuation Sell on Support Break
Condition: breakdown and close below 0.006354
Entry: retest failure back under 0.006354–0.006360
Stop-loss: above the retest high
Targets: 0.006348 → 0.006336 → 0.006314
Invalidation Levels
Bears lose intraday control if price can break and hold above 0.006405, then build higher lows.
A stronger trend shift only confirms above 0.006410–0.006420 (major supply reclaimed).
Summary
JPYUSD is still structurally bearish on 1H. The highest-probability approach is to sell the trendline retest into the Fibonacci cluster, targeting the extension support levels. If the market instead breaks and holds above the trendline, switch to a confirmed breakout plan only after a clean retest.

USDJPY Weekly PlanIn my view, this currency pair is currently showing the most technical price action, so I will shift my focus to it.
I really like how the 1D and 4H charts are shaping up for continuation of the bullish 1D order flow, with price respecting the bullish 1W OB.
I expect upside continuation toward the nearest 1W FP and will look for opportunities to join this move.

USDJPY H1 AnalysisUSDJPY H1 Analysis – Range High Distribution and Potential Bearish Rotation
USDJPY is currently trading near the upper boundary of a well-defined H1 range, where price has repeatedly failed to achieve sustained bullish continuation. The current structure suggests distribution at range highs, with downside liquidity becoming increasingly attractive.
Market Structure & Price Action
On the H1 timeframe, USDJPY previously printed a strong bullish impulse, followed by range consolidation. Price is now compressing below a clear resistance zone, with multiple failed breakout attempts and overlapping candles.
This behavior typically signals buyer absorption and weakening upside momentum, rather than healthy trend continuation. The lack of impulsive follow-through above resistance suggests smart money is likely positioning for a corrective move.
Key Support & Resistance Levels
Major Resistance: 0.006425 – 0.006440
Range high and supply zone where price has consistently been rejected.
Intraday Resistance: 0.006415 – 0.006420
Short-term reaction zone inside the range.
Immediate Support: 0.006395 – 0.006400
First downside liquidity pocket.
Key Support / Target: 0.006375 – 0.006385
Range low and higher-probability draw on liquidity.
Fibonacci & Technical Confluence
The current price action sits within the premium zone (above 61.8%) of the previous bullish leg, a typical area for profit-taking and short positioning.
EMA structure is flattening, indicating loss of trend strength, while RSI remains capped without bullish expansion, reinforcing the idea that upside momentum is limited.
Trading Scenarios
Scenario 1 – Bearish Rotation from Range High (Preferred)
Look for rejection or bearish confirmation near 0.006420 – 0.006440
Targets:
0.006400
0.006385
Extension toward range low if momentum increases
Scenario 2 – Bullish Break and Hold
A clean break and sustained hold above 0.006440
Would invalidate the bearish bias and open upside continuation
Conclusion
USDJPY is currently trading at a high-risk premium zone near range resistance, with price action favoring a mean-reversion move back into balance. Until a clear breakout occurs, the intraday bias remains cautiously bearish, with downside liquidity as the primary magnet.
If this analysis aligns with your view, consider saving it for reference and following to stay updated with structured intraday market insights.

🇯🇵 The Japanese Yen: High-Conviction $JPYUSD 🇯🇵 The Japanese Yen: A High-Conviction Asymmetric Macro Opportunity FX_IDC:JPYUSD
Executive Summary
The Japanese Yen (JPY) is one of the most mispriced assets in global markets today. Trading near multi-decade lows, the Yen reflects decades of ultra-easy monetary policy that are now structurally changing. As global interest-rate differentials compress, short positioning unwinds, and Japan exits financial repression, the Yen offers asymmetric upside with defensive portfolio characteristics.
Core Thesis:
The Yen does not require aggressive tightening or economic perfection—only normalization—to generate meaningful appreciation.

JPYUSD H1 Analysis TodayJPYUSD H1 Analysis Today – Bullish Base Above 0.00641, Breakout Path Toward 0.00644–0.00647
JPYUSD on the 1H chart is transitioning from a sharp reversal low into a controlled consolidation. After the strong rebound, price is now building a tight range (the highlighted box) around 0.00641–0.00642, which often acts as an accumulation zone before the next expansion leg.
The bias stays bullish as long as price holds this range base and continues printing higher lows. The clean opportunity today is either buying pullbacks into the demand box, or trading the breakout with confirmation into the overhead supply zones.
H1 Market Structure and Trendline Read
A clear V-shape recovery from the swing low, followed by a range under resistance.
Consolidation is happening above prior micro support, suggesting buyers are defending dips.
This is a typical “pause before continuation” structure: range → liquidity sweep → expansion.
Directional bias: Bullish continuation while price holds above the demand box floor.
Key Support and Resistance Levels (Most Important Today)
Support (buy zones)
0.00641–0.00640: Primary demand / range base (best dip-buy area)
0.006385: Secondary support (breakdown retest zone)
0.00635–0.00634: Major swing low base (trend invalidation territory)
Resistance (profit zones and breakout triggers)
0.00643–0.00644: First supply layer (nearest overhead resistance)
0.00647–0.00648: Major supply zone (top band on chart)
Above 0.00648: Upside continuation window opens (trend extension)
Fibonacci Confluence (Where the Market Likely Reloads)
Use Fibonacci from the swing low (around 0.00634) to the recent swing high (around 0.00643):
The 0.382–0.50 retracement region typically overlaps the current consolidation base.
That makes the 0.00641–0.00640 demand box a high-probability reload zone, especially if price dips and immediately gets bought back into the range.
EMA and RSI Filters (For Cleaner Entries)
EMA (trend filter)
Bullish continuation is favored when price holds above the rising H1 EMA cluster (commonly 20/50).
High-quality longs often occur when price taps into EMA support and prints fast reclaim candles back above the range midpoint.
RSI (momentum filter)
Continuation bias stays strong if RSI holds above 45–50 during pullbacks.
If RSI breaks below 40 and stays weak while price loses 0.00640, expect deeper retracement into 0.006385 or lower.
Trade Setups for Today (H1 Execution)
Setup A – Buy the Pullback at the Range Base (Highest Probability)
Entry idea:
Wait for price to dip into 0.00641–0.00640
Trigger on bullish rejection (pin bar, bullish engulfing) or a reclaim of the range midpoint after a sweep
Invalidation:
H1 close below 0.00640 with follow-through
Targets:
TP1: 0.00643–0.00644
TP2: 0.00647–0.00648
TP3: extension above 0.00648 if breakout momentum is strong
Setup B – Breakout Long Above 0.00644 (Momentum Continuation)
Entry idea:
H1 close above 0.00644
Prefer the retest of 0.00643–0.00644 holding as support
Stops:
Below the retest low / back inside the range
Targets:
0.00647–0.00648 first
Extension above 0.00648 if volume and candle body expansion appear
Setup C – Breakdown Scenario (Only If Demand Fails)
If price breaks below 0.00640 and retests it as resistance:
Short on the retest with confirmation
Targets:
0.006385
Then 0.00635–0.00634 if selling pressure accelerates
Invalidation:
Strong reclaim back above 0.00640 with RSI recovery

Elite | USDJPY | 1H – Liquidity Grab & Range Rejection SetupFX:USDJPY
After consolidating near the lower range, price aggressively expanded upward, taking out sell-side liquidity and tapping into a premium resistance zone. Such moves often attract profit-taking and corrective pullbacks, especially when the impulsive leg reaches prior distribution levels.
Key Scenarios
❌ Bearish Case 📉
Rejection from the current resistance zone could trigger a corrective move back toward the prior demand base.
🎯 Target 1: 155.80
🎯 Target 2: 155.40
✅ Bullish Case 🚀
A clean acceptance and strong close above 157.80 invalidates the bearish pullback and opens continuation toward higher highs.
🎯 Upside Target: 158.40+
Current Levels to Watch
Resistance 🔴: 157.70 – 158.40
Support 🟢: 155.80 – 155.40
⚠️ Disclaimer: This analysis is for educational purposes only. It is not financial advice.

Selena | USDJPY 1H–Bullish Reversal Setup Toward 157.800 TargetFX:USDJPY
After an aggressive sell-off into 154.80–155.00 demand, USDJPY produced a strong impulsive recovery, reclaiming broken structure. Price is now compressing under the descending trendline and retesting the 155.50–155.70 entry zone, forming a potential higher-low setup. Bias remains bullish above this zone, aiming for a structural reversal toward major resistance.
Key Scenarios
✅ Bullish Case 🚀
Entry around 155.40–155.70 retest zone
Break & close above the descending trendline → continuation wave
🎯 Target 1: 156.96 (major resistance)
🎯 Final Target: 157.80–158.00 liquidity zone
❌ Bearish Case 📉
Only valid if price breaks below 155.20
Downside continuation into 154.80 demand zone
Below 154.70, structure turns fully bearish again
Current Levels to Watch
Resistance 🔴: 156.00 / 156.95
Support 🟢: 155.40 / 155.20 / 154.80
⚠️ Disclaimer: This analysis is for educational purposes only. Not financial advice.

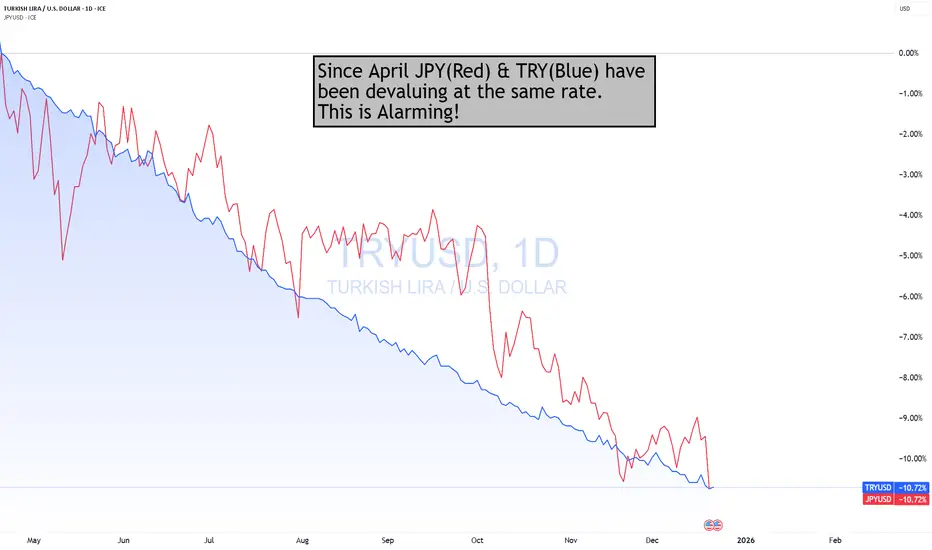
JPY Devaluing At The Same Rate As TRY Against $Since April, the JPY has been falling at the same rate as the TRY against the $. This is Alarming, should the trend continue.
This makes this even more interesting, is that the DXY since Trump took office, has dropped almost by the same amount!
What is important to also understand is that the JPY is 145 of the DXY. As such, if the JPY were to strengthen (all else being equal) the DXY would be down even more!
How would that help the "AFFORDABILITY HOAX" if the $ keeps devaluing, requiring more $s to buy the same amount of goods & services?
Now, does it make a bit more sense why Gold & Silver have soared this year?
I hate to keep harping on JPY, but it is important to all traders/investors in all asset classes, not just FX.
THANK YOU for getting me to 5,000 followers! 🙏🔥
Let’s keep climbing.
If you enjoy the work:
👉 Boost
👉 Follow
👉 Drop a solid comment
Let’s push it to 6,000 and keep building a community grounded in truth, not hype.
Selena | USDJPY | 2H – Institutional Demand Reaction ZoneFX:USDJPY
After multiple rejections from the HTF supply zone, price declined in a controlled manner and reached institutional demand. The current consolidation near the demand zone suggests absorption of selling pressure rather than aggressive continuation. Structure is compressing, indicating a potential liquidity-driven expansion once price resolves from this range.
Key Scenarios
✅ Bullish Case 🚀
If price holds above the institutional demand and reclaims channel midline:
🎯 Target 1: 155.20
🎯 Target 2: 156.00
🎯 Target 3: 156.60 (channel resistance)
❌ Bearish Case 📉
If price breaks and closes below structural support:
🎯 Downside Target 1: 153.80
🎯 Downside Target 2: 153.20 (HTF demand sweep)
Current Levels to Watch
Resistance 🔴: 156.00 – 156.60
Support 🟢: 154.20 – 153.80
⚠️ Disclaimer: This analysis is for educational purposes only. Not financial advice.

Bank of Japan Policy Decision: Global Market Impact AnalysisBank of Japan Interest Rate Decision (December 19)
Introduction : Why Japan’s Interest Rate Policy Matters
Japan’s monetary policy plays a critical role in the global financial system. For decades, the Bank of Japan (BoJ) maintained ultra-loose conditions, turning the Japanese yen into the world’s primary funding currency. Global investors borrow cheaply in JPY and deploy capital into higher-yielding assets such as equities, bonds, and cryptocurrencies.
Because of this structure, even a small shift in BoJ policy can trigger large cross-market reactions. The BoJ’s interest rate decision on December 19 is therefore a high-impact macro event with potential consequences for forex, global equities, bonds, gold, and crypto markets.
Scenario 1: If the Bank of Japan Raises Interest Rates
A rate hike would represent a historic policy shift and signal the early stages of monetary normalization.
Impact on Forex (USD/JPY & JPY Pairs)
* The Japanese yen (JPY) is likely to strengthen due to improved yield appeal
* USD/JPY may face strong bearish pressure
* Carry trades funded in JPY could unwind rapidly, increasing volatility
JPY crosses such as EUR/JPY, GBP/JPY, and AUD/JPY may also decline as risk exposure is reduced.
Impact on Global Equity Markets
* Japanese equities: Mixed to bearish bias due to a stronger yen hurting exporters
* Asian markets: Short-term weakness as financial conditions tighten
* US & European equities: Increased volatility and pressure on growth stocks
Overall, a rate hike may trigger a short-term global risk-off reaction driven by liquidity repricing rather than economic deterioration.
Impact on Crypto Markets (Bitcoin & Altcoins)
* Bitcoin: Short-term bearish pressure and higher volatility
* Altcoins: Likely underperformance due to higher risk sensitivity
* Macro-driven selling could create longer-term accumulation zones once volatility settles
Impact on Bonds, Gold & Risk Sentiment
* Bonds: Japanese and global yields may rise
* Gold: Short-term pressure from higher yields, medium-term support if risk aversion increases
* Risk sentiment: Shift toward defensive positioning and reduced leverage
Scenario 2: If the Bank of Japan Does NOT Raise Interest Rates
If rates remain unchanged, markets may view the decision as continued policy caution.
Expected Market Reactions
* JPY: Continued weakness
* USD/JPY: Bullish continuation
* Global equities & crypto: Supported by ongoing liquidity
* Risk sentiment: Risk-on behaviour likely to persist
Short-Term vs Medium-Term Outlook
Short-Term
* Rate hike: Sharp volatility, risk-off moves
* No hike: Relief rally in risk assets
Medium-Term
* Gradual tightening allows controlled market adjustment
* Continued loose policy supports assets but increases structural risks over time
Markets typically shift from news reaction to trend confirmation within weeks.
Educational Entry–Exit Examples (Not Financial Advice)
USD/JPY (Rate Hike):
* Bias: Bearish
* Concept: Breakdown → pullback → continuation
* Invalidation: Above recent swing high
Bitcoin (No Hike):
* Bias: Bullish
* Concept: Pullback after impulse
* Risk Note: Reduced size during news volatility
US Indices:
* Rate hike: Sell rallies near resistance
* No hike: Buy dips in confirmed trend
Conclusion: Key Takeaways for Traders
The Bank of Japan’s December 19 interest rate decision is a major global liquidity event. A rate hike would favour the yen while pressuring risk assets, whereas a no-change policy would support equities, cryptocurrencies, and carry trades. Traders should prioritise volatility management, confirmation from price action, and cross-market correlations over predictions and forecasts.
Stay tuned!
@Money_Dictators
Thank you :)

USDJPY Weekly OutlookUSDJPY Weekly Outlook: Preparing for the Next Impulse Wave?
Looking at the Weekly (1W) timeframe for USDJPY, the primary trend remains bullish. The market is currently undergoing a necessary correction phase after a strong impulse, which provides an opportunity to join the trend at a discounted price.
Key Technical Factors:
Market Structure: The pair continues to print clear Higher Highs (HH) and Higher Lows (HL). As long as the previous major structural lows hold, the long-term bias remains upward.
Fibonacci Retracement: I am monitoring the "Golden Zone" for a potential reversal and continuation of the uptrend.
0.618 Level: ~148.56
0.705 Level: ~146.69 This zone often acts as a strong area of interest for trend-following traders.
Dynamic Support: The price is approaching the long-term Moving Average (orange line), which aligns with our Fibonacci support zone. This confluence adds extra weight to the setup.
Trade Plan:
Watch Zone: 146.70 - 148.60 area.
Strategy: Waiting for price to stabilize within this zone and form a bullish confirmation on lower timeframes (H4/D1) before considering long entries.
Invalidation (Stop Loss Idea): A weekly close below the 144.80 level (below the 0.786 Fib) would invalidate this specific setup and suggest a deeper correction or trend change.
Disclaimer: This analysis is for educational purposes only and does not constitute financial advice. Always manage your risk.
ICMARKETS:USDJPY IBKR:USDJPY CAPITALCOM:USDJPY
OANDA:USDJPY FX:USDJPY FOREXCOM:USDJPY SAXO:USDJPY

JPYUSD - Re-Accumulation Under SupplyJPYUSD Re-Accumulation Under Supply, 0.006455 Is the Breakout Gate
JPYUSD is rebuilding bullish momentum after a rounded base (cup-like recovery). Price is now pressing into a major supply/resistance band (the green zone) around 0.006455–0.006460. This area has already rejected price before, so today’s plan is simple: either buy the breakout and retest, or buy the pullback into support before the next push.
Market Structure Read (H1)
Two clear rounded recoveries suggest demand is stepping in progressively (accumulation behavior).
Price has recently surged toward the same supply zone again, which typically triggers:
a short consolidation under resistance, then breakout, or
a pullback to grab liquidity, then continuation.
The black projection on your chart aligns with this logic: minor chop → dip → strong push through the ceiling.
Key Levels to Watch
Resistance (Sell pressure / breakout trigger)
0.006455 – 0.006460: main supply zone (decision level)
0.006480: next upside objective if breakout holds (extension target)
Support (Buy defense / pullback zones)
0.006435 – 0.006434: first support (near-term pullback shelf)
0.006428 – 0.006423: deeper support pocket (high-probability demand)
0.006405 – 0.006400: structural base (if price returns here, the move is resetting)
Fibonacci Map (Practical Pullback Levels)
If you anchor Fib from the recent swing low ~0.006405 to swing high ~0.006452:
38.2%: ~0.006434
50%: ~0.006428
61.8%: ~0.006423
This creates a clean “buy-the-dip” cluster at 0.006434 → 0.006423, which matches the pullback path drawn on your chart.
EMA + RSI Filters (Confirmation)
EMA
Bullish continuation is favored when price holds above EMA20 and EMA20 stays above EMA50.
If price repeatedly rejects EMA20 during pullbacks, the market is likely rotating deeper toward the 0.5–0.618 Fib zone.
RSI
Bullish bias strengthens when RSI holds above 50 during consolidation.
If price retests 0.006455–0.006460 but RSI fails to make a new high, watch for bearish divergence (possible rejection setup).
Trading Plans for Today
Plan A: Breakout Buy (Momentum Setup)
Trigger:
H1 close above 0.006460, then a retest that holds above the zone.
Entry idea:
Buy the retest of 0.006455–0.006460 after confirmation.
Invalidation (SL):
Below 0.006448–0.006445 (or below the retest low).
Targets (TP):
TP1: 0.006480
TP2: trail toward higher extension if momentum remains strong
Plan B: Pullback Buy (Higher Probability)
Trigger:
Price rejects the zone and pulls back into Fib support.
Entry zones:
0.006434
0.006428
0.006423
Invalidation (SL):
Below 0.006405–0.006400 if you are trading swing continuation.
Targets (TP):
TP1: 0.006455–0.006460
TP2: 0.006480
Plan C: Rejection Sell (Only if Supply Holds Strong)
Trigger:
Clear rejection at 0.006455–0.006460 (long upper wick / bearish engulfing), plus failure to reclaim the zone.
Targets (TP):
0.006434, then 0.006428–0.006423
Invalidation (SL):
H1 acceptance above 0.006460
Execution Notes
Avoid entries in the middle of the range. Let price come to 0.006455–0.006460 (decision) or 0.006434–0.006423 (discount).
The cleanest bullish confirmation is a breakout that closes and holds above the supply zone.

USDJPY is forming an M pattern with strong bearish momentum.
After the impulsive move to the downside, price may retrace toward the 50% Fibonacci level, where there is a clear imbalance zone. From that area, a continuation to the downside is expected.
However, since we have high-impact Forex news later today, it is best to remain patient and wait for confirmation. As long as the price does not break above 157, the bearish scenario remains valid.
This setup offers a solid sell swing opportunity if the rejection is confirmed.

Price Is Sitting on a High-Probability Demand Zone 📌 MARKET OUTLOOK
USDJPY continues to move inside a well-defined descending channel, forming a clean sequence of Lower Highs and Lower Lows.
Right now, price has tapped the Demand Zone at the bottom of the channel — a level that has consistently acted as a reaction point. After rejecting this zone, the market created a small pullback, forming a clearer Entry Zone for a potential bullish correction.
The structure shows a classic pattern:
➡️ Bounce from Demand → Pullback → Higher Low → Long Setup
This gives us a high-probability opportunity to follow the upcoming corrective leg of the channel.
🎯 TRADE SETUP (Entry – SL – TP)
✅ ENTRY ZONE
155.10 – 155.25
(Aligned with the pullback and the retest highlighted in the chart.)
❌ STOP LOSS (SL ZONE)
154.70 – 154.85
(Placed safely below the Demand Zone and channel support to avoid noise.)
🥇 TAKE PROFIT 1 (TP1)
155.90 – 156.10
(Targeting the upper boundary of the channel.)
🥈 TAKE PROFIT 2 (TP2 – Extended Move)
156.60 – 157.00
(If price breaks market structure and shifts momentum upward.)

JPY/USD – Bullish Momentum StrengthensJPY/USD – Bullish Momentum Strengthens as Price Breaks Short-Term Structure
JPY/USD continues to build upward momentum on the H1 timeframe after reclaiming the short-term structure and breaking above minor resistance areas. The market has respected multiple demand zones below, forming a sequence of higher lows that signals a potential continuation toward higher levels.
The bullish drive is also supported by the 9-period DEMA, which is turning upward and aligning closely with price, showing that buyers remain in control in the short term.
1. Technical Outlook – Buyers Regain Control
Recent price action shows:
A clean break above short-term consolidation.
Higher lows forming above key demand levels.
DEMA (9) sloping upward, confirming bullish pressure.
Strong impulsive candles pushing through intraday liquidity.
This structure strongly favors a continuation toward previous swing highs on the right side of your chart.
2. Key Support and Resistance Zones
Demand Zones (Support)
These levels have acted as strong reactions and remain valid for pullback entries:
0.006380 – 0.006386
0.006365 – 0.006372
0.006348 – 0.006355
As long as price stays above these zones, buyers maintain advantage.
Immediate Resistance
0.006450 – 0.006460
This is the first target zone and potential reaction area.
A breakout above this region opens the path toward the next bullish expansion.
3. Trading Strategy for Today
Primary Scenario: Buy Continuation
The current setup shows a clean bullish continuation model.
Entry: On a minor pullback toward 0.006430 – 0.006435
Stop Loss: Below 0.006412 (structure invalidation)
Take Profit:
TP1: 0.006455
TP2: 0.006465 (extension target)
This aligns with the long-position zone drawn on your chart.
Alternative Scenario: Buy the Deeper Pullback
If price retraces deeper:
Entry: 0.006380 – 0.006386
SL: Below 0.006365
TP: 0.006450 – 0.006460
This setup uses demand zone confluence for a stronger risk-reward.
4. Summary
JPY/USD is showing a well-defined bullish structure supported by upward DEMA alignment and strong demand. As long as price remains above the highlighted demand levels, the market condition favors buying the pullbacks and targeting 0.006455 and beyond.

USDJPY Intraday AnalysisUSDJPY Intraday Analysis: Price Forms Bullish Reversal Structure and Targets Upper Resistance Zone
USDJPY is developing a constructive bullish pattern on the H1 timeframe as price continues to form higher lows above key demand zones. Market structure suggests a potential accumulation phase, with buyers gradually stepping in each time price retests intraday support. As long as price remains above the highlighted demand areas, the probability of a bullish continuation toward the upper resistance remains high.
This analysis focuses on structural behavior, EMA9 momentum, and clear support–resistance interaction.
Technical Outlook
1. Market Structure
USDJPY has completed multiple swing-low rejections around the 0.006375 – 0.006385 zone, forming a clean inverse V-shaped recovery pattern. Price is now stabilizing, moving inside a tightening range that hints at consolidation before a potential upside breakout.
The repeated higher lows indicate that buyers are defending the structure strongly.
2. EMA9 Behavior
The EMA9 is currently flattening, which is typical during accumulation phases. Once price closes above EMA9 with strong candles, bullish momentum is expected to return quickly. A breakout above the mid-range would further confirm buyer dominance.
3. Support and Resistance Zones
Support Levels
0.006375 – 0.006385 (intraday demand, key accumulation layer)
0.006355 – 0.006365 (major demand zone, deeper liquidity pocket)
Resistance Levels
0.006415 – 0.006425 (primary bullish target)
Break above this level opens the path for extended upside continuation.
Intraday Trade Scenarios
Scenario A: Bullish Continuation (High Probability)
If price maintains above the intraday demand:
Entry: 0.006385 – 0.006395
Targets: 0.006415, 0.006425
Stop-loss: Below 0.006370
This scenario aligns with the projected bullish pattern in the chart.
Scenario B: Deeper Pullback Before Lift-Off
If price dips into the lower demand zone:
Entry: 0.006360 – 0.006370
Targets: 0.006395, 0.006420
Stop-loss: Below 0.006350
This setup offers a better risk-reward for patient traders.
Bullish Invalidation
If price closes below 0.006350, the bullish accumulation structure breaks, signaling a shift into a deeper correction.
Conclusion
USDJPY is forming a clear bullish accumulation pattern, supported by firm higher lows and repeated reactions from key demand zones. As long as price remains above 0.006375, the market favors a move toward 0.006420. Traders should watch for a confirmed breakout above EMA9 and mid-range structure to validate bullish momentum.
If you want, I can rewrite this into a s

USDJPY – 30M | Break + Retest Setup Toward Liquidity TargetFX:USDJPY
Price is currently respecting a descending structure while building higher-lows along the trendline support. A successful break and hold above the 156.600–156.800 supply zone will confirm bullish continuation and shift structure.
If the breakout fails, price may retest the rising trendline (155.900–156.150) before pushing higher.
Key Scenarios
✅ Bullish Case (Primary Plan)
Break and hold above 156.800
→ 🎯 Target: 157.893 (Liquidity Sweep Zone)
📌 Alternative Entry:
Buy from retest zone 156.150–155.900 if structure remains intact.
❌ Invalidation
A full break below 155.500 invalidates bullish outlook.
Current Levels to Watch
Support Zones: 156.150 / 155.900 / 155.500
Resistance Zones: 156.800 / 157.300 / 157.893 Target
⚠️ This analysis is for educational purposes only — not financial advice.
