KEY signs of positive trend changeKEY enters a position to reverse its trend with high probability. This composition is made out of several signs. Such as EWO wave change and overall descendance of its wave, MACD divergence between signal lines and Ichimoku signal lines crossover and zone of indecision at the highlighted zone with volume spikes. Conformation of that trend change should soon reveal as well as market entry zone.
KEY

KEY entry point KEY gives a perfect position to enter the market. This is indicated by several things. EWO upcoming change, MACD point of convergence plus and it's wave descendance and RSI direction. Judging by EWO All of that allows me create buy setup below:
Buy price: 0.007000 - 0.007070
Target profit: 0.007430
Stop loss: 0.006750

KEY forming zone of indecisionKEY forms zone of indecision which is highlighted by volumes at the zone of interest. Also RSI hanging around mark 50 and support at 0.0065 creates a possibility for KEY to break out of that zone and continue it's price growth. MACD gives a strong look of reaching it's downward peak and EWO doesn't even touch point zero. There is a lot of momentum waiting to show itself in that area. The main resistance level at 0.0075 should be broken with that price jump from this zone of indecision.

KEY new support level KEY provides us with a good position to wait for. Support level, found at 0.0065, allows to expect a positive price movement. This is supported by things like MACD downward peak and signal lines converging, Ichimoku cloud layout and EWO soon to repeat of point 1 movement. Point to enter should reveal itself tomorrow with a clear signal to enter.

KEY H&S pattern and breakoutKEY chart forms H&S pattern and tends to break the neckline. There are several indications of that. EWO gives a clear picture of a positive trend, with it's signal line upward direction and overall positive wave pattern. MACD adds good distance between lines as well as positive wave trend. RSI creates a possibility to touch 85 after breakout. And the most important of all - H&S pattern forming. All of that allows to expect a good price growth next days. I've made buy setup below to use this data:
Buy price: 0.007150-0.007350
Take profit: 0.009020
Stop loss: 0.006400


KEYUSDT LONG idea - it is closing to the pivot point-after accumulation with the altcoin huge drop KEYUSDT is slowly recovering near to the 0.0085 downtrend line. When it brake above we can see some big candle till to the 0.018 area, which means at least 2x pump.

Selfkey vs Tether USD (KEY / USDT) __1Day chart Binancetrade your USD for KEY at/in-between these prices (green labels)

CHF/JPY - Rollercoaster Ride Last Week🎢We took advantage of the downside movement last week on this pair. Check out how 4HR levels have been violated. Another bearish week?
We have seen the JPY reverse last week after lockdown restrictions have eased for the majority of cities in Japan.
We are currently at a key long term level in price - a break of this level will mean further downside movement this week!

BTC confirmed forming a botttom - BTFDThe beauty of elliott waves is not only in their invaluable analytic tools but also in their trading methology. They tells us that previous W4 area acts as a support/resistance. When price action breaks this zone it often suggets that the trend has changed and reversal is more likely.
This indeed happended recently on BTCUSD. Price action exceeded the prevous W4 termination point (In this case it was the end of wave E of triangle). It was rejected from strong 42k resistance but since we got the confirmation any pullback can be perceived as BUY THE FKING DIP.
Momentum of the pullback is lowering which may indicate that reversal is near. We are also above POC and Daily MA21. This confluence provide us with a high-probability setup.
I do not want to see prices below 34k. If we drop below I will start considering alternatives count but for now this count is the most likely.
Keep monitoring the situation and adjust accordingly. Remember, price action knows the best. It is the current opinion of all market participants.


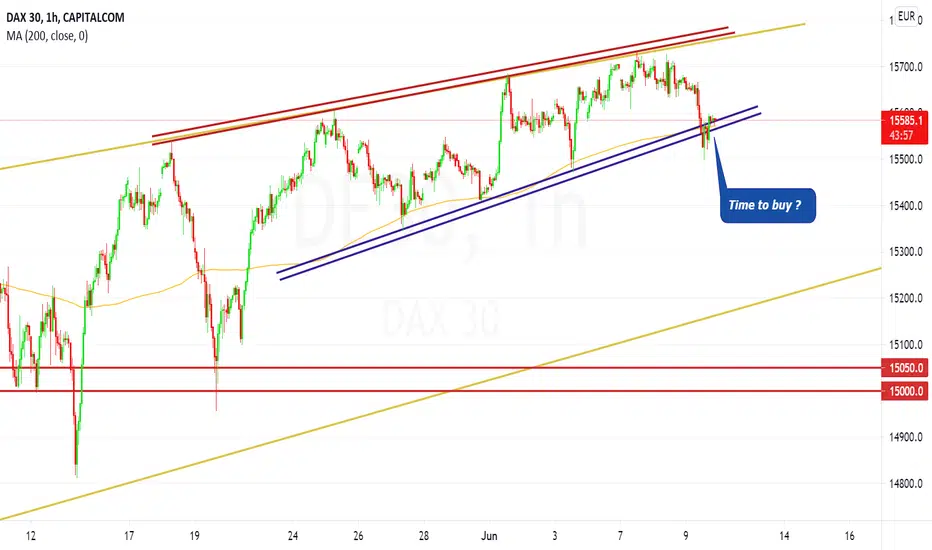
Time to buy the DAX ?This one rejected our support at 15000 forming something similar to an inverse head and shoulder and a double bottom so this one is overall bullish.
The price is now retesting the MA200 on H1 and the support.
Is it time to buy ? YOUR DECISION !


KEY🔑 - SELFKEY update - more short term targets mapped🚀As anticipated, KEY continues to absolute dominate the charts.
Months and months of consolidation at a relatively stable level acts like an elastic band in these situations - storing up buying power as accumulation goes on, until it finally *SNAPS*.
This much volume on this low of a market cap is always going to lead to crazy gains.
And fundamentally - everything is quite on point so far; no real deviation from plans. Combined with the obviously bullish technicals everything is pointing to this being a very profitable run from KEY.
More short term targets mapped but realistically we could see .3 area before too long with this much buy pressure.


