QQQ retests trendlineAs seen in both the RSI and price chart, the Nasdaq is retesting the resistance line it just crossed (last week’s support line. If it crosses back above it, the bulls still have control. I think this is possible because it the RSI is bouncing off of its second support line. If QQQ fails to cross the line, however, and instead hits the roof and falls, it will cement the top resistance line (last week’s support line) as a solid trend line. As such, expect it to fall and test the next horizontal support line. If this is the case, it will enter a very broad megaphone pattern, marked with equal lows and higher highs. This will come with high volatility in the QQQ. As of right now I’m neutral, but watch the the key price level of 280. A cross above it is bullish, a failed breakout is semi- bearish. Also worth mentioning, the QQQ is rallying on lower volume today, compared to the last few days, meaning a large rise in selling volume could easily erase the rally.
Keylevel

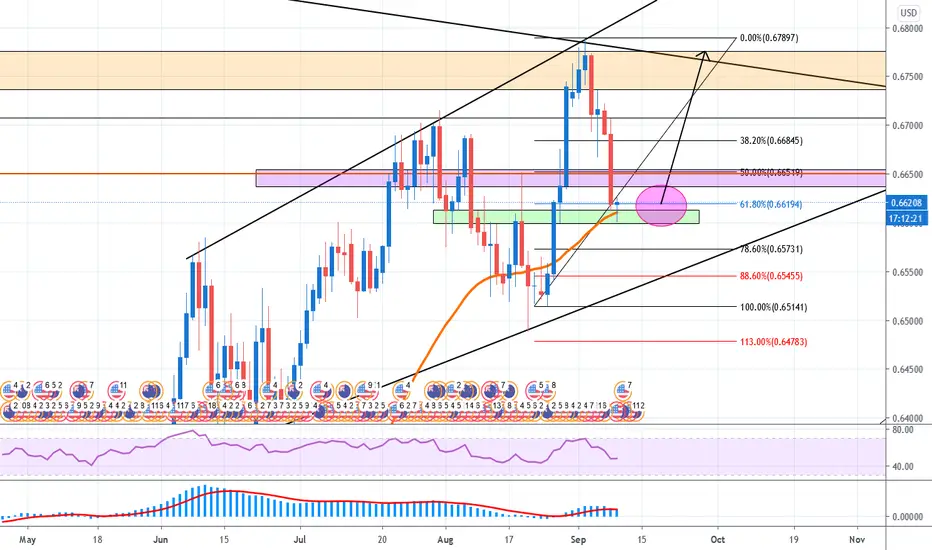
LONG NZD/USD.LONG NZD/USD, ***IF there is a clear rejection at the current area, wich is on the 61,80% level of the fibonacci and it is also on a key level. IMPORTANT : I am only showing an analysis on one of the many timeframes that I use.
LONG GBP/AUD.LONG GBP/AUD, ***IF there is a clear rejection at the current area, wich is on the 1,79500 weekly key level (psychological level) and it is also on the 61,80% level of the fibonacci taken on the monthly timeframe. IMPORTANT : I am only showing an analysis on one of the many timeframes that I use.

LONG GBP/NZD.LONG GBP/NZD, ***IF there is a clear rejection around the current level, wich is on a monthly key level and it is on the 50% level of the fibonacci. IMPORTANT : I am only showing an analysis on one of the many timeframes that I use.

SHORT EUR/GBP.SHORT EUR/GBP , ***IF there is a clear rejection at the current level, wich is on the 61,80% level of the fibonacci, it is on the 0,90000 weeekly key level (psychological level) and it is also on a trendline dated from May 13 2020. IMPORTANT : I am only showing an analysis on one of the many timeframes that I use.

GBPJPY Key LevelGJ is retesting a key level, if it fails to hold, it will most likely go bearish and break the trend line, if it holds its, going bullish to the next key level

GOLD Clean ViewGold looks still very weak to break 1912 key level, it has to find the right liquidity needed to break thru that level. Mulitiple wicks on 1912. Trendline has been touched one more time and probablly will hold. On daily TF, not a single body candle has engulfed previous wicks. Personally expecting gold to push up through at least two previous Lower Highs and prolly form a double top before finding the right momentum to break 1912 key level and the significant trendline to look for Higher Lows to be formed on larger Time Frames.

OIL STRUCTURE ANALYSIS| KEY LEVELS
USOIL BROKE THE CHANNEL AND IS NOW LOOKING TO TEST THE SUPPORT LEVELS. LONG AT EACH SUPPORT LEVEL.
0- Even the hurricane and the good jobs numbers did not help the price.Stronger dollar is pushing oil down.
1- Channel broken>>> downward push
2- We will see support levels tested
3- Long from each support, at least for pullback
4-IF price reaches support 3= strong buy! Swing long!
LIKE & SUBSCRIBE= GOOD VIBES FOR U!

SHORT GBP/AUD.SHORT GBP/AUD, ***IF, there is a clear rejection around the current level, wich is on a key level and on the 61,80% level of the fibonacci. The market reached this fibonacci level and seems to be rejecting it. IMPORTANT : I am only showing an analysis on one of the many timeframes that I use.

LONG EUR/GBP.LONG EUR/GBP, ***IF, there is a clear rejection around the current level, wich is on a key level. IMPORTANT : I am only showing an analysis on one of the many timeframes that I use.

EU AnalysisEu is now consolidating, waiting to see what happens at the very strong resistance line plotted at 1.20000. Could be the start of a reversal which I don't see fit, or price could break the 1.20000 line, retest, then keep rising. Let me know what you guys think!

AUDCAD - Potential Long OpportunityAUDCAD - Potential Long Opportunity
After last week's AUD strength we have broken through a significant level that price has been interacting with in the past. This bullish move that occurred will more than likely see a pullback, potentially when price creates the swing high you can also look to draw fibonacci from the impulse, to the peak of the move, as further confluence. You can see the ascending trend line is adding further confluence as it lines up with key market structure. Once price returns to the level the 50EMA should be closer to current market price, potentially acting as a dynamic level of support.
If price returns to the zone (key level + trendline), look for rejection in the form of a bullish candlestick pattern, reversal pattern, or if we see many rejection wicks at this zone. If we don't see rejection, or buyers coming into the market, there is no trade.
Important to react to price action and not predict.

MC-DONALDS KEY LEVEL| BREAKOUT| TRADING PLAN|
X MCD is trading in an upward channel
X Smaller channel is guiding the price now
X Faces key level resistance
X Wait for breakout>
X IF breakout higher>> long till red resistance
X IF breakout of the small upward channel downwards>> short till green support
X General trend still bullish till the big channel gets broken
LIKE + SUBSCRIBE= LUCK IN YOUR TRADES!


NZDCHF price at Key Levelwe are at key level if we flip and bounce than we will going hard in sky else big rejection
you can long after bounce from this zone at support level

Support Being TestedSupport Being Tested
Whilst the price of Bitcoin has not been doing much in the past two weeks, it now comes to an interesting level.
The medium-term trend on the higher time frame charts is higher with price in recent months making a strong move.
Price is now testing an important daily and 4 hour support level.
This level looks key if price is to continue the recent trend and make another new leg back higher.

URA atl reversal play
Trading on the D/W
On the weekly:
-major support has been $10-12 since early 2016
-in july 2019 price broke down from this range(covid market crash), and solidified 11.50 as major res
-has since broken above 11.50(also the 100w), the retest held, and carried higher
On the daily:
- jul 15 2019, price breaks above r11.50, and all MAs (50,100,200,400)
-MAs are converging on one another for strong support
Entry: 11.99 Market open 08/26/2020
Stop loss: 10.88---below all major res/ma on week/day
TP1: 14.20---sell 50%---URA tends to have short fakeouts above weekly MAs, 14.20 would be slightly above 200w ---move SL to BE or below relevent key levels
TP2:15.40--- sell the rest unless stock still has good techs--- 16 is a key res
TP3: moon, will move SL to appropriate levels as stock moves higher

Look for Short entry on AUDUSDWait for an rejection or wick in this area then wait for that rejection to close, then take the short position.

XAUUSD SELLHello Traders! As i told you look at my key levels to enter the trade. Our sell from 1950 worked perfectly and hit the 1920 target.
We traded 3 times successfuly in previous range. I was waiting for Good entry to enter in trade. You can see i have mentioned it failed 2 times and now it has successfully tested key level and broke the support.
Put your stop loss few pips above the key level.
Don't forget to hit the like button and follow to stay connected.

Bitcoin S/R zones / favorite patterns Hello Community and all crypto fans!
In this idea I wanna to show you my favorite price action patterns which I am using for my daytrading. Also in the chart you can see my key levels and support/resistance zones.
In comments bellow I will share also VWAP and Orderflow charts.
Hope you like it and feel free to ask me anything.

Market Trying to ReverseWe discussed this market last week and the important intraday resistance level we were hunting short trades.
After selling off twice at this level, price is now once again looking to make another test.
Looking at the longer-term charts the trend is clearly lower and this level looks key.
This market is now attempting to make a reversal back higher and a break of this resistance would be the first step to watch for.
Thanks for your like and support.

LONG GBP/AUD.LONG GBP/AUD, ***IF there is a clear rejection at the current area, wich is on the 61,80% level of the fibonacci, it is on a downtrend channel, on the 1,83000 key level (psychological level) and it is on a trendline. The market broke a downtrend channel and a key level and is now retesting both of these levels. IMPORTANT : I am only showing an analysis on one of the many timeframes that I use.

I love exotic holidaysand pairs and USD ZAR is one of them. Some big potential to make good pips with this pair.
Again 3rd touch confluence which I can teach you for free x
