Do you want to be a Millionaire ?Hi Guys,
This bull run has been very unusual with Bitcoin reaching record highs while the altcoins are watching from the sidelines, considering Gold,Stocks, and pretty much every other assets are
At ATH and the current AI bubble (ticking time bomb) I think all markets are due to crash very soon!
So I've been comparing current BTC chart with all types of other assets and I came to the conclusion that Nvidia 2000-2010 chart looks very similar to what we have in Bitcoin right now!
Is Bitcoin following Nvidia's (Dot Com) bubble crash ? Both charts looks extreamly similar
And Bitcoin has already broke below the weekly 50MA and the current chart pattern looks like a huge Head & shoulders are forming on the monthly period.
Even Michel Burry is shorting the AI bubble right now and the crypto community detected a suspiciouse activity on Microstrategy's Bitcoin wallets!
So I think this is it boys ..its the opportunity of the century to achieve financial freedom and
I refuse to live in denial and "HODL" like what most of us did in the previouse bear markets.
Feel free to leave a comment and let me know what you think about this idea !
Kraken

ICP Big Oppotunity Don't Miss Out!Hey Guys!
Wether you're an early investor of ICP or not, the current situation is different!
As you know ICP has been going on a downtrend since the day it has been launched and a lot of early investors lost their money betting on a real project like ICP thinking it will be the next $Eth.
But with Tragedy comes opportunity ! ICP's Price is about to touch down on the monthly lower Bollinger Bandat 0.6$ which is a historical event in my opinion and with it should come a big reaction by the devs or the investor's community.
I expect a big volume candle followed by a bullish news to breakout from the accumilation zone which will finally end the downtrend for ICP that lasted for years now.
Either way don't be greedy and keep in mind that ICP has an unlimited supply at this time (might change if the project community vote on it) but do the math and don't risk it.
I'm looking forward to hear your thoughts on this and feel free to leave a comment.

Litecoin Long-term Pump! Are you ready for this ?Hey Guys !
Are you ready for the LTC big pump ? It seems to me that we 're about to witness a big volatility in Altcoins very soon... As you know Bitcoin has been pumping for few months now and we haven't really seen any significant change in almost all the allcoins which might be confusing but if you look closely to the Litecoin 3 months chart you can see exactly why.
Whales has been accumulating for the last few months and as soon as the Bitcoin crashes (inevitable) all allcoins should crash even more and we should witness an all time low for most altcoins especially LTC which might reach the ALL TIME LOW line!
Bollinger Bands for the 3 months chart shows that we are getting rejected by mid band for months and its only logical that we fall to the lower band which is around 30$ and this price can be the ultimate entry price for long term investment!
Try to catch the train from the start and hodl untill the big pump news comes out wether its a Walmart announcement or whatever BS they say its gonna pump super hard !
Let me know what do you guys think about this and I'm looking forward for your comments.

$COIN viction Trade: Weekly Up, Daily Tight
NASDAQ:COIN
Summary
NASDAQ:COIN exhibits a textbook “expand → break → retest → coil” progression. A broad weekly megaphone that developed through 2024 continued into 2025 with a June ’25 breakout; price subsequently reached ~$445 (megaphone resistance) in July ’25 and then retraced in an orderly fashion, holding above 2023’s ceiling. Since that pullback, ranges have narrowed and participation has declined while price consolidates above $280—behavior consistent with constructive acceptance before a potential next leg higher.
Market Structure and Setup
The primary structure is defined on the weekly chart: an expansionary megaphone that retested prior highs. Tactically, the daily chart shows a controlled pullback, retest, and subsequent coil. This multi-timeframe alignment—higher-timeframe trend with lower-timeframe acceptance—creates favorable conditions for measured moves and for risk to be defined against transparent levels rather than discretionary judgment.
Fibonacci-Based Upside Roadmap
Anchoring to the 2024–2025 impulse advances, 1.618 extensions cluster around ~$580 (Sep ’24 → Dec ’24 leg) and ~$650 (Oct ’23 → Mar ’24 leg). These are not short-dated “targets” but conditional waypoints: they remain operative if the current consolidation resolves higher and the weekly uptrend reasserts.
Microstructure: Short Consolidations as Future Magnets
In sustained advances, brief, tight candlestick compressions often function as “price memory,” attracting subsequent retests and liquidity. COIN’s February 2024 bull-flag pause—formed mid-run—has been revisited multiple times since, underscoring how such compressions act as magnets in later price action. The present tight band atop $340–$370 should be viewed in similar context: it is both a potential near-term launchpad and a likely reference zone for future pullbacks as supply and demand re-balance around it.
Execution Plan
Accumulation is favored on constructive behavior within $290–$330 (retest followed by a higher low on the daily). For risk management, tactical invalidation sits below ~$280; for participants keying off weekly structure, a wider ~$250 stop aligns with the higher-timeframe shelf. If momentum resolves first, additional entries are reasonable on a clean break-and-hold above local range highs, using the reclaimed shelf to maintain tight risk. From a successful breakout, staged distribution into ~$580 with reassessment into ~$650 allows the position to self-finance while respecting the possibility of momentum fatigue.
Invalidation Criteria
A daily close back below ~$280 would indicate the near-term reclaim has failed and the base requires more time. A weekly close beneath ~$250 would challenge the integrity of the larger expansionary structure. Either signal warrants standing aside and allowing the chart to reset.
Fundamental Linkages
Coinbase’s revenue remains acutely sensitive to crypto price trends and realized volatility. When BTC/ETH trend and trading activity broadens across spot and derivatives, COIN’s top line typically expands with the cycle. The U.S. regulatory backdrop has moderated relative to the prior year—removing one overhang—yet policy risk persists and can shift rapidly. In effect, the technical setup has a plausible fundamental tailwind when the broader crypto complex trends and trades.
Key Risks
Crypto beta: A broad risk-off in digital assets will likely transmit to COIN regardless of technical posture.
Policy/regulation: Adverse enforcement actions or new rules could impair volumes, product breadth, or take rates.
Competition: A prospective Kraken IPO would arm a major U.S. competitor; Robinhood’s continued crypto build-out pressures economics during quieter tapes.
Operational/security: Exchange businesses carry ongoing operational and cybersecurity risks; incidents can compress multiples abruptly.
Conclusion
The market disclosed intent with the June breakout; current price action is testing sponsorship. Provided COIN continues to accept above $280–$330 and the ongoing coil resolves upward, the $580 → $650 roadmap remains credible. The operative plan is to trade the daily in the direction of the weekly, treat the former resistance shelf as the line in the sand, and require the chart to confirm strength before pressing exposure.
Not financial advice. Just charting things out. Let’s see what happens. Please adapt levels, sizing, and risk controls to your own process and constraints.

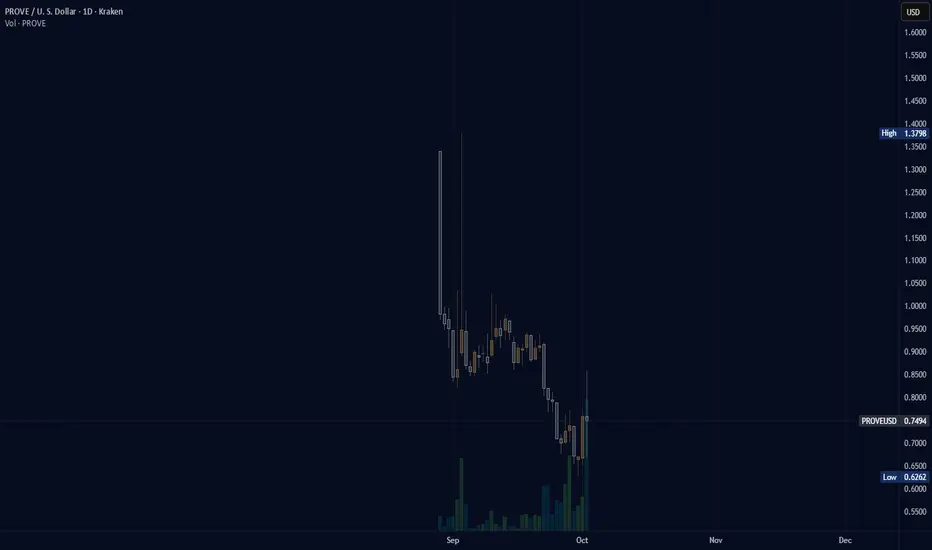
(PROVE) succinct "listed to kraken"When I was doing the end of month tally I did notice a few companies that were listed on Coinbase that were not available on Kraken. The next day I noticed PROVE was on Kraken. Did it slip by unnoticed inpublicly based on the new listings page of kraken or did I not write it down at the time. I check new listings for Kraken daily, practically, and even if a day or two goes by when I miss checking I usually catch up quickly.
STBL Market Update📊 AQUISUK:STBL Market Update
🚀 STBL has broken out of the 🔴 red resistance zone — what’s next? 🎯 First target = 🔵 blue line level.

Long time in weekly chart, target 2.88, RR:2.53Following FIL in weekly chart,
I got a long signal from my power indicator which I belive will lead us to next resistance level. Also this resistance level intersects with one of my key level.
I think it's a good time to jump on the wave.
RR: 2.53
TP : 2.88
SL : I'd stop under 2.52 wekkly candles.
Your thoughts?

Understanding How Crypto Exchanges Influence Coin PricesUnderstanding How Crypto Exchanges Influence Coin Prices
Cryptocurrency markets often appear unpredictable, with sudden price surges or drops that seem to defy logic. For example, when Bitcoin ( CRYPTOCAP:BTC ) experiences a sharp upward spike—a "green candle"—many altcoins follow almost instantly. Why does this happen so quickly? This tutorial explores the theory that centralized exchanges (e.g., Binance, Coinbase) can manipulate coin prices by adjusting internal database values rather than executing real on-chain trades, and how they may use "pegging ratios" to control price movements of specific coins or ecosystems.
The Myth of Instant Market Reactions
When CRYPTOCAP:BTC surges, altcoins often move in lockstep, seemingly without delay. A common assumption is that millions of investors or market-making bots react simultaneously, causing this synchronized movement. However, natural market reactions typically involve some lag due to order book processing, trader decisions, or bot algorithms. So why is the movement near-instantaneous?
The answer may lie in how centralized exchanges operate. Unlike decentralized exchanges (DEXs), which rely on transparent on-chain transactions, centralized exchanges manage trades internally using their own databases. This means they control virtual coin balances, not necessarily actual blockchain assets. When an exchange wants to "pump" a coin (e.g., increase its price by 10% following a CRYPTOCAP:BTC spike), it doesn't need to buy real coins on the blockchain. Instead, it can simply adjust the coin's value in its database, creating the appearance of market activity without requiring reserve assets.
This internal manipulation allows exchanges to influence prices rapidly, explaining the lack of lag in altcoin movements.
------------------
How Exchanges Peg Coins to Major Assets
Exchanges often peg the price movements of altcoins to major cryptocurrencies like CRYPTOCAP:BTC , CRYPTOCAP:ETH , or CRYPTOCAP:SOL , using a weighted ratio that determines how closely a coin follows these leaders. This pegging isn't a fixed value but a dynamic relationship that can vary by coin or ecosystem. For instance:
Typical Pegging Structure:
50% tied to CRYPTOCAP:BTC (the dominant market driver).
50% tied to other ecosystems (e.g., CRYPTOCAP:ETH for Ethereum-based tokens, CRYPTOCAP:SOL for Solana-based tokens).
Example: A meme coin on the Ethereum blockchain might be pegged 50% to CRYPTOCAP:BTC , 25% to CRYPTOCAP:ETH , and 25% to a general "meme coin" index.
This pegging explains why some coins pump or dump more aggressively than others during market trends. Each coin's price movement is a weighted response to the assets it's tied to.
The Role of Pegging Ratios: Pumps vs. Dumps
Exchanges don't apply uniform ratios for upward and downward price movements. Instead, they may assign positive or negative ratios to influence a coin's trajectory:
Positive Ratio: A coin rises faster than its pegged assets during pumps (upward movements) and falls slower during dumps (downward movements). This increases the coin's value over time, often because the exchange holds a large position and plans to sell later for profit.
Example: CRYPTOCAP:SOL might have a 2:1 positive ratio, rising twice as fast as CRYPTOCAP:BTC during a pump and falling half as fast during a dump.
Other Examples: CRYPTOCAP:BNB (Binance's token) and GETTEX:HYPE often show positive ratios, benefiting from exchange favoritism.
Negative Ratio: A coin rises slower than its pegged assets during pumps and falls faster during dumps. This can gradually erode a coin's value, often used by exchanges to liquidate or delist coins they no longer favor.
Example: SEED_DONKEYDAN_MARKET_CAP:ORDI , pegged to CRYPTOCAP:BTC , may fall faster than CRYPTOCAP:BTC during dumps and rise slower during pumps, leading to a net decline.
Other Examples: CRYPTOCAP:INJ , NYSE:SEI , LSE:TIA often exhibit negative ratios.
Meme coins are a special case, typically pegged to both CRYPTOCAP:BTC and their native blockchain:
CRYPTOCAP:PEPE (Ethereum-based) may have a neutral ratio, moving evenly with CRYPTOCAP:BTC and $ETH.
SEED_DONKEYDAN_MARKET_CAP:BONK (Solana-based) might have a negative ratio, falling faster than CRYPTOCAP:BTC and $SOL.
------------------
Exchange Strategies: Controlling Ecosystems and Liquidation
Exchanges can manipulate entire ecosystems by adjusting ratios for categories of coins. For example:
Setting a 2:1 ratio on all meme coins could make them rise twice as fast as CRYPTOCAP:BTC during a pump, creating hype and attracting retail investors.
Conversely, assigning a negative ratio to an ecosystem (e.g., certain layer-2 tokens) can suppress their value, allowing the exchange to accumulate or liquidate positions.
A notable strategy is slow liquidation:
Exchanges may apply a negative ratio to a coin they wish to delist (e.g., SEED_DONKEYDAN_MARKET_CAP:ORDI ). Over time, the coin's value erodes until it reaches a level where the exchange can justify delisting it, citing "low trading volume" or "lack of interest."
This process creates space for new coins the exchange favors, often ones they hold or have partnerships with.
------------------
Why This Matters for Traders?
The idea that coin prices are driven purely by investor sentiment and organic price action is overly simplistic. Centralized exchanges, with their control over internal databases, can heavily influence price trends. Understanding this can help traders:
Identify Positive-Ratio Coins: These are likely to increase in value over the mid-to-long term. Accumulating coins like CRYPTOCAP:SOL or CRYPTOCAP:BNB during dips could yield profits if their positive ratios persist.
Avoid Negative-Ratio Coins: Coins like SEED_DONKEYDAN_MARKET_CAP:ORDI or CRYPTOCAP:INJ may bleed value over time, draining portfolios unless traded carefully.
Monitor Ecosystem Shifts: Watch for exchange announcements (e.g., new listings, delistings) or unusual price movements that deviate from $BTC/ CRYPTOCAP:ETH trends, as these may signal ratio changes.
------------------
Important Notes
Dynamic Ratios: Pegging ratios are not fixed and can change daily based on exchange strategies, market conditions, or liquidity needs. Always verify current trends with real-time data.
Data Sources: Use tools like CoinGecko, CoinMarketCap, or on-chain analytics (e.g., tradingview) to track correlations between coins and their pegged assets.
Risks of Centralized Exchanges: This tutorial focuses on centralized platforms, not DEXs, where on-chain transparency limits such manipulation. Consider diversifying to DEXs for more predictable trading.
Speculative Nature: While this theory is based on observed market patterns, it remains speculative. Exchanges rarely disclose internal mechanisms, so traders should combine this knowledge with technical analysis and risk management.
------------------
Conclusion
Crypto exchanges wield significant power over coin prices by adjusting virtual balances in their databases and using dynamic pegging ratios. By understanding positive and negative ratios, traders can make informed decisions about which coins to hold or avoid. Always conduct your own research, monitor market trends, and use secure platforms to protect your investments. The crypto market may be rigged in some ways, but knowledge of these mechanics can give you an edge.
(DEEP) deepbook "new to kraken" Noticed this being new, slipped past me noticing. Publicly known now.

(NPC) non-playable coinNew to Kraken exchange, seems to be a contender in something fascinating to those people that buy weirdly strange internet meme tokens. Only a few days have passed but after the second ticker the price appears to not be losing.

(LOFI) new to krakenAdded today to kraken, (LOFI) "live." Brand new. Been established since Nov 2024. It looks like a wooly blue frog thing meme based on the pepe frog meme. Icelandic version of Pepe? I don't like how Kraken does not offer 100% of the time a description about new coins. The same is true for Coinbase. Sometimes there is a description but sometimes there is no description. How can they offer a business model but not offer the complete up front package of short form information about a company. Seems like laziness to have all the documentation to list a coin but not take the amount of time is takes to copy and paste a quick description of the coin onto the user website.

(PLUME) plume "new to kraken - secret"I noticed Plume became new to kraken but did not appear at the top of the newly listed tokens. Here is a post to share the information briefly about the plume token which I did not know of previous to today.

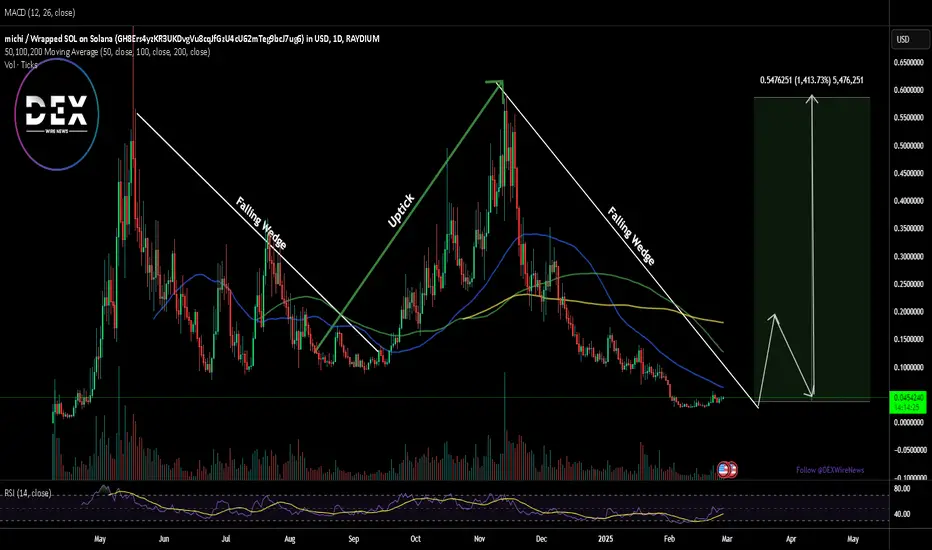
$MICHI Set for 1400% Leap Amidst Historic Falling wedge PatternThe Solana-based memecoin $MICHI is showing strong signs of a potential 1400% rally, with its price action forming a historic falling wedge pattern—a setup that has previously led to massive breakouts. As market conditions align for a bullish reversal, investors are keeping a close eye on $MICHI's next move.
Technical Analysis
A falling wedge pattern is often a bullish reversal indicator, and $MICHI has repeatedly followed this pattern before making parabolic moves. Currently, the token is trading below key moving averages, creating room for a sharp recovery. With an RSI of 49.28, $MICHI is nearing neutral territory, indicating that selling pressure has eased, and a breakout could be imminent.
If this pattern plays out as expected, the memecoin could revisit its all-time high (ATH) of $0.57, marking a staggering 1400% surge from current levels.
Final Thoughts:
All indicators suggest that $MICHI is primed for a major move. With a well-established pattern, key technical indicators aligning, and strong fundamentals backing it, the stage is set for a potential bullish breakout. However, as always, traders should monitor key resistance levels and overall market sentiment before making a move.
XRP: Will people who missed out get another chance?KRAKEN:XRPUSD
So, as we made over 900% in our XRP buys (Appreciate everyone who messaged me and thank me - you should be proud for holding and being patient as you were rewarded heavily! ), lets see if there is a chance we go lower again.
As always, anything is possible in crypto, just yesterday we saw a huge drop , confirming that crypto havent changed at all.
As price rejected ATH and started retracing we can look at the points where it could go. Just a simple Trendline can mark a spot of reversal. We can see that price is respecting that trendline over the years , and needs/should be tested again.
With that trendline we have two accumulation zones - marked on the chart. This is the place where I would look to reinvest those big gains. As we were selling on the way up and on high prices. . we do not need very low prices to make a another amazing ROI.
So first zone ( BUY ZONE ) corresponds with the trendline and is more likely to happen.
Second zone ( BIG BUY ZONE ) could happen if we get some extension.
Third zone ( ALL IN ACCUMULATION ZONE ) is very less likely to happen but we need to keep that in mind as that is accumulation zone that was left untested. And here would be optimal and best buys that everyone would wish they happen.
So again, this is a long term analysis (you saw how other played out and we made a big money and % gain), so once again BE PATIENT and play it SMART.

Another FLARE signalWe hav seen in the past when flare breakers it’s previous highs, it has a tendency to sky rocket.
When we see these next 15min candles close above $0.01650 we could see a power move to catch up to the rest of the market. Selling under $0.02.
If the tend line fails, I’m out.
Good luck and have fun with it

(ETH) ethereum "donchian channels - pattern"See the pattern. It's easiest to see on the ETH Kraken USD. There is a 20 day pattern found. There is donchian channels pattern currently going on. The ending of the pattern is on the 25th. Will the price go up towards the 25th and dramatically fall given the current movement of Ethereum? I also noticed there is news concerning IOTX with an event happening on the 25th of september concurrently. Interesting.

(MOG) mog coinmog coin listed to kraken but now does not appear on their website as newly listed. Not sure if there is a bug or glitch or if they decided to not list mog coin. As I can see on trading view the kraken USD mog coin pair does exist despite the listing on their website going blank. Kraken also listed memecoin. In the last few months Kraken has listed some ~50 cryptocurrency to their trading exchange.
notable add-ons include;
TURBO, ECHELON PRIME, PARCL, RENDER, FLOKI, MANTLE, KUJIRA, BITTENSOR, LAYERZERO, BIG TIME, PENDLE, SAFE, MAPLE, HELIUM, BONK, OPTIMISM,.
people in the USA cannot trade :
ACA, AGLD, ALICE, ASTR, ATLAS, AUDIO, AVT, BONK, C98, CFG, CLOUD, CSM, FLOKI, GENS, GLMR, HDX, INTR, JASMY, KIN, KMNO, KUJI, L3, LMWR, MC, MV, NMR, NODL, NYM, ORCA, OTP, OXY, PARA, PEPE, PERP, PICA, PORTAL, PRCL, PSTAKE, PYTH, RAY, REQ, REZ, ROOK, SAMO, SDN, STEP, SUI, TEER, WEN, WIF, WOO, XRT, YGG, ZEX.
I notice quite often the best performing cryptocurrency "on the day," is one that is not tradable in USA. For instance, this week Sanctum (CLOUD) performed the best while most cryptocurrency was losing yet there is no way to gain from this instance because as seen from above CLOUD is not tradable in USA. Neither Bonk nor Dogwifhat are tradable in America on Kraken.com.
to check your location here is the link:
support.kraken.com


(BEAM) beam "ICO -- funding"Early funding for BEAM based in Tel Aviv, Israel; most active location Peru 25%, was ICO in nature. Historically, ICO's are the type of company funding the SEC is most aggressive labeling securities.

Thorchain (RUNE) "ICO -- funding"Early funding for Thorchain was an ICO. As many people know the SEC in America does not take ICO funding for cryptocurrency lightly. They don't like it and many companies that were first funded as by ICO funding have found their way onto the SEC lawsuits list.

(DYDX) dydx "third most active location -- China"The third most active location is China with 13%, second UK 13%, and India first most active location for Dydx at 26%. Headquarters are here in USA, California.

(ETHFI) ether.fi "most active in Russia"using data as found on crunchbase.com Ether.fi known as ETHFI is most active location is Russian Federation at 23%.

FETUSD Bear FlagLooks as tho FET is making a bear flag. And looking across the ALT coin market. Most coins are looking as they're about to retrace to a higher low. Once that is done. We should see a retest of highs and even breaking out to new ATH #FETUSD
