Alephium (ALPH) - “Wedge of Worth: Poised to Snap Higher"🌱 Fundamentals & Catalyst
- Alephium is a next-generation Layer-1 blockchain combining a stateful UTXO model, sharding tech (BlockFlow), and a “Proof of Less Work” consensus, offering high TPS and energy efficiency.
- The token ALPH powers the ecosystem: mining incentives, developer SDKs, and support for dApps built on the chain.
- Recent news show institutional-grade partnerships and roadmap momentum such as the Phase 2 Roadmap Teaser and PrimeVault custody integration.
Why this matters => The technical stack and ecosystem signals suggest ALPH is moving beyond speculative status into infrastructure play, creating a bullish tailwind for the setup.
📉 Technical Picture
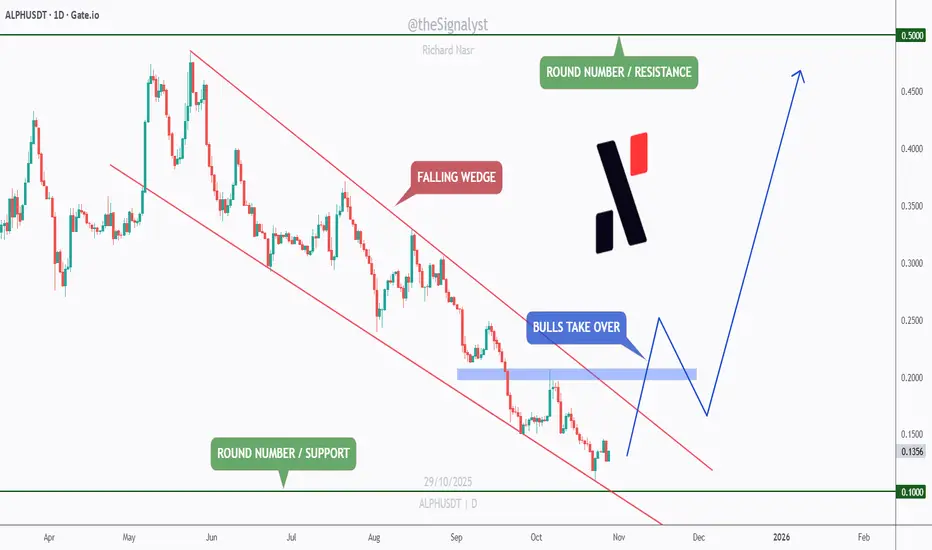
- ALPH has been trading inside a clear falling wedge pattern, a classic bullish reversal structure indicating price compression ahead of a breakout.
- Price is now sliding toward the strong round-number support at $0.10, a psychological anchor and historical inflection zone.
- Trigger for confirmation: A clean break above the last major high (blue zone on chart) followed by a retest or sustained close above it.
- On that breakout, the first target is significant: the next round number at $0.50, offering substantial upside.
- Risk control: A sustained breakdown below $0.10 would invalidate the bullish reversal thesis and turn the wedge into a trap.
🧭 Trading Plan
- Watch zone: ~$0.10 support, ideal area to look for bullish reversal signals (rejection wicks, volume pickup, retest of breakout).
- Entry trigger: Break & hold above recent blue-zone high, with confirmation (H4/DAILY) + backing volume.
- Targets: $0.50 as primary upside; intermediate stops could scale profits earlier.
- Invalidation level: Close below $0.10 turns the bullish scenario off, flip to neutral/bearish until structural support reasserts.
⚠️ Disclaimer: This is not financial advice. Always do your own research and manage risk properly.
📚 All Strategies Are Good; If Managed Properly!
~Richard Nasr
L1
Is the SUI / SOL ratio forming a cup and Handle?Key Takeaways of a Cup and Handle:
The cup and handle pattern represents a bullish technical price formation that manifests on a price chart as a cup accompanied by a handle, indicating a possible buying opportunity.
This pattern generally develops over a span of seven to 65 weeks and is defined by a "U" shaped cup followed by a handle that slopes downward.
In order to trade the cup and handle pattern, traders may opt to place a stop buy order just above the upper trend line of the handle or wait for the price to close above it, establishing a profit target based on the height of the cup.
Instances such as Wynn Resorts illustrate how a properly formed cup and handle pattern can lead to substantial price movement once the pattern is validated and the resistance level is breached.
However, limitations include the duration required for the pattern to form and the variability in the depth of the cup, necessitating its use in conjunction with other signals and indicators.

(BTC) bitcoin "balancing act"Lines drawn based on indications in an attempt to foresee the direction of bitcoin. Day chart. Yellow Lines are aligned with variable average patterns. Orange lines are more concretely focused on consistent timeframe measurements. The trading psychology right now is not at its peak. Array pressure on the price is high where May 2025 was the last time BTC was at a low array buying pressure. Similarly, Bollinger Band phase is positive with the last negative being around April to May 2025. Bear power is in control right now. Selling pressure chop chai confirms the bear power indicator. Directional momentum does appear to be being taken over by selling also indicated is the strong average gauge to confirm the strength of selling. MA quad gives an indication the price is losing with the losing line in control over the top of the winning line. Triple descending pyramids appeared last week with the last time multiples of those type appeared happened around the start of February 2025. MACD lines have crossed 0 moving in a downward direction.
The balance of the imaginary weighted scale appears to be shifting to the right as in falling until the balance is level. The price of BTC often follows no logical path or makes any sense. This image is not entirely made up and relies on indicators which are unpublished that I drew over to show what is stated in the post.

ARBUSDT 4H Chart Analysis | Trendline Integrity & Key TargetsARBUSDT 4H Chart Analysis | Trendline Integrity, Volume, Divergence & Key Targets
🔍 Let’s break down ARBUSDT on the 4-hour chart, spotlighting trend structure, swing plays, volume signatures, and momentum for precise trading setups.
⏳ 4H Overview
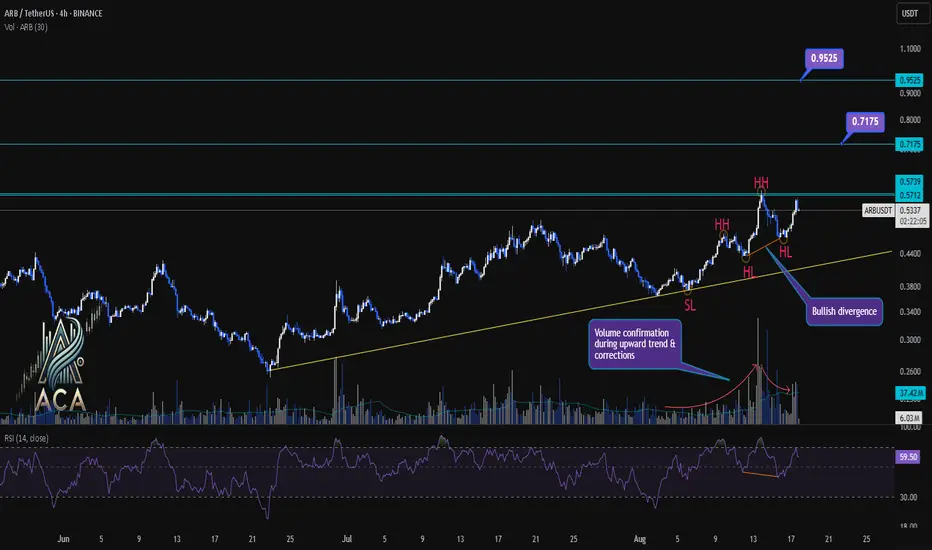
The chart shows ARBUSDT maintaining a solid uptrend, respecting its ascending trendline while consistently printing higher highs (HH) and higher lows (HL). This structure underscores ongoing bullish conviction. Price action recently staged a strong bounce off the trendline with marked bullish divergence on RSI, and volume confirmation adds muscle to the move.
🔺 Key Bullish Setup:
- Trendline Continuation: Price respects and bounces off a well-defined yellow trendline, reinforcing the uptrend’s technical foundation and providing a dynamic support reference for traders.
- Swings (HH, HL, SL): The chart highlights multiple Higher Highs (HH) and Higher Lows (HL), validating persistent bullish order flow. A prior same low (SL) remains untouched, further cementing trend integrity.
- Volume Confirmation: Noticeable upticks in volume during upward impulses and corrections confirm genuine momentum and institutional participation. Recent volume surges during corrections point to accumulation.
- RSI & Bullish Divergence: The RSI (14) is currently at 60.51, below typical overbought territory and leaving room for more upside. Significantly, the latest HL forms alongside a bullish RSI divergence—price makes higher lows as RSI also rises—implying underlying buying strength and likely trend continuation.
- New Overbought OB Level: A fresh OB is marked at ~82.40 on the RSI, establishing a clear ceiling should bullish momentum accelerate.
- Resistance & Targets: Key resistance is at 0.5712 — price testing or breaking this level is pivotal. Above, technical targets are projected at 0.7175 and 0.9525, aligning with previous structural pivots and projected breakout extensions.
📊 Supporting Details:
- Trendline & Swings: The consistent pattern of HLs, HHs, and untouched SL demonstrates primary bullish control.
- Volume: Surging volumes during impulse moves and corrections confirm that buyers are driving rallies while also absorbing dips.
- RSI Bullish Divergence: Underlines demand emergence at each corrective phase.
- Order Book Dynamic: Price above 0.5712 faces thinner resistance, offering room for a rapid move toward the upper targets.
🚨 Conclusion:
With trendline support holding, recurring bullish swing patterns, strong volume on breakouts and corrections, and RSI confirming hidden buying pressure, ARBUSDT is positioned for bullish continuation. Watch for confirmed closes above 0.5712; upside expansions to 0.7175 and 0.9525 are highly probable if volume inflow and RSI momentum persist. The defined new RSI OB at 82.40 helps monitor overextension risk.
Stay alert for any trendline or HL breakdowns, but as long as this structure holds with supporting volume and momentum, the bias remains positive. Watch resistance reactions and momentum signals to ride the next wave.
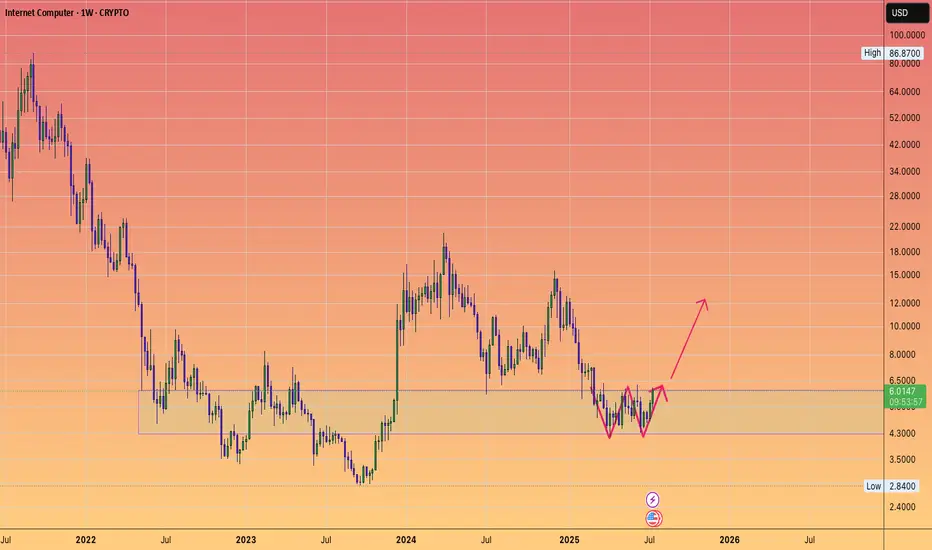
ICP still in the reload support zone....W pattern.
I like it down here.
Low risk accumulation block given the backdrop of #altseason going on.
Enjoy.
;)
BERA: GOOD BUY AREA FOR A SWING TRADEBerachain token BIST:BERA has been in down only mode since inception with minimal rallies. I think its price now is attractive for a buy with excellent risk to reward!
BERA market cap is around 250 BMV:MM and FDV of +1 Billion $.

(BTC) bitcoin "signs"the blue/green line is crossing the purple dotted line. This is a sign representing a transitional phase between moving averages where the short line begins to cross over the patterns of longer time frames. I was looking at this today and though any indicator is never 100% accurate it is always better to see positive signs rather than no signs at all. Could this be the summer of crypto? A positive crypto summer unlike so many previous years? I'm well aware the second quarter just started and summer is not close by 3 months time.

(ETH) ethereum one day chart,. I confused the week chart setting for the day and found more optimism than there truly is. Still the line are converging and separating and creating time as a chart to distance oneself from reality only to get lost in the timeframes of trade.

(ETH) ethereum "triangle - slant"Ethereum is not priced for an only up direction as of right now, unlike Bitcoin. As seen in the chart and indicator. The pink and purple dotted lines are close to intersecting and if the pink link crosses over this is a good sign for the chance of a neutrality and even a possible upward forming price chart position.

(APT) aptos "ahead of the game, or not"It is not use in being ahead of the price trend if the price is not going to recovery before Bitcoin, Ethereum, Dogecoin. Dogecoin used to be the one to measure between the big three cryptocurrency prices. Nowadays, Dogecoin is so popular with such a strong price hold and the fact that the unlimited coins means to measure Dogecoin is quite a bit more strange when compared to all the other limited circulating supply companies. Aptos appears to be closer to a neutral position, or will the price keep falling if Etherum and Bitcoin do not go flat? That is what I mean by this.

(DOGE) dogecoin "oversold indications"The price of Dogecoin is considered oversold based on an Elliott Wave custom pattern by DGT that I sometimes use to look for overbought and oversold signals. The four diamonds is similar to Jasmycoin's oversold signals.

(TOTAL) total crypto mcap "candles on record [history"worst red candles on record in the past four years and various progresses of positive growth measured from lowest in between points.

(XLM) stellarstellar headed towards the blackhole crossing. Will the price up and over or underneath is the question. Also shown in the graph is my standard parabolic look with varying colors for each side of the dots (bubbles).

(ETH) ethereum "sliding scale"A view of Ethereum per the indicator I use the most, moving average with increments of a year, and symbols to determine the crossover/under patterns. dots are bad, plus signs are good generally based on the indicator.

(XLM) STELLARBefore large businesses finally consume the market of defi to become well established payment systems, small businesses can do so sooner than later. Even if large businesses are not using cryptocurrency to receive and transaction payments, there is no reason small businesses and freelancers cannot offer a way to receive and send payments through decentralized means. If most people used defi payment systems of some type (Preferred by the user) the need to care about whether the largest banks connected the two points as a bridge would not be necessary or important. In a way, it is as if society expects the banks, instead of the businesses (large, med, small) to make it possible to connect with payment crypto systems. If the business uses or even requires crypto payment transactions the bank is the one that will need to keep up and not the other way around. Why are we living in a world where we let the people that do the least amount of future thinking decisions control the way the future will be shaped. Banks have power through the people. Power to the people, not the banks. Banks collect all the money and use the collective bargaining chip to control people. From an individual standpoint people are more important than banks and as a network of individuals the movement of money is free flowing only if people choose to control their future and money. It is the end of the world, we're all going to die, this is the end, oh no. Investing in risky assets was never a safe bet as much as a risk worth taking. Keep that in mind. Using a feeless service like XLM for transactions that happen instantaneously would not be subject to issues of volatility in price. If there was a way to buy a crypto at the same time as transacting the cryptocurrency for the purpose of a transaction, now that would be revolutionary; so as to avoid the idea of holding the cryptocurrency to make the transaction.

(ALGO) ALGORAND "gravestone doji"At the peak of price of Algorand the chart pattern formed a gravestone doji candle before depleting and falling into the reckoning wave of losses along with most other cryptourrency.

(ETH) ethereum "BE"bearish engulfing trend candle. potential reversal. chart view. There is too much optimism when losing occurs and too much negative when winning happens, with cryptocurrency.
candles shown marubozu red, doji star, bearish engulfing (blue)/bullish engulfing (red)

BERA Defies Market Trends, Eyes 160% Surge Amid Bullish MomentumIn a market facing significant volatility, BIST:BERA has emerged as a top-performing Layer 1 (L1) blockchain coin, surging 13% in 24 hours and inching closer to its all-time high (ATH) of $15.20. With a resurgence in buying pressure, increased spot inflows, and a strong technical outlook, BIST:BERA is positioning itself for a remarkable recovery.
Why is BIST:BERA Pumping?
- Strong Buying Pressure: The Chaikin Money Flow (CMF) indicator stands at 0.04, signaling bullish inflows.
- Capital Movement: After witnessing $2.6 million in outflows, BIST:BERA has now recorded $316K in fresh spot inflows, indicating renewed investor interest.
- Investor Sentiment: Holders are choosing to accumulate rather than sell, reinforcing long-term confidence in the asset’s value.
Moby Expands to Berachain, Strengthening Its DeFi Ecosystem
A pivotal development for the Berachain ecosystem is the launch of Moby, the No.1 options protocol on Arbitrum, on the Berachain Mainnet. Moby has facilitated over $3.5 billion in total trading volume and is now set to transform on-chain derivatives trading within the Berachain network.
Berachain distinguishes itself as an EVM-identical Layer 1 blockchain that operates on the revolutionary Proof of Liquidity (PoL) consensus mechanism. Unlike traditional Proof-of-Stake (PoS) networks, PoL embeds liquidity provisioning directly into the security model, ensuring that validators, applications, and users benefit from a seamless and capital-efficient ecosystem.
Moby’s selection for Berachain’s prestigious Request for Application (RFA) program signals its critical role in the ecosystem. The protocol has also forged key partnerships with Kodiak, Infrared, PumpBTC, and GMX, further expanding its influence in DeFi.
Technical Outlook: BIST:BERA ’s Bullish Setup
At the time of writing, BIST:BERA is up 4%, ranking among the top-performing altcoins of the week. Despite a 65% decline from its listing price, key indicators suggest that BIST:BERA could be on the verge of a substantial breakout:
- Relative Strength Index (RSI) at 65: Holding strong, indicating sustained momentum without being overbought.
- Falling Wedge Pattern: A classic bullish reversal pattern, hinting at an imminent uptrend.
- Potential 160% Surge: BIST:BERA could aim to reclaim its previous ATH of $15.20, presenting a significant upside opportunity.
Conclusion
With a combination of **strong technical indicators, surging capital inflows, and an expanding DeFi ecosystem**, BIST:BERA is well-positioned for a significant rally. As the asset gains traction, traders and investors should closely monitor its price action, as the next leg up could be the most explosive yet.
Will BIST:BERA reclaim its ATH and set new records? The market is watching, and the momentum is undeniable.

Will We Hear About AVAX in 2025?While the market fixates on degen trading, AVAX continues to fly under the radar. Yet, its ecosystem remains one of the most robust in the space. Here’s why it deserves attention:
Avalanche at a Glance
High-speed, multi-chain architecture – Subnets enable independent blockchains with customized rules.
EVM-compatible – Seamless migration for Ethereum dApps.
Near-instant finality – Avalanche consensus achieves low-latency, high-throughput transactions.
Market Position & Recent Developments
TVL: $1.43B (9th among blockchains per DeFiLlama).
Recent Institutional investments:
- In December 2024, the Avalanche Foundation secured $250 million through a private token sale , with participation from firms like Galaxy Digital, Dragonfly, and ParaFi Capital. This funding supports the upcoming Avalanche9000 upgrade, aiming to enhance scalability and reduce transaction costs.
- BlackRock launched its USD Institutional Digital Liquidity Fund (BUIDL) on the Avalanche blockchain via Securitize, marking a significant move in asset tokenization.
Tech Updates
- the newest upgrade "avalanche 9000" is now live ; the main objective - to lower fees 25 times - is successfully achieved.
Price Action & Accumulation
Accumulation since mid-2022 → Local rally in late 2024 with volume divergence.
Price retesting previous accumulation highs (Creek) after rejecting breakout attempts.
Volume profile insight: No major resistance zones above, suggesting minimal overhead sell pressure.
Potential Trade Setup
Considering a spot entry with manual exit, if next week's close confirms a higher low.
Key level: $26 – Strong support from prior accumulation phase.
Do your own research.
Everything is priced in.
Everything is on the chart.

etherum (ETH) "INDICATOR TANGLE"The moving averages with shadow function offer a timeframe to follow before major improvements in price. Right now Ethereum is jumbled up with the third blue line 150 variable moving average. This is not dissimilar to Bitcoin because Bitcoin does not follow such simple methods of indicator transcribing. This would look like the peak is reached according to the orange line and stepped yellow line crossing paths. The difference this time around compared to back in 2021 is in how the blue line is intersecting with those lines (orange, yellow, green) that rise when the price is reaching peak evaluation.

3 Small Cap Crypto to watch...Since you enjoyed my previous post about 3 Crypto OGs to watch this month...
Here's an interesting one about small market cap altcoins:
BINANCE:DYMUSDT
DYM has been hovering within a narrow range after rejecting the round number $1.
Waiting for a break above the upper bound of the range at $2.15 to activate the setup and target the $5 mark.
BINANCE:CYBERUSDT
CYBER has been hovering within a narrow range after rejecting the round number $3.
Waiting for a break above the upper bound of the range at $5 to activate the setup and target the $9.5 mark.
KUCOIN:RIOUSDT
CYBER has been hovering within a narrow range after rejecting the round number $0.5.
Waiting for a break above the upper bound of the range at $1 to activate the setup and target the $2 mark.
Which altcoins would you like me to cover next?
All Strategies Are Good; If Managed Properly!
~Rich

ETH BREAKOUT??Simple chart with key levels shown. After the Trump victory price has broken out from the downtrend of 7 months. So far the breakout has been capped at the major resistance level of $2850. It's a clearly important S/R level with clear TPs on the way back up to local high.
Entry is a tricky one, the macro is clearly bullish with the election news + interest rate cuts happening globally. A safer entry would be a flip of the resistance @ $2850.
A second entry would be the green box and still broken out of the downtrend. That would make the entry closer to being wrong and therefor better R:R but for me less probable as $2850 is still major resistance.
Invalidation is under the green area around $2700 and falling back under the downtrend, approx -6.5% under the possible entry once the S/R is flipped.

APTOS Broken out from a Hunt Volatility Funnel... $40+Building on #SUI's impressive recent performance, it seems that this new #Blockchain for this cycle is poised to attract supportive investment.
While the technical setup isn't flawless, for a perfect #HVF pattern, with a L2 lower versus L1, it still has a strong chance of reaching its anticipated upper targets during this bullish phase!
