shiba inu (SHIB)If Shiba Inu holds so much value, currently ~$5 billion, how come the chart is so lackluster for so many years? Developers spend too much money is my guess. When there is less development for a meme token, the token is more likely to do well, right? Because, if there is nothing happening behind the scenes, there is nothing to deplete the value of the tokens with no need to spend money, or so I'd like to think. Yet, there are always people who are also not in heavy development mode that still seem to spend their investment when the prices are high thus removing the potential long terms gains and future investors along the way.
Layer2

SHIBA INU (SHIB) "current price < coinbase listing price" Shiba Inu proves to be predictably unsupported despite how popular it is for people to talk about their HODL and resistance to selling. The fact that so many people talked about buying Shiba Inu in the past four years and none of those holdings seem to prop up the price of Shiba Inu right now appears to prove meme tokens no matter how adapted and developed lose value faster than we realize. Tokens lose easier than Layer 1 blockchains. The interconnected value of layer 2 tokens means investing in a token will always offer more volatility. On the gains side there is an upside, on the other side that means greater percentages to impact the decline during a selling frenzy. Knowing the price of Shiba Inu is below the price of first listing to Coinbase, is it still worth it to invest time and money into a meme token in 2026 if the price does not carry a supportive value for the long term investment? Is trading cryptocurrency tokens only valuable for short term gains and short term positions?

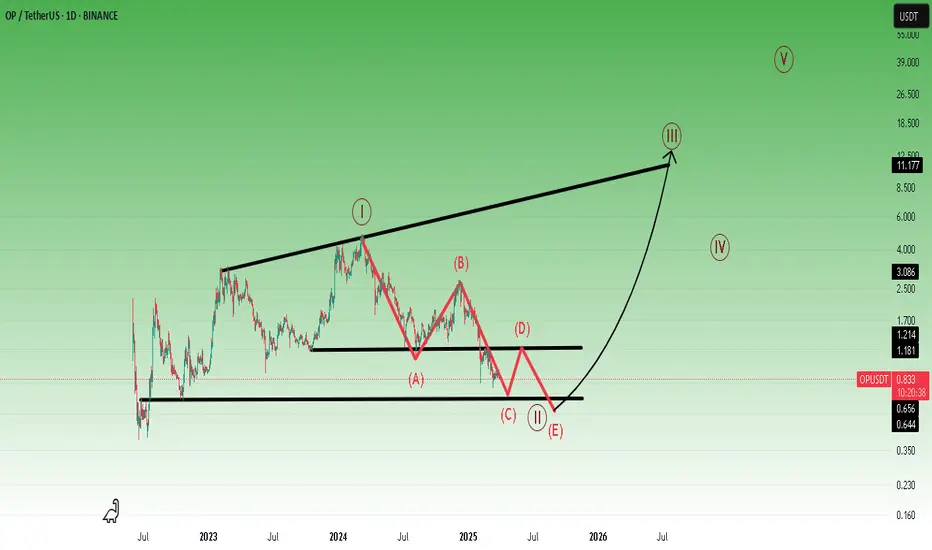
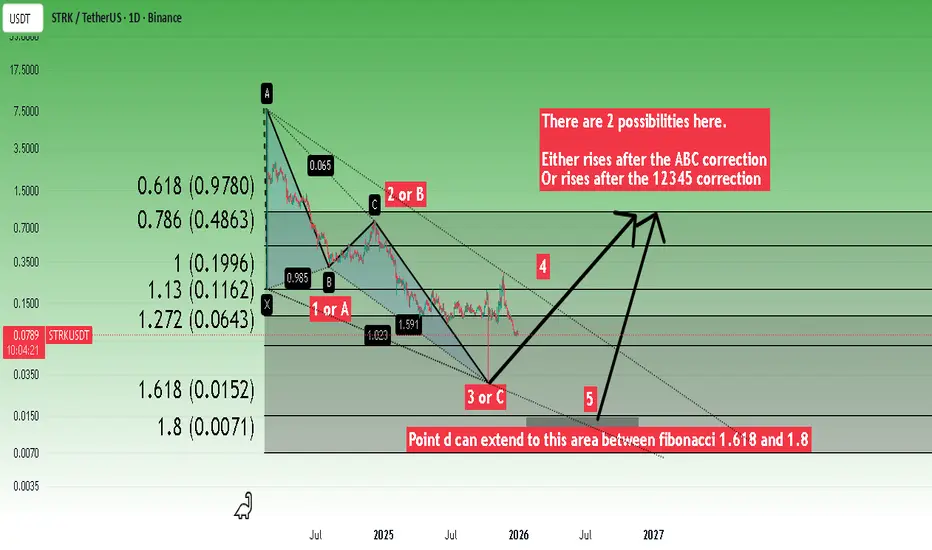
Bullish Harmonic Deep Crab PatternOne of the projects whose technology I like.
I tried to draw two possible scenarios for educational purposes.
* The purpose of my graphic drawings is purely educational.
* What i write here is not an investment advice. Please do your own research before investing in any asset.
* Never take my personal opinions as investment advice, you may lose your money.
TradeCityPro | MNT Testing Key Levels for Bullish Breakout👋 Welcome to TradeCityPro!
In this analysis, I want to review MNT, a Layer-2 Ethereum project with a $3.4 billion market cap, currently ranked 31st on CoinMarketCap.
⏳ 4-Hour Timeframe
On the 4-hour timeframe, this coin has been in a downtrend, and after reaching 0.9596, it entered a range phase.
✔️ Currently, a range box has formed between 0.9596 and 1.1207, and the price is reacting to the top of the box at 1.1207.
💥 On the RSI, we have a very important resistance level at 65.80.
🔔 A break of this level on the RSI would confirm the entry of bullish momentum, and in this case, we can open a long position after the 1.1207 level is broken.
✨ Breaking 1.1207 will be the first confirmation of the bullish trend for MNT, and the coin could initiate an upward wave.
🧩 This upward movement could continue toward 1.3478.
⚖️ However, if the price gets rejected at 1.1207 and moves back toward 0.9596, we can open a short position after breaking the 0.9596 support level.
📝 Final Thoughts
Stay calm, trade wisely, and let's capture the market's best opportunities!
This analysis reflects our opinions and is not financial advice.
Share your thoughts in the comments, and don’t forget to share this analysis with your friends! ❤️

TradeCityPro | POL Near Key Trigger in Ongoing Downtrend👋 Welcome to TradeCity Pro!
In this analysis, I’ll review POL, one of Ethereum’s Layer-2 ecosystem projects, currently ranked 52nd on CoinMarketCap with a market cap of $1.41 billion.
⏳ 4-Hour Timeframe
POL is currently in a downtrend on the 4-hour timeframe and is now moving inside a corrective range within that trend.
🔔 This downtrend continued until the 0.1311 support zone, and after reaching this level, the price began a corrective move upward, retracing up to 0.1391.
📊 Throughout this correction, volume has been decreasing, which is expected and also confirms that sellers still have control of the overall trend.
✨ Given the bearish trend and volume confirmation, opening a short position remains the more logical strategy for now.
💥 On the RSI, we have a support level at 39.60.
A break below this level would be the first sign of a new bearish wave beginning.
📉 The main short trigger on POL is 0.1311.
If this trigger breaks with increasing volume, the downtrend can easily continue.
🧩 For long positions, it’s too early, the market needs to show a clear trend reversal first.
To confirm a reversal, the price must stabilize above 0.1391 and form a higher high and higher low above this zone.
⭐ However, if buying volume begins to increase inside the current range and bullish candles become stronger than the bearish ones, the chances of a trend reversal rise — and in that scenario, a break of 0.1391 can act as an early long trigger.
📝 Final Thoughts
Stay calm, trade wisely, and let's capture the market's best opportunities!
This analysis reflects our opinions and is not financial advice.
Share your thoughts in the comments, and don’t forget to share this analysis with your friends! ❤️

#LAYER/USDT Forming Falling Wedge#LAYER
The price is moving within an ascending channel on the 1-hour timeframe and is adhering to it well. It is poised to break out strongly and retest the channel.
We have a downtrend line on the RSI indicator that is about to break and retest, which supports the upward move.
There is a key support zone in green at 0.2187, representing a strong support point.
We have a trend of consolidation above the 100-period moving average.
Entry price: 0.2240
First target: 0.2380
Second target: 0.2544
Third target: 0.2753
Don't forget a simple money management rule:
Place your stop-loss order below the green support zone.
Once you reach the first target, save some money and then change your stop-loss order to an entry order.
For any questions, please leave a comment.
Thank you.

ARB ARBITRUM 1D - 1W TF .... SCAM?Layer 2 scaling solution for Ethereum...
The coin is moving in a very interesting way — you can clearly see a consistent percentage drop followed by a precise percentage rebound and this pattern keeps repeating every time, almost like a pre-written script.
From the very beginning, the coin has been moving inside a global descending channel.
Right now the coin is trying to repeat the same move that has already happened twice and if it repeats for the third time the outlook for this coin is not encouraging — we could drop another -53%, and it may even turn into a scam, because considering such a coin for investment would be madness.
If in the end the coin finally turns bullish and breaks out of the global descending channel I wouldn’t set any targets higher than the ones marked on the chart

Could TRON #TRX 6X v #BITCOIN TRXBTC
has very good market structure
(higher high's , higher lows's)
for the past 3 years.
Overlooked , & under-appreciated it seems like, in my view on it's sentiment on Justin's success of network adoption.
We can see a clear Inverse head and shoulders
with a very key neckline level
that if broken with strength
could a indicate a run at the LOG target.
A disappointing TRX may only reach the linear target and not much beyond.
My TRXUSD chart which I am watching also does point to a stellar Bull market for TRX

TradeCityPro | POL Faces Crucial Resistance Test👋 Welcome to TradeCity Pro!
In this analysis, I’m going to review POL, one of Ethereum’s Layer 2 projects, currently ranked #48 on CoinMarketCap with a market capitalization of $1.87 billion.
⌛️ 4-Hour Timeframe
On the 4-hour chart, after finding support around 0.1590, this coin formed a high at 0.1724 and has since made its first bullish move after breaking that level.
✔️ Right now, price is facing resistance around 0.1836, a zone it has already tested twice—each time getting rejected.
✨ If 0.1836 breaks, we can look for a long position, with the next resistance area sitting around 0.2046.
📊 یFor short positions, I’ll wait until the structure turns bearish before acting. At the moment, the short trigger is at 0.1724, but the main confirmation of a downtrend would only come after a break below 0.1590.
📝 Final Thoughts
Stay calm, trade wisely, and let's capture the market's best opportunities!
This analysis reflects our opinions and is not financial advice.
Share your thoughts in the comments, and don’t forget to share this analysis with your friends! ❤️

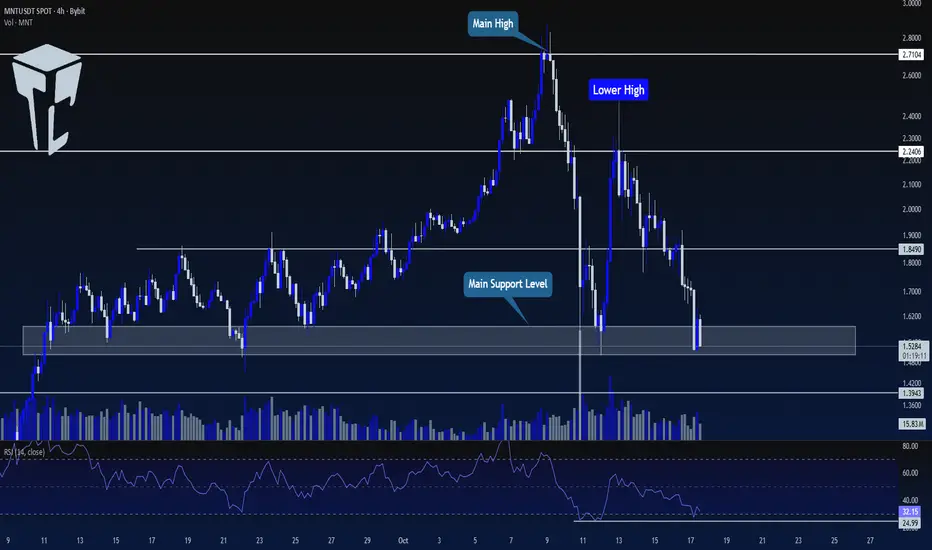
TradeCityPro | MNT: Key Support Holds for Now👋 Welcome to TradeCity Pro!
In this analysis, I want to review the MNT coin for you. One of the most well-known Ethereum Layer 2 projects, with a market cap of $5.03 billion, ranked 26th on CoinMarketCap.
⏳ 4-Hour Timeframe
On the 4-hour chart, after an upward trend, this coin reached 2.7104 and has now entered a corrective and bearish phase.
✨ There is a very important support zone around 1.5. The price has reacted to it once, formed a lower high, and is now back on support.
💥 The RSI oscillator is near the Oversell area. Breaking 24.99 will push the RSI into Oversell.
✔️ For short positions, we can enter on a break of this range. However, since the higher timeframe trend is bullish, we should also consider confirmation from volume, RSI, and Bitcoin.
🔍 For long positions, we need to wait until the market structure creates a proper trigger for a long. Currently, the main confirmation for bullishness is a break of 2.2406.
📝 Final Thoughts
Stay calm, trade wisely, and let's capture the market's best opportunities!
This analysis reflects our opinions and is not financial advice.
Share your thoughts in the comments, and don’t forget to share this analysis with your friends! ❤️
OP - Accumulation Base, Eyes on $1 BINANCE:OPUSDT spent months in markdown, then shifted into a broad accumulation range. Momentum is stabilizing, and price is leaning toward the top of that box.
The first key hurdle is the $1 psychological level 🔑. It lines up with range resistance and a potential phase shift into markup if broken with a clean daily close.
As long as the range low holds, I’ll look for dips to get involved, targeting a retest of $1 and higher inside a developing markup phase 🚀. If price loses the range floor, I’ll step aside and wait for fresh confirmation ⏳.
What’s your plan here => buy the base and ride the breakout, or wait for a confirmed close above $1? 🤔
⚠️ Disclaimer: This is not financial advice. Always do your own research and manage risk properly.
📚 Stick to your trading plan regarding entries, risk, and management.
Good luck! 🍀
All Strategies Are Good; If Managed Properly!
~Richard Nasr
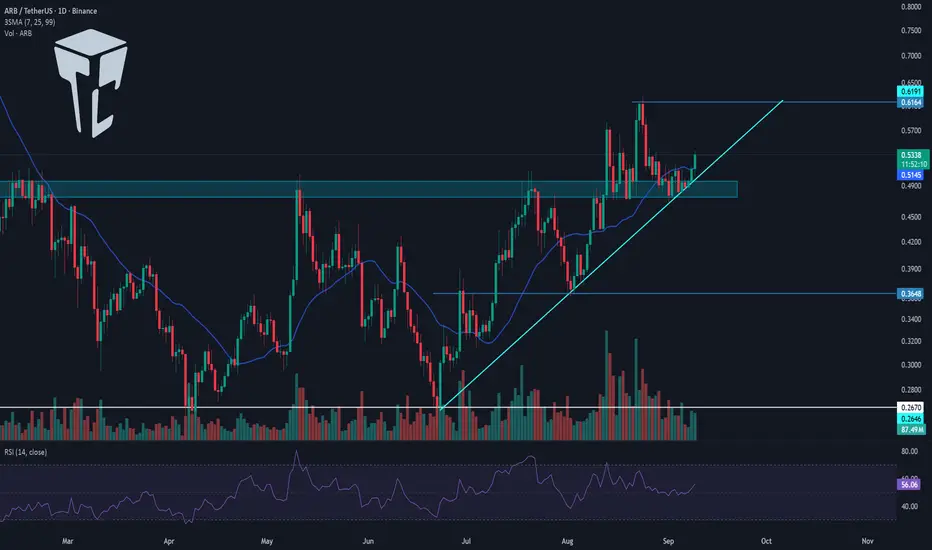
TradersCity Pro | ARB Set for Pump After Pullback to Support👋 Welcome to TradersCity Pro!
In this analysis, I want to review the ARB coin for you. One of the most popular Ethereum Layer 2s, with a market cap of $2.83 billion, currently ranked 43rd on CoinMarketCap.
📅Daily timeframe
On the daily chart, this coin has been in an uptrend along with a trendline and has managed to break through an important resistance zone.
🔔 At the moment, the price is in a correction and pullback phase toward that zone. It reacted to the trendline and bounced upward. The RSI oscillator has also bounced from the 50 level, and if it continues upward, it has room to bring more bullish momentum into this coin.
✔️ The last two candles we had were strong green candles with high volume, showing buyer strength. If today’s candle can hold above the SMA25, the price can move toward 0.6164.
📊 The main bullish move will start after breaking the 0.6164 zone, but the area where support was confirmed is already a very important PRZ. It’s not a bad idea to look for long triggers from this support area on lower timeframes.
⌛️ 4-hour timeframe
On the 4-hour chart, the first long trigger we had — the breakout of 0.5146 — was activated, and the price has so far made a short leg up to 0.5376.
🔍 The 0.5376 zone can be the next long trigger. The negative point here is that the price is in the middle of a bullish leg. These kinds of triggers usually have a lower win rate because they rely on market momentum, and whenever that momentum fades, the chance of getting stopped out rises sharply.
💥 On the other hand, RSI is entering the Overbought zone, which is a strong momentum signal and could help this bullish move continue.
💼 My suggestion: if you already have long positions on this coin or others, it’s not very logical to open a new one here, since this trigger is considered risky. But if you don’t have a position, entering on a breakout of 0.5376 isn’t bad, as RSI entering Overbought could trigger a sharp move upward.
⚠️ Just keep in mind: this trigger belongs to the risky setups, so you should manage your risk on this coin more carefully than on others.
📝 Final Thoughts
Stay calm, trade wisely, and let's capture the market's best opportunities!
This analysis reflects our opinions and is not financial advice.
Share your thoughts in the comments, and don’t forget to share this analysis with your friends! ❤️
TradeCityPro | OP Eyes Breakout in Prolonged Altseason Range 👋 Welcome to TradeCity Pro!
In this analysis, I want to review the OP coin for you — one of the Layer 2 projects whose token currently holds a market cap of $1.39 billion and is ranked 68th on CoinMarketCap.
📅 Daily Timeframe
On the daily timeframe, OP is moving within a range box between 0.521 and 0.920, which formed after a downtrend, and the price has been fluctuating in this box for several months.
🔑 One key resistance on this coin is 0.816, which can be used as a trigger for a long position.
📈 This trigger can also be used for spot buying, but given its Bitcoin pair, I prefer to take the position in futures and reserve spot buys for future triggers.
💥 For momentum confirmation of this position, we can use RSI’s entry into the Overbought zone, since RSI is currently near this area, and if it enters, it could support a strong upward move.
📊 The next long trigger is the breakout of 0.920. However, this trigger is not valid at the moment because the price hasn’t reacted to it for a long time, and in the future, if it does react, the level will likely change. In that case, I’ll update the analysis and give you the new trigger.
✔️ If OP declines, the first important support we have is 0.626. A close below this level could allow for a risky short position, but for shorts, I’ll personally wait for a break below 0.521.
📝 Final Thoughts
Stay calm, trade wisely, and let's capture the market's best opportunities!
This analysis reflects our opinions and is not financial advice.
Share your thoughts in the comments, and don’t forget to share this analysis with your friends! ❤️

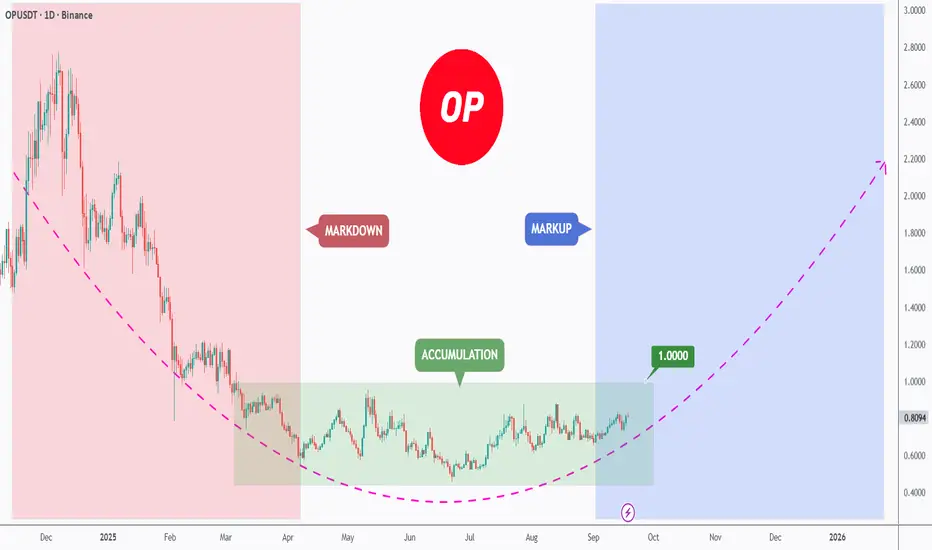
[Deep Dive] OP – Edition 4: Accumulated Pressure!Optimism (OP) may be quietly setting the stage for a classic reversal play — with structure, sentiment, and cycle theory all lining up.
After a sharp markdown throughout Q4 2024 and early 2025, OP has spent several months forming what appears to be a rounded accumulation base. And if history rhymes, a markup phase could be next.
🔍 Phase Breakdown
📉 Markdown
The aggressive downtrend sent OP tumbling from above $3 all the way to the $0.50–$0.60 support region, wiping out months of bullish structure and triggering capitulation.
📦 Accumulation
Since then, the price has been compressing sideways in a tight range, respecting the $0.50 psychological zone while creating a rounded bottom pattern. This sideways action — combined with declining volatility — suggests sellers are exhausted, and accumulation may be underway.
📈 Markup Potential
The current setup mirrors textbook market cycles, where markdown gives way to accumulation, followed by expansion. If OP breaks above the $0.70–$0.85 resistance zone with volume, the door opens for a rally toward $1.85 and even $2.00 — the next key supply zones.
⚙️ Fundamental Fuel
Optimism is more than just a Layer 2 — it’s the engine behind the Superchain vision. With OP Stack now powering not only Optimism but also chains like Base and Zora, the protocol is becoming the backbone of Ethereum’s scalability roadmap.
Recent key updates include:
- New governance structures via RetroPGF Round 3 distribution.
- Continued expansion of OP Stack rollups.
- Growth in on-chain activity and TVL thanks to Base's rapid adoption.
All of this adds up to strong long-term tailwinds — especially if Ethereum Layer 2 narratives reheat.
🧠 What to Monitor Next
🔍 Break above $0.85 = confirmation of phase shift.
📊 $0.50 remains the key invalidation level for the current bullish thesis.
🧨 Watch for volume spikes near resistance — they often precede explosive markups.
💬 Are we witnessing the calm before Optimism’s storm — or just another pause in a longer downtrend?
🔔 Disclaimer: This post is for educational and informational purposes only. It does not constitute financial advice. Always do your own research and manage risk carefully.
📚 Always follow your trading plan => including entry, risk management, and trade execution.
Good luck!
All strategies are good, if managed properly.
~ Richard Nasr

TradeCityPro | APT: Triangle Squeeze Near Crucial Support Zone👋 Welcome to TradeCity Pro!
In this analysis, I’ll be reviewing the APT coin. The Aptos project is one of Ethereum’s Layer 2 solutions.
✔️ This project’s token currently holds a market cap of $3.1 billion and ranks 32nd on CoinMarketCap.
📅 Daily Timeframe
On the daily chart, you can see a very strong support level at 4.718, which has been tested multiple times. The price has once again reached this zone.
💥 A descending trendline can also be drawn, showing clear reactions from the price. The area between this trendline and the 4.718 support forms a triangle pattern.
⭐ If the 4.718 support breaks, a short position could be considered. A breakdown below 37.78 on the RSI would serve as strong confirmation of bearish momentum.
📉 The initial target for the short would be 4.338. However, if a new bearish leg forms and the market heads toward lower lows, a drop toward the 3.12 support level is also possible.
📊 Confirmation of a bullish reversal would come from a breakout above the descending trendline. If this trendline is broken and the 6.152 trigger activates, it would justify opening a long position or even buying in the spot market.
🛒 When it comes to spot purchases, the most important factor is a trend reversal in Bitcoin dominance. Personally, I do not buy any altcoins on spot until Bitcoin dominance shifts downward on the daily chart — I only trade them in futures.
📝 Final Thoughts
This analysis reflects our opinions and is not financial advice.
Share your thoughts in the comments, and don’t forget to share this analysis with your friends! ❤️

TradeCityPro | STX: Watching Triangle Breakout and RSI Reaction👋 Welcome to TradeCity Pro!
In this analysis, I’m going to review the STX coin, which belongs to the Stacks project—a Layer 2 solution for Bitcoin.
🔍 STX, with a market cap of $1.45 billion, is currently ranked 59 on CoinMarketCap.
🔄 In the previous analysis, I drew an expanding triangle and mentioned that if this triangle breaks to the upside, we can enter a long position or even make a spot purchase.
✨ The trigger for the triangle breakout was at the 0.731 level. After breaking out and pulling back to this level, the price moved up to 1.049 and is now once again in a consolidation phase.
📅 Daily Timeframe
Currently, after RSI got rejected from the 73.58 zone and exited the overbought area, the price has undergone some correction. A pullback to the 0.871 level is possible.
🧩 If a pullback or deeper correction occurs, as long as RSI remains above 50, I still consider the market momentum to be bullish and believe the price can continue moving upward.
📈 If we see a solid bullish candle confirming continuation, we can enter a long position. However, the main long trigger is the breakout of 1.049. The RSI trigger for sharper moves would also be a breakout above 73.58.
📊 The next resistance level is at 1.332. If this level breaks, the coin enters a new price zone, and we’ll need to see whether it can establish support above that area.
🔽 For a bearish scenario, we should wait for the market to form a structure and provide a valid trigger to confirm a short position. At the moment, it’s better to wait for that setup.
🔑 If the market turns bearish, the key support zones to watch are 0.731, 0.571, and 0.453, which could potentially halt further decline.
📝 Final Thoughts
This analysis reflects our opinions and is not financial advice.
Share your thoughts in the comments, and don’t forget to share this analysis with your friends! ❤️

TradeCityPro | APT: Testing Momentum After Key Breakout👋 Welcome to TradeCity Pro!
In this analysis, I want to review the APT coin for you. This coin belongs to the Aptos project, which is one of Ethereum’s Layer 2 solutions.
⚡️ APT, with a market cap of $3.6 billion, is currently ranked 32 on CoinMarketCap.
⏳ 4-Hour Timeframe
As you can see in the 4-hour timeframe, after finding support at the 4.687 zone, the price made a very sharp bullish move and reached 5.708. After an initial rejection, it has now managed to stabilize above this level.
🔍 If this bullish move continues, we could see another upward leg, with the next resistance at 6.047. If this level breaks, the price could move up to 6.752.
✔️ There’s a very important RSI ceiling at 80.76, which has consistently caused rejections after sharp upward moves. If the price aims for another bullish wave, this level will be critical and could mark the top of the move.
⭐ A breakout above this level seems unlikely for now, since 80.76 is a very high reading for the RSI oscillator, and the chance of it breaking is quite low. But if it does happen, we could see an extremely sharp and unusual move.
🔽 As for a bearish scenario and short positions, we currently need to wait for a trend reversal. If the breakout above 5.708 turns out to be fake and the price starts moving downward, we can look for a trigger in a lower timeframe to enter.
🔑 But keep in mind that short positions in these market conditions are very, very risky. And if you do open such a position, make sure to secure profits frequently with small risk-to-reward setups.
📝 Final Thoughts
This analysis reflects our opinions and is not financial advice.
Share your thoughts in the comments, and don’t forget to share this analysis with your friends! ❤️

Bitcoin Total Market Cap Update – Strategic Scenarios AheadAs of May 8, 2025, the total cryptocurrency market capitalization stands at approximately \$3.012 trillion, reflecting a 2.17% increase from the previous day . Bitcoin's market cap is around \$1.962 trillion, with a current price of \$98,798.11 .
Given these figures, we are considering the following potential scenarios for the crypto market:
---
1. Break Above \$3T and Hold ✅ (30% Probability)
* The market breaks through the \$3 trillion level.
* Retests it as support.
* Continues the bullish momentum from there.
---
2. Rejection and Consolidation 🔁 (50% Probability)
* Price gets rejected at \$3T.
* Moves sideways between \$2.8T and \$3T.
* Eventually breaks out and retests \$3T as support before resuming upward.
---
3. Bearish Turn Below \$2.8T 🔻 (20% Probability)
* Rejection at \$3T.
* Market loses \$2.8T support.
* Retests \$2.8T as resistance, followed by further downside pressure.
---
Key Levels to Watch
* \$2.8T and \$3T are critical zones. Movements between these levels indicate uncertainty and should be approached with caution.
---
Our Perspective
A retest of \$3T as support could present the strongest buying opportunity of this cycle. We urge everyone to stay alert, analyze carefully, and prepare accordingly.
Golden Cross is looming — remain focused and disciplined.
---
Stay updated and connected:
With best regards,
Team ProCryptoEdge
Educate. Empower. Elevate.

STX entry 1.8 to 2.06 through 4.Stacks ($STX) is a layer 2 (or as described by Stacks as a Layer 1.5) smart contract protocol that lives on the Bitcoin blockchain. Via Stacks DeFI and other utility/protocols including City Coins (currently being minted by New York City and Miami and soon Austin and others), while other DeFi platforms built for Bitcoin live on other layer 1's (i.e. Badger on Ethereum), a smart contract protocol on top of the most secure blockchain may or should not only assist in avoiding a "flippenning" but is critical at a time where multi/cross/para chains are the current solutions to avoid bouncing protocol to protocol.
Additionally Stacks was both the first cryptocurrency to be acknowledged by the SEC as a security and also to be no longer recognized as a security by the SEC after successful adoptions. DYOR, Grayscale and partners have significant involvement in Stacks and was instrumental in the SEC approvals. This is pure gut but my gut says Grayscale will be the first BTC ETF approved by the SEC due to familiarity, etc.
Fractals show a similar pattern having already taken place, expect a full push or a pullback and then push to and through $4. Naturally as tied to Bitcoin, BTC volatility could slow or speed up the growth of STX, but smart contracts on the Bitcoin blockchain is powerful and not discussed nearly as much as one would expect.
The stacking opportunities and ecosystem being built around Stacks i.e. City Coins (read NY and Miami Mayoral comments on plans) make this a long term hold for those who want, as blockchain continues to proliferate real world applications beyond just crypto.

Why Ethereum Could 10x in the Next Few Years🚀
1. Ethereum ETF Approval
ETFs are approved in the U.S. (similar to the Bitcoin ETFs in early 2024), institutional money will flood in.
Grayscale, BlackRock, and others have already filed.
Ethereum’s price jumped significantly after similar events in the past.
2. Deflationary Supply (Post-EIP-1559)
Since EIP-1559, ETH has been burned with every transaction.
Combined with Proof-of-Stake (The Merge), ETH is now net deflationary during periods of high network activity.
3. Layer 2 Ecosystem Is Exploding
Rollups (Arbitrum, Optimism, Base, zkSync) are scaling Ethereum.
These L2s settle on Ethereum L1, driving fees and activity.
Vitalik’s "rollup-centric roadmap" is playing out — this benefits ETH long-term.
4. Real Yield from Staking
Ethereum now offers a real, sustainable yield from staking (~3–5%).
Institutions love yield. ETH becomes more like a productive asset, not just a speculative token.
5. Ethereum as the Base Layer of Web3
DeFi, NFTs, gaming, DAOs — Ethereum is still the dominant smart contract platform.
The most secure, battle-tested, and widely adopted chain.
Developers and enterprises continue to build on Ethereum over competitors.
6. Macro Tailwinds
As the U.S. moves toward looser monetary policy, risk assets (including crypto) historically benefit.
Crypto adoption is growing globally — from Latin America to Asia — and Ethereum is often the entry point.

TradeCityPro | STX: Watching for a Breakout in Bitcoin’s L2 Star👋 Welcome to TradeCity Pro!
In this analysis, I want to review the STX coin for you. This coin is one of Bitcoin’s layer-2 projects and, with a market cap of $933 million, ranks 67th on CoinMarketCap.
📅 Daily Time Frame
In the daily time frame, as you can see, this coin has been in a downtrend. Its most recent upward move began after breaking 1.332, and then it dropped within an expanding triangle structure down to the 0.533 area.
🔍 Currently, the main price support is at 0.453, which the price hasn't reached yet, but the 0.533 area is also strong and could mark the end of the downtrend.
✨ If the price bounces from the 0.533 area and starts moving upward, the likelihood of the triangle breaking to the upside increases. Since the price hasn’t reached the triangle’s bottom and could form a higher low, bullish momentum may enter.
📊 Market volume during the last bearish leg was decreasing, and now with supportive candles forming, volume is increasing—which, if it continues, also increases the likelihood of the triangle breaking.
🛒 If this happens, the buy trigger in spot is at 0.731, which, besides being suitable for a spot entry, can also provide a good futures position in lower time frames.
✔️ The RSI oscillator is also near the 50 level, and if it breaks above that and moves up, the price can head toward higher targets.
📉 On the other hand, for short positions, the 0.533 support is very important, and breaking it could justify opening a short. But note that this area is very close to 0.453, so if you're opening a short, be aware it's very risky and the price could reverse at any moment.
❌ If you already hold this coin and are looking for a good stop-loss level, a break and confirmation below 0.453 is appropriate. However, keep in mind that if your stop-loss is triggered and the price moves back above the support area, you should find a new trigger and buy again so you don’t miss the move.
📝 Final Thoughts
This analysis reflects our opinions and is not financial advice.
Share your thoughts in the comments, and don’t forget to share this analysis with your friends! ❤️

The Dump & Hold Strategy ($70.94 SOON?)URGENT INSIGHTS:
According to my charts, we're either heading into a crappy 20-year downturn... or a 11,000% increase to $70.94 upside depending on your position!
It is now simultaneously optimal to short while going long and/or sell pre-buy, unless of course you're bullish, in which case ensure your purchase precedes your liquidation, but only if your gains are already post-realized prior to any re-entry in either direction, but be sure to hedge.
JUST REMEMBER:
No matter how long the struggle, there’s always relief.
I'm not a financial advisor.

I am very optimistic about Optimisim in the long term.But first, let's go a little deeper.
* What i share here is not an investment advice. Please do your own research before investing in any asset.
* Never take my personal opinions as investment advice, you may lose all your money.