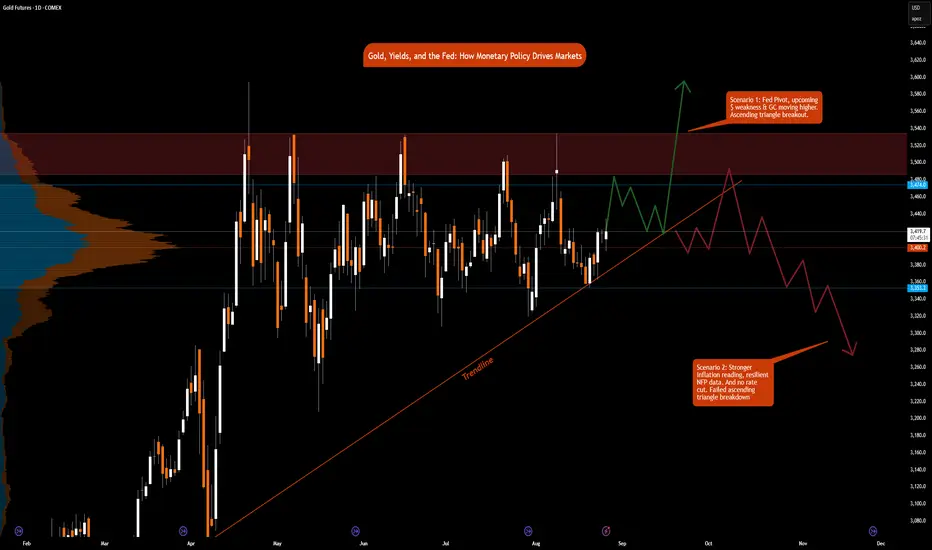
Gold, Yields, and the Fed: How Monetary Policy Drives Markets
Few forces shape global markets more than U.S. monetary policy. The Federal Reserve’s dual mandate, maximum employment and 2% inflation is the anchor for its decisions. For traders, understanding how these objectives translate into interest rate changes is critical for positioning in gold futures and across the yield curve.
The Fed’s Dual Mandate
1. Maximum Employment: Support jobs and minimize unemployment.
2. Stable Prices (2% inflation target): Prevent runaway inflation or deflation.
The Fed balances these goals using interest rates:
• Raising rates: Cools demand, strengthens the dollar, lifts yield, weighs on gold.
• Cutting rates: Stimulates demand, weakens the dollar, lowers real yields, supports gold.
The tension lies in the trade-off: controlling inflation often hurts employment, while boosting employment risks higher inflation.
Gold and Monetary Policy
Gold is highly sensitive to real interest rates (nominal yields minus inflation):
• Hawkish Fed: Higher real yields, dollar strength, gold struggles.
• Dovish Fed: Lower real yields, weaker dollar, gold rallies.
However, given the recent surge in gold prices despite higher rates, traders must ask:
• Will gold continue rising as odds of rate cuts increase, and when they are eventually delivered?
• Is the traditional correlation between the dollar and gold futures prices breaking down?
Gold’s rally has also been driven by geopolitical tensions and rising long term yields, reflecting rising debt burdens across the globe.
Yield Curve and Monetary Policy
The yield curve reflects expectations about growth, inflation, and Fed policy.
• Short end (1M–5Y): Anchored by Fed policy rates. If markets expect hikes/cuts, the front end moves first.
• Long end (10Y–30Y): Driven by expectations for long-term inflation, growth, and Treasury supply/demand dynamics.
Typically, investors and market participants watch for the following patterns:
• Inverted curve: Short yields > long yields, often a recession signal. See last year’s yield curve.
• Steepening curve: Usually follows Fed cuts, as front-end yields drop faster than the back end.
Two Classic Scenarios
Scenario 1: Inflation Stays High, Jobs Weaken
• Fed resists cutting, prioritizing price stability.
• Gold: Consolidates or weakens (real yields elevated).
• Yield curve: While the short end stays pinned, long end could rise on higher inflation risk and increasing debt worries, signaling stagflation risk.
Scenario 2: Inflation Stabilizes, Jobs Weaken
• Fed pivots dovish, prioritizing employment.
• Gold: Breaks higher on falling real yields.
• Yield curve: Steepens as short yields fall faster than long yields.
The Policy Backdrop
Powell’s last symposium before his term ends, at the Jackson Hole appearance, Fed Chair Powell delivered a dovish pivot, highlighting rising risks to the labor market while downplaying the inflationary effects of tariffs. The reasoning behind this shift deserves its own deep dive, but for now, our focus remains squarely on how monetary policy, specifically interest rate decisions, impacts inflation, growth, supply, and demand in the U.S. economy.
What’s on the Docket Until the Next Fed Meeting (September 17, 2025)
Markets will be glued to data in the coming weeks:
• Aug PCE / Core PCE (Aug 28–29) → Fed’s preferred inflation gauge.
• Aug NFP (Sep 5) → Labor market health; weak print strengthens the case for cuts.
• Aug PPI (Sep 10) → Upstream price pressures; hot numbers signal inflation risks.
• Aug CPI & Core CPI (Sep 11) → Key headline data; softer print supports dovish case.
• Fed Decision (Sep 17) → Will Powell stress inflation vigilance, or shift toward labor concerns?
How the Charts Tie It Together
• Gold Futures:
o Ascending Triangle breakout above resistance towards $3,600, if Fed pivots dovish and deliver a rate cut or a bigger rate cut.
o Ascending Triangle breakdown toward $3,350 if inflation remains sticky and the Fed holds. In this scenario, gold remains in balance overall.
• Yield Curve:
o Short end reacts directly to Fed rate expectations.
o Long end reflects investor conviction on inflation, growth and increasing debt concerns.
Takeaway for Traders
The Fed’s dual mandate creates a constant push and pull between inflation control and employment support. Gold and the yield curve are two of the clearest real-time mirrors of that balancing act:
• Watch short-term yields and gold to gauge how markets are pricing the Fed’s next move.
• Watch the long end of the curve to see whether investors believe inflation is truly anchored.
By linking economic data → Fed mandate → asset price response, traders gain a roadmap that works not just for this Fed meeting, but for every one that follows.
In our next educational blog we will briefly explore other policy tools used by the Fed i.e., QE and QT. Quantitative Easing and Quantitative Tightening.
FRED:FEDFUNDS ECONOMICS:USINTR
CME_MINI:ES1! CME_MINI:MNQ1! CME_MINI:NQ1! COMEX:GC1! MCX:GOLD1!
CBOT:ZB1! CBOT:ZN1!
Learning
ESG Investing in Global MarketsChapter 1: Understanding ESG Investing
1.1 Definition of ESG
Environmental (E): Concerns around climate change, carbon emissions, renewable energy adoption, water usage, biodiversity, pollution control, and sustainable resource management.
Social (S): Focuses on human rights, labor practices, workplace diversity, employee well-being, community engagement, customer protection, and social equity.
Governance (G): Relates to corporate governance structures, board independence, executive pay, transparency, ethics, shareholder rights, and anti-corruption measures.
Together, these dimensions create a holistic lens for evaluating companies beyond financial metrics, helping investors identify long-term risks and opportunities.
1.2 Evolution of ESG
1960s-1970s: Emergence of ethical investing linked to religious and social movements, e.g., opposition to apartheid or tobacco.
1990s: Rise of Socially Responsible Investing (SRI), focusing on excluding “sin stocks” (alcohol, gambling, weapons).
2000s: The United Nations launched the Principles for Responsible Investment (PRI) in 2006, formally embedding ESG into mainstream finance.
2010s onwards: ESG investing surged amid global concerns over climate change, social inequality, and corporate scandals.
1.3 Why ESG Matters
Risk Management: Companies ignoring ESG risks (e.g., climate lawsuits, governance failures) face financial penalties.
Long-Term Returns: Studies show firms with strong ESG practices often outperform peers over the long run.
Investor Demand: Millennials and Gen Z increasingly prefer ESG-aligned investments.
Regulatory Push: Governments worldwide are mandating ESG disclosures and carbon neutrality goals.
Chapter 2: ESG Investing Strategies
Investors adopt multiple approaches to integrate ESG factors:
Negative/Exclusionary Screening – Avoiding industries such as tobacco, coal, or controversial weapons.
Positive/Best-in-Class Screening – Selecting companies with superior ESG scores relative to peers.
Thematic Investing – Focusing on ESG themes like renewable energy, clean water, or gender diversity.
Impact Investing – Investing to generate measurable social and environmental outcomes alongside returns.
Active Ownership/Stewardship – Using shareholder influence to push for ESG improvements in companies.
ESG Integration – Embedding ESG considerations directly into financial analysis and valuation.
Chapter 3: ESG in Global Markets
3.1 North America
The U.S. has seen rapid growth in ESG funds, though political debates around ESG (especially in energy-heavy states) have created polarization.
Major asset managers like BlackRock, Vanguard, and State Street integrate ESG into products.
Regulatory frameworks (SEC climate disclosure proposals) are shaping ESG reporting.
3.2 Europe
Europe leads globally in ESG adoption, with strong regulatory support such as the EU Sustainable Finance Disclosure Regulation (SFDR) and the EU Taxonomy.
Scandinavian countries (Norway, Sweden, Denmark) are pioneers in sustainable finance, often divesting from fossil fuels.
ESG ETFs and green bonds dominate European sustainable investment flows.
3.3 Asia-Pacific
Japan’s Government Pension Investment Fund (GPIF), one of the world’s largest, actively invests in ESG indices.
China is promoting green finance under its carbon neutrality by 2060 pledge, but faces challenges in standardization and transparency.
India is witnessing growth in ESG mutual funds, driven by SEBI (Securities and Exchange Board of India) regulations and corporate sustainability goals.
3.4 Emerging Markets
ESG in emerging markets is growing but uneven.
Investors face challenges such as limited disclosure, weaker governance, and political risks.
Nonetheless, ESG adoption is rising in markets like Brazil (Amazon deforestation issues), South Africa, and Southeast Asia.
Chapter 4: ESG Performance and Market Impact
4.1 Financial Returns
Research indicates ESG funds often perform competitively with, or even outperform, traditional funds. Key findings include:
ESG funds are more resilient during downturns (e.g., COVID-19 crisis).
Companies with high ESG ratings often enjoy lower cost of capital.
4.2 Green Bonds and Sustainable Finance
Green Bonds have grown into a $2 trillion+ market globally, financing renewable energy, clean transport, and sustainable infrastructure.
Other innovations include sustainability-linked loans and social bonds.
4.3 Corporate Transformation
ESG pressure has driven oil majors (e.g., Shell, BP) to diversify into renewables.
Tech firms (e.g., Apple, Microsoft) are committing to carbon neutrality.
Banks and insurers are phasing out financing for coal projects.
Chapter 5: Challenges in ESG Investing
Despite growth, ESG investing faces several obstacles:
Lack of Standardization: Different ESG rating agencies use varied methodologies, creating inconsistency.
Greenwashing: Some firms exaggerate ESG credentials to attract investors without real impact.
Data Gaps: In emerging markets, ESG disclosures are limited or unreliable.
Short-Termism: Many investors still prioritize quarterly returns over long-term ESG impact.
Political Backlash: ESG has become politicized, particularly in the U.S., leading to regulatory tensions.
Chapter 6: Case Studies
6.1 Tesla – A Controversial ESG Icon
Tesla is often seen as a leader in clean technology due to its role in electric mobility. However, concerns about labor practices, governance issues, and supply chain risks (e.g., cobalt mining) complicate its ESG profile.
6.2 BP & Energy Transition
After the 2010 Deepwater Horizon disaster, BP rebranded itself as a greener energy company, investing heavily in renewables. This illustrates how ESG pressure can push legacy firms toward transformation.
6.3 Unilever – Social & Environmental Responsibility
Unilever integrates ESG principles deeply into its operations, focusing on sustainable sourcing, waste reduction, and social equity, earning strong support from ESG investors.
Chapter 7: Regulatory and Institutional Landscape
UN PRI: Global standard promoting ESG integration.
TCFD (Task Force on Climate-Related Financial Disclosures): Encourages climate risk reporting.
IFRS & ISSB (International Sustainability Standards Board): Working on global ESG reporting frameworks.
National Regulations:
U.S. SEC climate disclosures.
EU SFDR & EU Taxonomy.
India’s Business Responsibility and Sustainability Report (BRSR).
Chapter 8: Future of ESG Investing
The future of ESG investing is shaped by megatrends:
Climate Transition: Net-zero commitments will drive massive capital flows into clean energy, green tech, and sustainable infrastructure.
Technology & Data: AI, big data, and blockchain will improve ESG measurement, reducing greenwashing.
Retail Investor Growth: ESG-focused ETFs and robo-advisors will make sustainable investing more accessible.
Integration with Corporate Strategy: ESG will move from a reporting exercise to a core business strategy.
Emerging Market Potential: Growth in Asia, Africa, and Latin America will define the next wave of ESG capital allocation.
Conclusion
ESG investing is no longer an optional strategy—it is becoming a main pillar of global finance. Investors, regulators, and corporations recognize that long-term economic prosperity is inseparable from sustainability, social responsibility, and sound governance. While challenges such as greenwashing, inconsistent standards, and political backlash persist, the momentum is undeniable.
As global challenges like climate change, inequality, and governance scandals intensify, ESG investing provides a roadmap for channeling capital toward solutions that create sustainable financial returns and a better world. In the next decade, ESG will not just influence markets—it will define them.

Global Private Equity Trends1. Introduction
Private equity (PE) has emerged as one of the most powerful forces in global finance. Over the last four decades, it has transformed from a niche investment strategy practiced by a handful of firms into a multi-trillion-dollar asset class that shapes industries, creates jobs, restructures companies, and influences the broader global economy.
The private equity model—raising capital from institutional investors, acquiring or investing in private companies, actively managing them, and ultimately exiting at a profit—has proven highly successful. Today, pension funds, sovereign wealth funds, university endowments, and family offices rely on private equity as a key component of their portfolios.
But the private equity industry is not static. It evolves in response to macroeconomic conditions, technological innovation, regulatory shifts, and investor demands. In recent years, global private equity trends have reflected both challenges—rising interest rates, geopolitical instability, inflation—and opportunities—digital transformation, ESG investing, and emerging market growth.
2. Historical Evolution of Private Equity
The origins of private equity date back to the mid-20th century. In the 1940s and 1950s, early venture capital firms in the U.S. funded technology startups and post-war industrial companies. The modern private equity boom began in the 1980s, with leveraged buyouts (LBOs) making headlines—most famously the $25 billion buyout of RJR Nabisco by KKR in 1989.
The 1990s saw PE expand into Europe and Asia, with institutional investors increasingly allocating capital. By the 2000s, private equity had become mainstream, with mega-funds raising tens of billions of dollars. The global financial crisis of 2008 slowed activity, but the industry rebounded strongly in the 2010s, fueled by low interest rates and abundant liquidity.
By the 2020s, private equity assets under management (AUM) exceeded $10 trillion, cementing its role as a dominant force in global finance.
3. The Global Scale of Private Equity
As of 2024, global private equity AUM is estimated to exceed $12 trillion, making it one of the fastest-growing segments of the alternative investment universe. North America remains the largest hub, followed by Europe and Asia-Pacific. However, new regions—such as the Middle East and Africa—are increasingly attracting investor interest.
Private equity firms vary in size, from global giants like Blackstone, KKR, Carlyle, and Apollo, to specialized boutique firms focused on specific sectors or geographies. This diversity contributes to a wide spectrum of investment strategies, from billion-dollar buyouts to small growth-capital investments.
4. Key Drivers of Private Equity Growth
Several forces underpin the rise of private equity:
Institutional Investor Demand: Pension funds and sovereign wealth funds allocate heavily to private equity for higher returns compared to public markets.
Low Public Market Returns: Sluggish equity markets push investors toward alternative assets.
Operational Value Creation: Unlike passive stockholders, PE firms actively manage portfolio companies, improving efficiency and profitability.
Globalization of Capital: Cross-border deals and global funds create opportunities beyond domestic markets.
Technological Innovation: PE firms increasingly invest in tech-driven companies and use data analytics to enhance decision-making.
5. Regional Trends in Private Equity
North America
The U.S. remains the largest and most mature private equity market.
Mega-funds dominate, but mid-market firms thrive in niche strategies.
Strong focus on technology, healthcare, and financial services.
Europe
Regulatory oversight is stronger, especially post-Brexit.
Countries like the U.K., Germany, and France are major PE hubs.
Infrastructure and ESG-driven deals are gaining traction.
Asia-Pacific
China and India are hotbeds of growth equity and venture deals.
Japan and South Korea are seeing more buyouts.
Sovereign wealth funds in Singapore and the Middle East play key roles as LPs.
Middle East & Africa
The Gulf states, especially Saudi Arabia and the UAE, are deploying sovereign wealth funds into global private equity.
Africa offers opportunities in infrastructure, fintech, and consumer markets, though risks remain high.
Latin America
Brazil and Mexico are leading PE markets.
Focus on energy, fintech, and consumer growth stories.
Political instability is a limiting factor.
6. Sectoral Trends in Private Equity
Technology
Cloud computing, cybersecurity, fintech, and AI startups attract significant PE capital.
Many PE firms are setting up tech-dedicated funds.
Healthcare
Aging populations and post-pandemic healthcare reforms drive investments.
Biotech, pharmaceuticals, and healthcare services are hotspots.
Infrastructure & Energy
Renewable energy projects are a major PE focus, especially in Europe and Asia.
Infrastructure funds targeting transport, logistics, and utilities are growing.
Consumer & Retail
PE firms are adapting to e-commerce-driven retail models.
Luxury brands and lifestyle companies remain attractive.
Financial Services
Fintech and digital banking are top priorities.
Insurance and asset management firms are also targets for buyouts.
7. Deal-Making Trends
Buyouts: Leveraged buyouts remain the backbone of PE, though high interest rates challenge traditional models.
Growth Equity: Rising interest in scaling innovative companies without full buyouts.
Venture Capital Convergence: Many PE firms are moving into late-stage venture deals.
Distressed & Special Situations: Economic uncertainty creates opportunities in restructuring and distressed debt.
Secondary Market Deals: The secondary market for PE fund stakes has grown into a $100+ billion segment.
8. Fundraising Dynamics
Mega-Funds vs. Mid-Market: Mega-funds raise over $20 billion each, while mid-market players thrive in niche areas.
Niche & Sector-Specific Funds: Focus on technology, ESG, healthcare, and infrastructure.
ESG & Impact Funds: Increasingly popular among institutional investors seeking responsible investing.
9. Exit Strategies
IPOs: Still attractive, though public market volatility poses challenges.
Strategic Sales: Corporations buying PE-backed firms remain a strong exit path.
Secondary Buyouts: Common in mature markets where PE firms sell to other PE players.
Recapitalizations: Partial exits allow firms to return capital while retaining ownership.
10. Role of Technology & Data in Private Equity
AI and machine learning enhance deal sourcing, due diligence, and risk assessment.
Big data analytics improve operational oversight of portfolio companies.
Digital transformation is now a value-creation strategy, not just a risk factor.
Conclusion
Private equity has grown into a cornerstone of global finance, shaping economies and industries. While challenges remain—rising interest rates, regulatory hurdles, and geopolitical risks—the long-term growth story of private equity remains intact. Its adaptability, global reach, and ability to create value beyond capital injection make it an enduring force.
Looking ahead, the industry will continue to evolve—becoming more technology-driven, more sustainability-focused, and more globally interconnected. For investors, entrepreneurs, and policymakers, understanding private equity trends is essential to navigating the future of finance.

Global Agricultural Commodities MarketWhat Are Agricultural Commodities?
Agricultural commodities are raw, unprocessed products grown or raised to be sold or exchanged. They fall broadly into two categories:
Food Commodities
Grains & cereals: Wheat, rice, maize, barley, oats.
Oilseeds: Soybeans, rapeseed, sunflower, groundnut.
Fruits & vegetables: Bananas, citrus, potatoes, onions.
Livestock & animal products: Beef, pork, poultry, dairy, eggs.
Tropical commodities: Coffee, cocoa, tea, sugar.
Non-Food Commodities
Fibers: Cotton, jute, wool.
Biofuel crops: Corn (ethanol), sugarcane (ethanol), palm oil, soy oil (biodiesel).
Industrial crops: Rubber, tobacco.
These commodities are traded on spot markets (immediate delivery) and futures markets (contracts for future delivery). Futures trading, which developed in places like Chicago and London, allows farmers and buyers to hedge against price fluctuations.
Historical Context of Agricultural Commodities Trade
Ancient Trade: The Silk Road and spice trade routes included agricultural goods like rice, spices, and tea. Grain storage and trade were central to the Roman Empire and ancient Egypt.
Colonial Era: European colonial powers built empires around commodities like sugar, cotton, tobacco, and coffee.
20th Century: Mechanization, the Green Revolution, and globalization expanded agricultural production and trade.
21st Century: Digital platforms, biotechnology, and sustainability initiatives shape modern agricultural commodity markets.
This long history shows how agriculture is not just economic, but political and cultural.
Key Players in the Global Agricultural Commodities Market
Producers (Farmers & Agribusinesses): Smallholder farmers in Asia and Africa; large-scale industrial farms in the U.S., Brazil, and Australia.
Traders & Merchants: Multinational corporations known as the ABCD companies—Archer Daniels Midland (ADM), Bunge, Cargill, and Louis Dreyfus—dominate global grain and oilseed trade.
Governments & Agencies: World Trade Organization (WTO), Food and Agriculture Organization (FAO), national agricultural boards.
Financial Institutions & Exchanges: Chicago Board of Trade (CBOT), Intercontinental Exchange (ICE), and hedge funds/speculators who trade futures.
Consumers & Industries: Food processing companies, retailers, biofuel producers, and ultimately, households.
Major Agricultural Commodities and Their Markets
1. Cereals & Grains
Wheat: Staple for bread and pasta, major producers include Russia, the U.S., Canada, and India.
Rice: Lifeline for Asia; grown largely in China, India, Thailand, and Vietnam.
Corn (Maize): Used for food, feed, and ethanol; U.S. and Brazil dominate exports.
2. Oilseeds & Oils
Soybeans: Key protein for animal feed; U.S., Brazil, and Argentina lead.
Palm Oil: Major in Indonesia and Malaysia; used in food and cosmetics.
Sunflower & Rapeseed Oil: Important in Europe, Ukraine, and Russia.
3. Tropical Commodities
Coffee: Produced mainly in Brazil, Vietnam, Colombia, and Ethiopia.
Cocoa: Critical for chocolate; grown in West Africa (Ivory Coast, Ghana).
Sugar: Brazil, India, and Thailand dominate.
4. Livestock & Dairy
Beef & Pork: U.S., Brazil, China, and EU major players.
Poultry: Fastest-growing meat sector, strong in U.S. and Southeast Asia.
Dairy: New Zealand, EU, and India lead in milk and milk powder exports.
5. Fibers & Industrial Crops
Cotton: Vital for textiles; India, U.S., and China are leading producers.
Rubber: Largely grown in Southeast Asia for tires and industrial use.
Factors Influencing Agricultural Commodity Markets
Weather & Climate: Droughts, floods, hurricanes, and heatwaves strongly affect supply.
Technology: Mechanization, biotechnology (GM crops), digital farming, and precision agriculture boost productivity.
Geopolitics: Wars, sanctions, and trade disputes disrupt supply chains (e.g., Russia-Ukraine war and wheat exports).
Currency Fluctuations: Commodities are priced in USD; exchange rates impact competitiveness.
Government Policies: Subsidies, tariffs, price supports, and export bans affect markets.
Consumer Demand: Rising demand for protein, organic food, and biofuels shapes production.
Speculation: Futures and derivatives markets amplify price volatility.
Supply Chain of Agricultural Commodities
Production (Farmers).
Collection (Local traders & cooperatives).
Processing (Milling, crushing, refining).
Storage & Transportation (Warehouses, silos, shipping lines).
Trading & Export (Grain merchants, commodity exchanges).
Retail & Consumption (Supermarkets, restaurants, households).
The supply chain is global—soybeans grown in Brazil may feed livestock in China, which supplies meat to Europe.
Global Trade in Agricultural Commodities
Top Exporters: U.S., Brazil, Argentina, Canada, EU, Australia.
Top Importers: China, India, Japan, Middle East, North Africa.
Trade Routes: Panama Canal, Suez Canal, Black Sea, and major ports like Rotterdam, Shanghai, and New Orleans.
Agricultural trade is often uneven—developed nations dominate exports, while developing nations rely heavily on imports.
Price Volatility in Agricultural Commodities
Agricultural commodities are highly volatile due to:
Seasonal cycles of planting and harvest.
Weather shocks (El Niño, La Niña).
Energy prices (fertilizers, transport).
Speculative trading on futures markets.
Volatility impacts both farmers’ incomes and consumers’ food security.
Role of Futures and Derivatives Markets
Commodity exchanges such as CBOT (Chicago), ICE (New York), and NCDEX (India) allow:
Hedging: Farmers and buyers reduce risk by locking in prices.
Speculation: Traders bet on price movements, adding liquidity but also volatility.
Price Discovery: Futures prices signal supply-demand trends.
Challenges Facing the Global Agricultural Commodities Market
Climate Change: Increased droughts, floods, and pests reduce yields.
Food Security: Rising global population (10 billion by 2050) requires 50% more food production.
Trade Wars & Protectionism: Export bans (e.g., rice from India, wheat from Russia) destabilize markets.
Sustainability: Deforestation for soy and palm oil, pesticide use, and water scarcity are major concerns.
Market Power Concentration: Few large corporations dominate, raising fairness concerns.
Infrastructure Gaps: Poor roads, ports, and storage in developing nations lead to waste.
Future Trends in Agricultural Commodities Market
Sustainability & ESG: Demand for eco-friendly, deforestation-free, and fair-trade commodities.
Digitalization: Blockchain for traceability, AI for crop forecasting, precision farming.
Biofuels & Renewable Energy: Growing role of corn, sugarcane, and soy in energy transition.
Alternative Proteins: Lab-grown meat, plant-based proteins reducing demand for livestock feed.
Regional Shifts: Africa emerging as a key producer and consumer market.
Climate-Resilient Crops: GM crops resistant to drought, pests, and diseases.
Case Studies
Russia-Ukraine War (2022–2025): Disrupted global wheat, corn, and sunflower oil supply, driving food inflation.
COVID-19 Pandemic (2020): Supply chain breakdowns exposed vulnerabilities in agricultural trade.
Palm Oil in Indonesia: Tensions between economic growth and environmental concerns over deforestation.
Conclusion
The global agricultural commodities market is one of the most important pillars of the world economy. It determines food security, influences geopolitics, and drives livelihoods for billions of farmers. However, it is also one of the most vulnerable markets—shaped by climate change, population growth, technological advances, and political instability.
In the future, balancing food security, sustainability, and fair trade will be the central challenge. With the right policies, innovation, and cooperation, agricultural commodity markets can continue to feed the world while protecting the planet.

Global Supply Chain Challenges1. Complexity and Interdependence
One of the biggest challenges of global supply chains is their complexity. Unlike traditional domestic supply chains where most processes are localized, global supply chains involve:
Multiple countries producing different components.
Long transportation routes across oceans and continents.
Coordination among suppliers, manufacturers, warehouses, and retailers.
Dependence on international trade regulations and customs.
For instance, a single smartphone may include rare earth minerals from Africa, semiconductors from Taiwan, assembly in China, and distribution worldwide. If one link fails—say, a port strike in the U.S. or a political dispute in Asia—the entire chain suffers delays and shortages.
This high interdependence means companies cannot operate in isolation. A disruption in one country cascades globally, making supply chain resilience a top concern for businesses.
2. Geopolitical Risks
Geopolitical tensions have always influenced global trade, but recent years have seen an escalation in conflicts that directly impact supply chains:
Trade Wars: The U.S.-China trade war led to tariffs on hundreds of billions worth of goods, forcing companies to rethink their sourcing strategies.
Sanctions and Restrictions: Sanctions on countries like Russia and Iran disrupt the supply of vital energy resources and raw materials.
Conflicts and Wars: The Russia-Ukraine war has severely disrupted grain and energy supplies, causing ripple effects worldwide.
Rising Nationalism: Many countries are moving toward “protectionism,” encouraging local manufacturing instead of relying on imports.
These risks make global supply chains unpredictable. Companies are increasingly exploring China+1 strategies (diversifying production beyond China) and regional supply chain models to reduce exposure.
3. Transportation and Logistics Bottlenecks
The efficient movement of goods is critical for supply chains, but several issues plague the global logistics industry:
Port Congestion: Major ports such as Los Angeles, Shanghai, and Rotterdam often face severe backlogs, delaying shipments for weeks.
Container Shortages: The COVID-19 pandemic revealed imbalances in container availability, as containers got stuck in regions with low exports.
Rising Freight Costs: Shipping costs have skyrocketed in recent years, sometimes increasing fivefold, which directly affects product pricing.
Infrastructure Limitations: Developing countries often lack efficient road, rail, and port infrastructure, adding delays.
Disruptions in Key Routes: Blockages like the 2021 Suez Canal crisis showed how a single incident can paralyze global trade.
Logistics providers are adopting digital tracking, automation, and AI-driven route optimization to address these challenges, but the issues remain significant.
4. Climate Change and Natural Disasters
Climate change has emerged as a critical threat to supply chain stability. Extreme weather events disrupt production, transportation, and distribution. Examples include:
Flooding in Thailand (2011) that severely impacted global electronics and automotive supply chains.
Hurricanes in the U.S. causing oil refinery shutdowns and fuel shortages.
Wildfires in Australia and California disrupting agricultural production.
Moreover, climate change brings regulatory challenges. Many countries are now implementing carbon border taxes, demanding cleaner supply chains. Companies must invest in sustainability—using renewable energy, reducing emissions, and adopting circular economy models—while still managing costs.
5. Pandemics and Health Crises
The COVID-19 pandemic exposed the fragility of global supply chains like never before. Lockdowns, labor shortages, and border closures created massive disruptions:
Factories shut down, halting production of critical goods.
Global demand patterns shifted (e.g., rise in demand for PPE and semiconductors).
Transportation capacity was severely limited.
Panic buying and hoarding caused shortages of essentials.
Even post-pandemic, supply chains continue to struggle with aftershocks—semiconductor shortages, rising e-commerce demand, and workforce restructuring. This has led companies to explore resilient supply chain models focusing on agility, redundancy, and digital monitoring.
6. Labor and Workforce Challenges
Global supply chains rely heavily on human labor at every stage—manufacturing, warehousing, shipping, and retail. However, several issues create challenges:
Labor Shortages: Many industries, particularly trucking and shipping, face chronic labor shortages.
Poor Working Conditions: Sweatshops, low wages, and unsafe working environments create ethical concerns.
Union Strikes: Port worker or factory strikes can halt production for weeks.
Skill Gaps: The shift to digital technologies requires skilled workers in areas like data analytics and AI, but there is a global shortage of such talent.
Companies must invest in workforce development, automation, and fair labor practices to ensure long-term stability.
7. Supply Chain Visibility and Transparency
One of the toughest challenges is the lack of visibility across complex supply chains. Many companies only know their first-tier suppliers but have little knowledge of second- or third-tier suppliers. This lack of transparency creates risks in:
Identifying bottlenecks.
Ensuring compliance with regulations.
Tracking unethical practices such as forced labor or environmental harm.
Digital technologies like blockchain, IoT sensors, and AI analytics are increasingly being used to improve visibility and traceability. However, implementing these systems across global networks is expensive and time-consuming.
8. Cybersecurity Risks
As supply chains become digitized, they are also exposed to cyber threats. Cyberattacks on logistics firms, shipping companies, and manufacturers can cripple operations. For example:
The Maersk cyberattack (2017) disrupted global shipping for weeks.
Ransomware attacks on manufacturing plants caused production halts.
Data breaches expose sensitive supplier and customer information.
Securing global supply chains requires strong cybersecurity protocols, international cooperation, and investment in resilient IT systems.
9. Regulatory and Compliance Challenges
Operating across multiple countries means companies must navigate a complex web of laws and regulations:
Customs Regulations: Varying import-export rules increase costs and delays.
Environmental Laws: Stricter sustainability standards demand cleaner processes.
Product Standards: Different countries have different quality and safety requirements.
Data Protection Laws: With digital trade, compliance with laws like GDPR adds complexity.
Failure to comply can result in fines, reputational damage, and disrupted operations.
10. Rising Costs and Inflation
Another major challenge is the rising cost of operating global supply chains:
Raw Materials: Prices of commodities such as oil, metals, and agricultural products fluctuate widely.
Transportation: Higher fuel costs and freight rates directly impact profitability.
Labor Costs: Wages are rising in traditional manufacturing hubs like China, pushing companies to explore alternatives such as Vietnam and India.
Inflation: Global inflation reduces consumer demand, making supply chains less predictable.
Companies are balancing cost efficiency with resilience—sometimes choosing more expensive but reliable regional sourcing models.
Conclusion
Global supply chains are both the strength and vulnerability of the modern economy. While they enable efficiency, affordability, and innovation, they are also highly exposed to risks—geopolitical, environmental, technological, and social. The challenges are vast and interconnected, meaning solutions require not just corporate strategies but also international cooperation, regulatory reforms, and technological innovation.
In the coming decades, the most successful supply chains will be those that balance cost, resilience, and sustainability. They will not just deliver products efficiently but also adapt quickly to disruptions, respect environmental standards, and uphold ethical values. The challenges are immense, but they also offer opportunities to build stronger, smarter, and more sustainable global supply networks.

MARKET HOLDING SUPPORT-CAN BULLS BREAK 4,700RESISTANCEhi trader's
The market is currently holding near the support area of 4,250 – 4,350, showing signs of accumulation after a recent downtrend. This zone is acting as a base for a possible bullish move.
First Support (4,350): Price already tested and respected this level, showing strength from buyers.
Second Support (4,250): If the market dips further, this will be the next key area to watch for a bounce.
Risk Level (4,060): Below this level, bullish momentum weakens, so traders must stay cautious.
Resistance (4,700): If the price breaks above this barrier, a strong upward push toward the supply zone is likely.
Supply Zone (4,900): This is the main target area where sellers may re-enter the market.
👉 Based on the structure, if the market holds above support levels and breaks 4,700 resistance, there is potential for a move toward 4,900. However, if the market breaks below 4,060, then further downside risk opens
Do you think buyers have enough momentum to break the 4,700 resistance and push toward 4,900 supply zone?”
For more safe chart updates and learning-based signals, you can follow my profile and stay updated with fresh analysis

Role of Shipping & Freight in Global TradeIntroduction
Global trade has been the backbone of the world economy for centuries. The movement of goods across oceans, rivers, and seas has connected civilizations, created wealth, and shaped the geopolitical map. At the center of this massive global exchange lies shipping and freight, the lifelines of international commerce. Without ships transporting raw materials, energy resources, manufactured products, and food across continents, global trade as we know it would come to a standstill.
Today, over 80–90% of world trade by volume and more than 70% by value is carried by sea, according to the International Maritime Organization (IMO). From crude oil tankers supplying energy to container ships delivering electronics, shipping and freight play a pivotal role in ensuring the smooth functioning of supply chains, sustaining industries, and providing consumers worldwide with affordable products.
This essay explores in detail the role of shipping and freight in global trade, its historical evolution, types of shipping services, economic importance, technological advances, environmental challenges, and its future in an interconnected world.
1. Historical Evolution of Shipping in Global Trade
Shipping has been central to human civilization for thousands of years.
a) Ancient Maritime Trade
Phoenicians, Egyptians, Greeks, and Romans used ships to transport goods such as spices, silk, grain, and metals.
Maritime routes like the Mediterranean Sea network and the Indian Ocean trade linked Asia, Africa, and Europe.
The Silk Road by sea connected China with the Middle East and Europe, making maritime trade faster and safer than land routes.
b) Age of Exploration (15th–17th Century)
European powers such as Spain, Portugal, Britain, and the Netherlands developed large fleets to explore and colonize.
Ships carried gold, silver, spices, tea, and slaves, fueling the rise of global empires.
The development of naval power became closely tied to control of trade routes.
c) Industrial Revolution and Modern Shipping
Steamships in the 19th century replaced sailboats, reducing travel time dramatically.
The Suez Canal (1869) and Panama Canal (1914) reshaped global shipping routes, cutting distances between major trade centers.
The 20th century brought containerization (1950s), revolutionizing freight with standardized containers, reducing costs, and enabling modern supply chains.
Shipping thus evolved from simple wooden boats to highly sophisticated mega-ships, forming the backbone of globalization.
2. Types of Shipping & Freight in Global Trade
Shipping today is diverse, with specialized vessels designed to handle different types of cargo.
a) Container Shipping
Most manufactured goods (electronics, clothing, furniture, machinery) are moved in standardized 20-foot and 40-foot containers.
Containerization allows goods to be easily transferred between ships, trucks, and trains.
Major shipping companies like Maersk, MSC, and CMA CGM dominate global container shipping.
b) Bulk Shipping
Dry bulk carriers transport raw materials like coal, iron ore, grain, and fertilizers.
Liquid bulk carriers (tankers) carry oil, LNG (liquefied natural gas), and chemicals.
These ships are vital for energy supply and industrial production.
c) Roll-on/Roll-off (Ro-Ro) Shipping
Used for transporting vehicles, trucks, heavy machinery.
Cars are driven directly onto the ship and off at the destination port.
d) Specialized Freight
Refrigerated ships (reefers) carry perishable goods like fruits, seafood, dairy, and medicines.
Heavy-lift ships transport oversized cargo like wind turbines, oil rigs, and infrastructure equipment.
e) Air Freight vs. Sea Freight
While air freight is faster, it is significantly more expensive.
Sea freight remains the preferred mode for large volumes, bulk cargo, and cost-sensitive goods.
3. Economic Role of Shipping & Freight in Global Trade
Shipping is not just a transport service—it is the foundation of global commerce.
a) Enabler of Globalization
Shipping allows countries to specialize in production, exporting surplus and importing what they lack.
For example, Middle Eastern countries export oil, China exports manufactured goods, and Brazil exports soybeans.
b) Cost-Effective Transportation
Shipping is the cheapest mode of long-distance transport.
Large vessels reduce per-unit transport costs, making global products affordable for consumers.
c) Contribution to Global GDP
The shipping industry contributes over $500 billion annually to global GDP.
Ports, logistics, shipbuilding, and freight services generate millions of jobs worldwide.
d) Strategic Importance
Control over sea lanes translates into geopolitical power.
Disruptions like the Suez Canal blockage (2021) showed how dependent global trade is on maritime routes.
4. Supply Chains & Just-in-Time Trade
Modern trade relies on complex supply chains. Shipping and freight are central to this system.
Just-in-Time (JIT) manufacturing depends on timely delivery of parts from across the world.
Delays in shipping (like during COVID-19) disrupted industries from automobiles to electronics.
Shipping enables global value chains, where production is fragmented across countries.
For example:
iPhones are designed in the U.S., assembled in China, with parts sourced from Japan, Korea, and Germany—made possible by efficient shipping networks.
5. Ports as Trade Hubs
Shipping relies on ports, which act as gateways for trade.
a) Major Global Ports
Shanghai, Singapore, Rotterdam, Dubai, Los Angeles are key global hubs.
Ports provide warehousing, customs clearance, refueling, and transshipment services.
b) Port Infrastructure
Modern ports have automated cranes, container terminals, cold storage, and logistics zones.
Efficient ports reduce turnaround time and lower trade costs.
c) Strategic Chokepoints
The Strait of Hormuz, Strait of Malacca, and Panama Canal are crucial for global shipping.
Blockage or conflict in these areas can disrupt world trade.
6. Challenges Facing Shipping & Freight
While shipping is vital, it faces multiple challenges.
a) Environmental Concerns
Shipping contributes nearly 3% of global CO₂ emissions.
Oil spills, ballast water pollution, and marine waste threaten ecosystems.
b) Piracy & Security
Piracy in the Horn of Africa and South China Sea remains a threat.
Naval patrols and international cooperation are required to safeguard sea lanes.
c) Geopolitical Tensions
Trade wars, sanctions, and conflicts disrupt shipping flows.
Example: Russia-Ukraine war affected grain shipments and energy supplies.
d) Capacity & Congestion
Global ports often face congestion, leading to delays and higher freight rates.
Shortages of containers during COVID-19 caused shipping prices to skyrocket.
e) Rising Costs
Fuel costs (bunker oil), insurance, and regulatory compliance increase freight costs.
7. Technological Innovations in Shipping
Technology is reshaping global shipping.
a) Digitalization
Blockchain and electronic bills of lading improve transparency.
AI and big data optimize routes and reduce delays.
b) Automation & Smart Ports
Automated cranes and digital tracking reduce labor costs.
Smart ports use IoT sensors for efficiency.
c) Green Shipping
LNG-powered ships, hybrid engines, and wind-assisted propulsion reduce emissions.
IMO aims to cut shipping emissions by 50% by 2050.
d) Autonomous Ships
Trials of crewless vessels are underway.
Remote-controlled ships may lower costs and improve safety.
8. Case Studies of Shipping in Global Trade
a) Suez Canal Blockage (2021)
The container ship Ever Given blocked the canal for 6 days.
Delayed $10 billion worth of trade per day.
Highlighted vulnerability of global supply chains.
b) COVID-19 Pandemic
Container shortages, port closures, and demand fluctuations disrupted trade.
Freight rates rose by 4–5 times.
Accelerated digital adoption in shipping.
c) China’s Belt & Road Initiative (BRI)
Development of new ports and maritime routes strengthens global connectivity.
Creates both opportunities and geopolitical tensions.
9. Future of Shipping & Freight in Global Trade
Shipping will remain central to trade, but its role will evolve.
a) Sustainability & Green Transition
Pressure to reduce carbon footprint will drive innovation.
Hydrogen, ammonia, and biofuels may replace conventional fuels.
b) Geopolitical Realignment
Emerging trade corridors (like Arctic routes) will alter global shipping patterns.
Nations will compete to control key ports and sea lanes.
c) Integration with Digital Economy
E-commerce growth demands faster, reliable shipping.
Real-time tracking and AI-driven logistics will dominate.
d) Increased Regionalization
Companies may shorten supply chains to reduce dependency on long-distance shipping.
Yet, maritime trade will remain irreplaceable for bulk goods.
Conclusion
The role of shipping and freight in global trade cannot be overstated. From ancient maritime exchanges to today’s interconnected world economy, ships have carried the raw materials, energy, and finished goods that power industries and sustain societies. Shipping ensures global availability of resources, low-cost consumer goods, and functioning supply chains.
At the same time, shipping faces challenges such as environmental sustainability, geopolitical tensions, and technological disruption. However, with continued innovation, regulatory support, and international cooperation, shipping will remain the lifeline of global trade for decades to come.
As the world moves toward greener, smarter, and more resilient trade systems, the shipping industry will continue to be the bridge between nations, economies, and people, cementing its place as the true engine of globalization.
Impact of Trade Wars on Global CommoditiesUnderstanding Trade Wars
Definition
A trade war occurs when countries engage in escalating retaliatory trade barriers, such as tariffs (taxes on imports), export bans, or quotas. Unlike routine trade disputes resolved through institutions like the World Trade Organization (WTO), trade wars are prolonged confrontations that can severely disrupt global supply chains.
Causes of Trade Wars
Protection of domestic industries – Governments impose tariffs to shield local producers from cheaper foreign imports.
Geopolitical tensions – Strategic rivalry between powers (e.g., U.S.–China).
Perceived unfair trade practices – Accusations of currency manipulation, dumping, or intellectual property theft.
Political populism – Leaders appeal to domestic audiences by promising to revive manufacturing or agriculture.
Mechanisms of Impact
Trade wars affect commodities through:
Tariffs: Increasing the cost of imports reduces demand.
Supply chain disruptions: Restrictions create shortages or gluts in certain markets.
Currency fluctuations: Retaliatory measures often cause volatility in exchange rates.
Investor sentiment: Commodities markets react to uncertainty with price swings.
Historical Trade Wars and Commodities Impact
The U.S.–China Trade War (2018–2020)
The most notable recent example is the U.S.–China trade war, where both nations imposed tariffs on billions of dollars’ worth of goods. Its impact on commodities was profound:
Agricultural Products: China, a major buyer of U.S. soybeans, shifted its purchases to Brazil and Argentina. U.S. farmers faced significant losses, while South American exporters gained.
Metals: U.S. tariffs on Chinese steel and aluminum disrupted global metals supply, increasing costs for downstream industries.
Oil and Gas: China reduced imports of U.S. crude oil, turning to Russia and the Middle East instead.
1970s Oil Crisis and Resource Nationalism
While not a conventional “trade war,” the OPEC oil embargo of 1973 illustrates how commodity trade restrictions can destabilize global markets. By restricting oil exports, OPEC caused a dramatic rise in crude oil prices, triggering global inflation and recessions.
Japan–U.S. Trade Disputes (1980s–1990s)
The U.S. imposed restrictions on Japanese automobiles, semiconductors, and steel. While not as aggressive as the China case, it influenced global steel and automotive commodity supply chains.
Impact on Different Commodities
1. Agricultural Commodities
Trade wars hit agriculture hardest because food products are politically sensitive and heavily traded.
Soybeans: In the U.S.–China conflict, soybean exports from the U.S. plummeted by over 50% in 2018. Brazil emerged as the biggest beneficiary.
Wheat and Corn: Farmers faced surplus production when markets closed, leading to lower farm incomes.
Meat and Dairy: Tariffs on pork and beef reduced demand, leading to oversupply and lower domestic prices.
Key Point: Agricultural producers in exporting countries often lose, while rival exporters in neutral countries gain market share.
2. Energy Commodities
Energy is both a strategic and economic commodity. Trade wars disrupt supply chains and create uncertainty.
Crude Oil: During the U.S.–China dispute, China reduced U.S. crude imports. Instead, it boosted imports from Russia, reshaping global oil flows.
Liquefied Natural Gas (LNG): China, a top LNG importer, reduced its contracts with U.S. suppliers, affecting American energy exports.
Coal: Tariffs on coal imports can shift demand toward domestic suppliers, though with environmental consequences.
Result: Trade wars encourage diversification of energy suppliers, altering global energy geopolitics.
3. Metals and Minerals
Metals are essential inputs for manufacturing and construction. Tariffs in this sector ripple across industries.
Steel and Aluminum: U.S. tariffs in 2018 raised global prices temporarily, hurting consumers (e.g., automakers) but boosting U.S. domestic producers.
Copper: As a key industrial metal, copper prices fell due to weaker global demand expectations from trade wars.
Rare Earth Elements: China, controlling over 80% of rare earth supply, threatened export restrictions during tensions—causing panic in tech and defense industries.
Observation: Strategic metals become bargaining chips in geopolitical disputes.
4. Precious Metals
Gold, silver, and platinum group metals behave differently in trade wars:
Gold: Seen as a “safe haven,” gold prices typically rise during trade war uncertainty. Example: Gold surged during U.S.–China tensions.
Silver and Platinum: Both industrial and investment commodities, they experience mixed effects—falling demand from industries but rising investor interest.
Economic Consequences of Commodity Disruptions
For Producers
Loss of export markets (e.g., U.S. soybean farmers).
Price crashes in domestic markets due to oversupply.
Increased costs if reliant on imported raw materials.
For Consumers
Higher prices for finished goods (e.g., cars with more expensive steel).
Reduced availability of certain products.
Inflationary pressures in commodity-importing nations.
For Global Markets
Increased volatility in commodity exchanges (CME, LME).
Shifts in global trade flows, creating winners and losers.
Distortion of investment decisions in commodities futures markets.
Case Studies
Case Study 1: U.S. Soybean Farmers
When China imposed tariffs on U.S. soybeans, American farmers saw exports fall from $12 billion in 2017 to $3 billion in 2018. Despite government subsidies, many small farmers struggled. Brazil, however, expanded its exports to China, reshaping global agricultural trade.
Case Study 2: Steel Tariffs and the U.S. Auto Industry
The Trump administration’s tariffs on steel and aluminum in 2018 increased input costs for U.S. automakers. While domestic steel producers benefited, car manufacturers faced rising costs, reducing their global competitiveness.
Case Study 3: Rare Earths and Tech Industry
China’s threat to restrict rare earth exports during trade tensions with the U.S. in 2019 raised concerns for tech manufacturers, as rare earths are critical for smartphones, batteries, and defense equipment. Prices surged globally, forcing nations to seek alternative suppliers.
Long-Term Structural Shifts
Trade wars don’t just have short-term impacts; they reshape global commodity systems.
Diversification of Supply Chains
Importers diversify sources to reduce dependence on hostile nations. Example: China diversifying soybean imports beyond the U.S.
Rise of Regional Trade Blocs
Countries form regional agreements (e.g., RCEP, USMCA) to secure commodity flows.
Strategic Stockpiling
Nations build reserves of critical commodities (oil, rare earths, grains) to withstand disruptions.
Technological Substitution
Trade wars accelerate R&D in substitutes (e.g., battery technologies reducing dependence on cobalt).
Shift in Investment Flows
Investors prefer politically stable commodity suppliers, leading to long-term realignments.
Winners and Losers
Winners
Neutral exporting countries that capture lost market share (e.g., Brazil in soybeans).
Domestic producers shielded by tariffs (e.g., U.S. steel).
Investors in safe-haven commodities like gold.
Losers
Farmers and exporters in targeted nations.
Consumers facing higher prices.
Global growth, as uncertainty reduces trade volumes and investment.
Future Outlook
Increasing Commodities Nationalism
Countries may increasingly weaponize commodities as tools of leverage in geopolitical disputes.
Technology and Substitutes
Trade wars may accelerate innovation, such as renewable energy reducing reliance on imported fossil fuels.
Institutional Reforms
The WTO and other institutions may need reforms to mediate commodity-related disputes more effectively.
Climate Change Factor
As climate change reshapes commodity production (e.g., agriculture, water, energy), trade wars could worsen resource scarcity and volatility.
Conclusion
The impact of trade wars on global commodities is multi-dimensional and far-reaching. From agriculture to energy, metals to precious resources, trade disputes disrupt flows, distort prices, and realign global supply chains. While some nations or industries benefit temporarily, the broader effect is one of uncertainty, inefficiency, and economic loss.
In the long run, trade wars reshape the architecture of commodity markets—encouraging diversification, regionalism, and innovation. However, they also raise questions about the sustainability of globalization and the ability of international institutions to maintain stability in a fracturing world.
Ultimately, commodities—being the backbone of human survival and industrial growth—remain at the heart of trade wars. Understanding their dynamics is crucial not only for policymakers and businesses but also for ordinary citizens whose livelihoods are directly or indirectly tied to global trade.
Food Security & Global Market PricesIntroduction
Food is the most fundamental human need, yet in the 21st century, billions of people still struggle with hunger, malnutrition, and unstable food access. At the same time, global markets heavily influence the price and availability of food commodities such as wheat, rice, corn, soybeans, and edible oils. The link between food security and global market prices has become one of the defining challenges of our era.
Food security, as defined by the Food and Agriculture Organization (FAO), exists when all people, at all times, have physical, social, and economic access to sufficient, safe, and nutritious food to meet their dietary needs and food preferences for an active and healthy life. Achieving this requires stability in production, affordability of prices, resilience against shocks, and equitable distribution.
Global market prices, meanwhile, are shaped by international trade, supply-demand balances, speculation in commodity markets, climate events, geopolitical conflicts, and policy decisions such as subsidies or export bans. When prices spike, food insecurity rises—especially in poorer countries where households spend a large share of their income on food.
This essay explores the intricate relationship between food security and global market prices, examining causes, consequences, and policy responses.
Section 1: Understanding Food Security
Food security rests on four pillars:
Availability – Adequate supply of food from domestic production or imports.
Access – Economic and physical access, meaning people can afford and obtain food.
Utilization – Proper nutrition, safety, and absorption of food in the body.
Stability – Reliable supply and access over time, without major disruptions.
Food insecurity emerges when any of these pillars is weak. For instance:
A drought may reduce availability.
Rising global prices can weaken access.
Poor sanitation or lack of dietary diversity can affect utilization.
Wars, conflicts, or pandemics disrupt stability.
Section 2: The Role of Global Market Prices in Food Security
Global markets set benchmarks for staple foods. Prices in Chicago, Paris, or Singapore often determine what wheat, rice, or soybeans cost in Africa, South Asia, or Latin America.
Why Prices Matter for Food Security
High Prices = More Hunger
When global food prices rise, poorer households reduce consumption or switch to less nutritious diets.
FAO estimates that the 2007–08 food price crisis pushed more than 100 million people into hunger.
Low Prices = Farmer Distress
While high prices hurt consumers, very low prices can harm small farmers, reducing their incomes and discouraging future production.
This creates a cycle of poverty, migration, and reduced agricultural investment.
Price Volatility
Unpredictable swings are as harmful as high prices. Farmers cannot plan their crops, governments struggle with food subsidy budgets, and traders hoard supplies, worsening instability.
Section 3: Historical Food Price Crises
1. The 1970s Oil Shock & Food Prices
Oil price hikes raised fertilizer, transport, and irrigation costs, driving global food inflation.
2. 2007–2008 Global Food Price Crisis
Wheat, rice, and maize prices doubled or tripled due to biofuel demand, export bans, and speculation.
Riots broke out in more than 30 countries, including Haiti, Egypt, and Bangladesh.
3. 2010–2011 Price Surge (Arab Spring Trigger)
Poor harvests in Russia and Ukraine, coupled with droughts, drove wheat prices higher.
Food inflation was a key factor fueling protests in Tunisia, Egypt, and across the Arab world.
4. COVID-19 Pandemic (2020–2022)
Supply chain disruptions, export restrictions, and labor shortages pushed food prices up.
Millions of urban poor in developing countries were hit hardest.
5. Russia–Ukraine War (2022–present)
Ukraine and Russia supply 30% of global wheat exports, 20% of maize, and 75% of sunflower oil.
The war disrupted Black Sea trade routes, triggering a surge in global grain prices.
Section 4: Key Drivers of Global Market Prices
Supply & Demand Imbalances
Rising demand for meat (China, India) increases feed grain demand.
Population growth (expected to reach 10 billion by 2050) pressures supplies.
Climate Change & Extreme Weather
Droughts in Africa, floods in South Asia, and wildfires in North America reduce output.
El Niño and La Niña cycles influence rainfall and crop yields globally.
Energy Prices
Oil prices affect fertilizer, irrigation, and transport costs.
Biofuel policies (e.g., ethanol in the US, biodiesel in Europe) divert grains from food to fuel.
Trade Policies
Export bans (India on rice, Russia on wheat) reduce global supply and spike prices.
Import tariffs and quotas distort markets further.
Speculation & Financialization of Commodities
Hedge funds and institutional investors increasingly trade food futures.
While providing liquidity, speculation can amplify price swings.
Geopolitical Conflicts & Wars
War zones reduce production (Ukraine) or block exports.
Sanctions can disrupt fertilizer supplies (Russia-Belarus potash).
Section 5: Food Security Challenges in Different Regions
Africa
Heavy reliance on imported wheat and rice.
Vulnerable to global price shocks due to weak currencies.
Climate shocks (drought in Horn of Africa) worsen hunger.
Asia
India: major producer but also restricts exports during inflation.
China: massive food demand, maintains large reserves.
Southeast Asia: rice-dependent economies vulnerable to export bans.
Middle East & North Africa (MENA)
Highly import-dependent (over 50% of food).
Price shocks linked to political unrest (Arab Spring).
Latin America
A food-exporting region (Brazil, Argentina) but faces domestic food inflation.
Export crops often prioritized over local food needs.
Developed Countries
More resilient due to subsidies and safety nets.
Still vulnerable to rising food inflation, affecting lower-income households.
Section 6: Consequences of Rising Food Prices
Hunger & Malnutrition
Poor families spend 50–70% of income on food.
Rising prices mean reduced meals, more stunting in children.
Social Unrest & Political Instability
Food riots, protests, and revolutions often follow price spikes.
Economic Strain on Governments
Higher subsidy bills (India’s food subsidy crosses billions annually).
Pressure on foreign reserves for food-importing countries.
Migration & Refugee Crises
Hunger drives rural-to-urban migration and cross-border displacement.
Section 7: Policy Responses to Balance Food Security & Prices
Global Cooperation
WTO rules to prevent arbitrary export bans.
FAO-led initiatives for transparency in food markets.
National Policies
Price stabilization funds and buffer stocks.
Social safety nets: food stamps, cash transfers, subsidized food.
Investment in Agriculture
Modern farming, irrigation, storage, and logistics.
Encouraging climate-resilient crops.
Sustainable Practices
Reduce food waste (1/3 of global food is wasted).
Diversify crops to reduce reliance on wheat/rice/maize.
Regional Food Reserves
ASEAN rice reserve mechanism.
African Union initiatives for emergency grain stocks.
Private Sector & Technology
Precision farming, AI-driven yield forecasts.
E-commerce platforms improving farmer-market linkages.
Section 8: The Future – Can We Ensure Food Security Amid Price Volatility?
By 2050, food demand will rise by 60–70%.
Climate change could reduce yields by 10–25% in some regions.
Global interdependence means local crises (Ukraine war, Indian export bans) ripple worldwide.
The challenge is balancing farmer incomes, consumer affordability, and global stability.
Promising solutions include:
Climate-smart agriculture.
International grain reserves.
Digital platforms for real-time price transparency.
Stronger trade cooperation and less protectionism.
Conclusion
Food security is deeply tied to global market prices. When markets are stable and predictable, people eat well, farmers earn fair incomes, and societies remain peaceful. But when prices spike due to conflict, climate change, or speculation, millions are pushed into hunger and political instability rises.
The future demands a balanced approach—ensuring affordable food for consumers, fair returns for farmers, and resilience in supply chains. Global cooperation, sustainable practices, and smart technology will be central to ensuring that food security is not left hostage to market volatility.
In short: food is not just a commodity—it is a foundation of human survival, dignity, and global stability.

Role of WTO in International TradeIntroduction
International trade is the backbone of the global economy. Countries depend on each other for raw materials, technology, consumer goods, and services. To ensure that this complex web of exchanges remains smooth, fair, and beneficial for all, there must be rules, institutions, and mechanisms for dispute resolution. The World Trade Organization (WTO) plays this central role.
Established in 1995, the WTO replaced the General Agreement on Tariffs and Trade (GATT), which had guided world trade since 1948. Today, it is the only global international organization dealing with the rules of trade between nations. Its primary goal is to help producers of goods and services, exporters, and importers conduct business with as little friction as possible.
The WTO functions as both a forum for trade negotiations and a dispute settlement body. Its agreements, signed by the majority of trading nations, cover not just goods but also services and intellectual property rights. With 164 member countries (as of 2025), representing more than 98% of global trade, the WTO is a critical pillar of globalization.
This essay explores in detail the role of the WTO in international trade, covering its objectives, functions, agreements, dispute settlement system, impact on developed and developing nations, criticisms, and the challenges it faces in the 21st century.
Historical Background
From GATT to WTO
1947: The General Agreement on Tariffs and Trade (GATT) was established after World War II to encourage trade liberalization and economic recovery.
Focus: GATT dealt primarily with trade in goods and sought to reduce tariffs and quotas.
Limitations: GATT was a provisional arrangement and lacked strong enforcement mechanisms. It struggled to handle new trade areas like services, intellectual property, and agriculture.
Creation of the WTO
Uruguay Round (1986–1994): After years of negotiations, member countries agreed to create a stronger institution.
1995: The WTO officially replaced GATT. Unlike GATT, the WTO had a permanent institutional framework, a wider scope, and stronger dispute settlement powers.
Objectives of the WTO
The WTO’s objectives are enshrined in its founding agreements. Some of the key goals include:
Promote Free and Fair Trade
Reduce trade barriers (tariffs, quotas, subsidies).
Ensure equal opportunities for all trading partners.
Establish a Rules-Based System
Provide a transparent, predictable framework for international trade.
Encourage Economic Growth and Employment
Facilitate trade flows that contribute to global economic expansion.
Protect and Preserve the Environment
Ensure trade rules align with sustainable development.
Integrate Developing and Least Developed Countries (LDCs)
Provide special provisions to help them benefit from global trade.
Functions of the WTO
The WTO carries out several critical functions that shape the global trading system:
1. Administering Trade Agreements
The WTO oversees a vast set of agreements that cover goods, services, and intellectual property rights.
Examples: GATT 1994, General Agreement on Trade in Services (GATS), Trade-Related Aspects of Intellectual Property Rights (TRIPS).
2. Acting as a Forum for Trade Negotiations
Members negotiate trade liberalization, new agreements, and reforms.
Example: The ongoing Doha Development Round focused on agricultural subsidies and development issues.
3. Handling Trade Disputes
The WTO provides a structured dispute settlement mechanism.
Example: The US-EU dispute over subsidies to Boeing and Airbus was handled by WTO panels.
4. Monitoring National Trade Policies
Through the Trade Policy Review Mechanism (TPRM), WTO evaluates members’ trade policies to ensure transparency.
5. Technical Assistance and Training
WTO supports developing and least-developed countries by offering training, capacity-building, and special provisions.
6. Cooperation with Other International Institutions
Works with IMF, World Bank, and UN to coordinate trade and financial stability.
WTO Agreements and Coverage
The WTO’s framework is built on a comprehensive set of agreements covering multiple areas of trade.
1. Trade in Goods (GATT 1994)
Rules governing tariffs, quotas, subsidies, anti-dumping measures.
Special agreements on agriculture, textiles, and sanitary measures.
2. Trade in Services (GATS)
Covers sectors like banking, telecommunications, transport, education, and healthcare.
Promotes liberalization of service industries across borders.
3. Intellectual Property Rights (TRIPS)
Protects patents, trademarks, copyrights, and trade secrets.
Ensures innovation while balancing access, especially for medicines.
4. Dispute Settlement Understanding (DSU)
Provides legally binding dispute resolution through panels and an appellate body.
Ensures compliance with rulings.
5. Plurilateral Agreements
Not binding on all members, but important in niche areas.
Example: Agreement on Government Procurement (GPA).
Role of WTO in Promoting International Trade
1. Trade Liberalization
WTO promotes lowering of tariffs and non-tariff barriers.
Example: The Information Technology Agreement (ITA) eliminated tariffs on IT products.
2. Ensuring Fair Competition
Prevents unfair practices like dumping and excessive subsidies.
Allows safeguard measures when domestic industries are threatened.
3. Dispute Resolution
Provides a neutral, rules-based process for settling trade conflicts.
Avoids trade wars and unilateral retaliations.
4. Encouraging Transparency
Members must notify trade measures and policies.
Enhances predictability for businesses.
5. Helping Developing Countries
Special and Differential Treatment (SDT) provisions allow flexibility.
Example: Longer time frames for implementing commitments.
Case Studies of WTO’s Role
1. US–China Trade Disputes
Numerous disputes over intellectual property rights, tariffs, and subsidies.
WTO acted as a mediator, though recent tensions have tested its authority.
2. Bananas Dispute (EU vs. Latin American Countries)
EU’s banana import regime discriminated against Latin American exporters.
WTO panels ruled in favor of Latin American countries.
3. India’s Solar Panels Case
US challenged India’s domestic content requirements for solar power.
WTO ruled against India, showing the clash between trade rules and environmental goals.
Role for Developing and Least Developed Countries
The WTO plays a crucial role in integrating developing nations into global trade.
Market Access: WTO commitments open markets for exports.
Capacity Building: Technical assistance and training programs.
Flexibility: Longer transition periods for reforms.
Special Safeguards: Protection for vulnerable sectors like agriculture.
Example: African nations benefit from WTO’s Aid for Trade initiative.
Criticisms of the WTO
Despite its role, the WTO faces significant criticism:
Favoring Developed Nations
Rules on intellectual property and subsidies often benefit wealthy countries.
Stalled Negotiations
The Doha Round has been largely unsuccessful due to disagreements.
Dispute Settlement Crisis
Since 2019, the Appellate Body has been paralyzed because the US blocked appointments.
Environmental Concerns
Critics argue WTO prioritizes trade over climate change and sustainability.
Limited Inclusiveness
Small economies struggle to influence negotiations dominated by large economies.
Challenges for WTO in the 21st Century
Rise of Protectionism
Trade wars (e.g., US-China) undermine WTO rules.
Digital Trade and E-commerce
WTO lacks comprehensive rules for cross-border digital trade.
Climate Change and Sustainability
Balancing environmental protection with trade liberalization.
Geopolitical Tensions
Rivalries between major economies weaken global consensus.
Reform of Dispute Settlement
Restoring credibility by fixing the Appellate Body crisis.
Future Role of WTO
The WTO must evolve to remain relevant:
Revive Multilateralism: Rebuild trust in global trade rules.
Strengthen Dispute Resolution: Restore a fully functioning appellate system.
Adapt to Digital Trade: Frame rules for e-commerce, data flows, and digital taxation.
Promote Inclusive Growth: Ensure benefits reach developing and least-developed countries.
Support Green Trade: Align trade rules with climate commitments.
Conclusion
The World Trade Organization remains a cornerstone of international trade. Since 1995, it has provided a rules-based system that promotes predictability, reduces trade barriers, and offers a platform for resolving disputes. It has played a vital role in integrating developing nations into the global economy.
However, its credibility has been challenged by stalled negotiations, the crisis in dispute settlement, and rising protectionism. The future of the WTO depends on its ability to reform, embrace digital trade, support sustainability, and balance the interests of both developed and developing nations.
In an interconnected world, no country can afford to isolate itself from global trade. The WTO, despite its shortcomings, is indispensable in ensuring that trade remains a force for prosperity, cooperation, and peace.

Global Economic Recessions & RecoveriesPart 1: What is a Global Economic Recession?
Definition
A recession is generally defined as a significant decline in economic activity lasting for a prolonged period, typically identified by two consecutive quarters of negative GDP growth. At the global level, a recession occurs when world output, trade, and employment collectively decline.
But beyond technical definitions, recessions are felt in real life:
Jobs become scarce.
Wages stagnate.
Businesses close.
Governments face reduced tax revenues.
Investors witness stock market downturns.
Features of a Recession
Falling GDP – Global production and services shrink.
Rising Unemployment – Companies lay off workers.
Decline in Trade – Imports and exports fall as demand weakens.
Stock Market Weakness – Investors flee risky assets.
Banking Stress – Credit availability shrinks.
Part 2: Causes of Global Recessions
Recessions can stem from multiple factors, often overlapping:
Financial Crises
Example: The 2008 Global Financial Crisis caused by housing bubbles and excessive leverage in banks.
Policy Errors
Excessively tight monetary policy can choke growth.
Overly aggressive taxation or austerity can reduce demand.
External Shocks
Oil price spikes (1973 Oil Shock).
Wars or geopolitical tensions.
Natural disasters or pandemics (COVID-19).
Speculative Bubbles Bursting
Dot-com bubble (2000).
Cryptocurrency market collapses (2022).
Structural Imbalances
High sovereign debt.
Trade imbalances between nations.
Part 3: Impact of Global Recessions
Recessions are not just economic phenomena—they touch every aspect of human life.
On Individuals
Job losses and wage cuts.
Higher cost of living due to inflation in essentials.
Reduced access to credit.
Mental health stress due to financial uncertainty.
On Businesses
Lower consumer demand.
Rising defaults and bankruptcies.
Reduced investments in innovation and expansion.
On Governments
Lower tax revenues.
Increased welfare spending (unemployment benefits, subsidies).
Rising fiscal deficits.
On Global Trade
Decline in exports and imports.
Shipping, aviation, and logistics industries suffer.
Emerging markets depending on global demand face deep contractions.
Part 4: Historical Global Recessions
1. The Great Depression (1929–1939)
Trigger: US stock market crash in 1929.
Impact: 25% unemployment in the US, collapse of world trade, rise of protectionism.
Lessons: Importance of financial regulation and global cooperation.
2. The Oil Crisis Recession (1973–1975)
Trigger: OPEC oil embargo, quadrupling oil prices.
Impact: High inflation (stagflation), economic slowdown in the West.
Lessons: Vulnerability of economies to energy shocks.
3. The Asian Financial Crisis (1997–1998)
Trigger: Collapse of Thai baht, spreading currency crises across Asia.
Impact: Severe recessions in South Korea, Indonesia, and Malaysia.
Lessons: Risks of excessive foreign debt and weak financial systems.
4. The Global Financial Crisis (2008–2009)
Trigger: Subprime mortgage meltdown, Lehman Brothers collapse.
Impact: Deep recession in US & Europe, contagion worldwide.
Lessons: Need for stricter financial regulations and coordinated stimulus.
5. COVID-19 Recession (2020)
Trigger: Global lockdowns, supply chain breakdowns.
Impact: Largest contraction since WWII, record unemployment.
Lessons: Importance of healthcare resilience and digital infrastructure.
Part 5: Mechanisms of Economic Recovery
Recovery is the phase where the economy rebounds from recession toward growth.
Types of Recovery Shapes
V-Shaped – Sharp fall, quick rebound (COVID-19 recovery in some nations).
U-Shaped – Slow bottoming out, then recovery.
W-Shaped (Double-dip) – Recovery followed by another recession.
L-Shaped – Prolonged stagnation (Japan in the 1990s).
Drivers of Recovery
Government Stimulus – Fiscal spending and tax cuts.
Monetary Easing – Central banks lowering interest rates and buying assets.
Innovation & Productivity – New technologies boosting efficiency.
Global Trade Growth – Rebound in demand for exports and imports.
Consumer Confidence – Households resuming spending.
Part 6: Role of Global Institutions
Organizations play vital roles in stabilizing and guiding recoveries:
IMF (International Monetary Fund) – Provides emergency loans and financial advice.
World Bank – Funds infrastructure and poverty alleviation.
WTO (World Trade Organization) – Ensures smooth global trade.
G20 – Coordinates global economic policies.
Part 7: Challenges in Modern Recoveries
High Debt Levels – Countries borrow heavily during recessions, making recovery harder.
Income Inequality – Recoveries often benefit the wealthy more than workers.
Climate Change Risks – Natural disasters and transition to green energy impact growth.
Geopolitical Tensions – Trade wars, sanctions, and conflicts hinder global cooperation.
Technological Disruptions – Automation may delay job recoveries.
Part 8: Strategies for Strong Recoveries
Balanced Policy Mix
Combine fiscal stimulus with responsible monetary policy.
Investment in Infrastructure
Creates jobs and boosts long-term productivity.
Support for SMEs
Small businesses often generate the most jobs.
Green & Sustainable Growth
Renewable energy and climate-friendly projects.
Strengthening Global Cooperation
Joint efforts on trade, health, and finance.
Part 9: Future Outlook of Global Recessions & Recoveries
Digital Transformation – Technology will play a central role in recoveries.
Decoupling Trends – Some countries reducing dependency on global supply chains.
Demographics – Aging populations in developed nations may slow recoveries.
Emerging Economies – India, Southeast Asia, and Africa may drive global growth.
Resilience Building – More focus on healthcare, energy independence, and financial safety nets.
Conclusion
Global recessions and recoveries are not isolated events—they are part of an ongoing cycle in the world economy. Each downturn brings hardships, but also opportunities to reform, innovate, and build resilience.
The history of past crises shows that while recessions are painful, recoveries can set the stage for long periods of prosperity if managed wisely. The key lies in global cooperation, responsible policymaking, and adaptability.
Currency Markets (Forex) & Exchange Rate DynamicsIntroduction
Money is the lifeblood of trade. Just as people in different regions use different languages, nations around the world use different currencies. While within a country people exchange goods and services using their national currency (like Rupee in India, Dollar in the US, Yen in Japan, or Euro in Europe), when trade crosses borders, there arises a need to exchange one currency for another. This mechanism, in which currencies are bought, sold, and exchanged at agreed prices, is called the foreign exchange market (Forex or FX).
The currency market is the largest and most liquid financial market in the world. Every single day, more than $7.5 trillion (as of 2024 estimates) worth of currencies change hands globally—far exceeding daily trading in stocks, bonds, or commodities. Forex is the invisible backbone of international trade, investment, tourism, remittances, and even geopolitics.
This essay will explore the structure of currency markets, the participants, instruments, and mechanics of trading, and then dive deep into exchange rate dynamics—the forces that determine why one currency strengthens or weakens against another.
1. What is the Currency Market (Forex)?
The foreign exchange market (Forex) is a decentralized global marketplace where currencies are traded. Unlike stock exchanges, which operate in specific locations (like NYSE or NSE), Forex is an over-the-counter (OTC) market, meaning that trading happens electronically between banks, brokers, corporations, and individuals worldwide, 24 hours a day, five days a week.
Key features of Forex:
24-hour market: Opens on Monday in Asia (Sydney/Tokyo) and runs through Europe (London) until Friday evening in the US (New York).
Decentralized structure: No single exchange; transactions occur via electronic networks and interbank systems.
High liquidity: With trillions traded daily, currency can be bought/sold almost instantly.
Leverage-driven: Traders often borrow to increase exposure, which magnifies both profits and risks.
Relative value trading: In Forex, one never buys a currency in isolation—it’s always traded against another (e.g., EUR/USD, USD/INR).
2. Why is Forex Important?
The currency market is not just a playground for speculators—it has deep real-world importance:
International Trade & Investment – Exporters and importers depend on Forex to convert earnings. Example: An Indian IT company earning in dollars must convert to rupees to pay local salaries.
Tourism & Travel – A traveler from India to Europe needs Euros, while a European visiting India needs Rupees.
Foreign Direct Investment (FDI) – When companies invest abroad, they convert currencies (e.g., a Japanese firm investing in the US needs dollars).
Remittances – Millions of migrant workers send money home, creating huge Forex flows.
Central Banks & Governments – They intervene in currency markets to stabilize their economies.
Financial Trading & Hedging – Hedge funds, banks, and retail traders seek profits or risk protection by betting on currency movements.
3. Structure of the Forex Market
The Forex market has multiple layers and participants:
(A) Interbank Market
The top level, where large international banks (JPMorgan, Citi, Deutsche Bank, HSBC, etc.) trade billions daily.
Provides liquidity and sets global benchmark rates.
(B) Corporates & Multinationals
Companies engaged in cross-border trade or investment.
Example: A US car company importing parts from Japan needs Yen.
(C) Central Banks & Governments
They buy/sell currencies to manage exchange rates, stabilize economies, and control inflation.
Example: Reserve Bank of India intervening to prevent sharp INR depreciation.
(D) Institutional Investors & Funds
Hedge funds, mutual funds, pension funds speculate or hedge exposures.
(E) Retail Traders
Individuals trading via brokers/platforms. Growing rapidly due to online apps.
Though small compared to banks, retail adds significant market activity.
4. Types of Forex Transactions
Currency trading can be classified by settlement timing and purpose:
Spot Market
Immediate exchange of currencies (settled in 2 business days).
Most visible and liquid segment.
Forward Market
Agreement to exchange currencies at a future date at a pre-agreed rate.
Used by businesses to hedge risks (e.g., an Indian importer locking USD/INR rate for future payment).
Futures & Options (Derivatives)
Standardized contracts traded on exchanges.
Used by traders and funds for speculation or hedging.
Swap Agreements
Two parties exchange currencies temporarily and reverse the deal later.
Often used by banks for liquidity management.
5. Major Currency Pairs
Currencies are quoted in pairs, where one is the base currency and the other is the quote currency.
Major Pairs (involving USD, highly liquid):
EUR/USD (Euro vs Dollar)
GBP/USD (British Pound vs Dollar)
USD/JPY (Dollar vs Yen)
USD/CHF (Dollar vs Swiss Franc)
Minor Pairs (crosses without USD):
EUR/GBP, EUR/JPY, GBP/JPY
Exotic Pairs (developed vs emerging currencies):
USD/INR (Dollar vs Rupee)
USD/BRL (Dollar vs Brazilian Real)
6. Exchange Rate Dynamics – How Currency Values are Determined
At the heart of Forex lies the exchange rate: the price of one currency in terms of another.
Example: 1 USD = 83 INR means 1 US Dollar costs 83 Indian Rupees.
But why does it fluctuate daily? Multiple forces shape exchange rates:
(A) Supply and Demand
If demand for dollars rises (e.g., due to higher imports or capital outflows from India), USD/INR rises (rupee weakens).
Conversely, strong FDI inflows increase rupee demand, strengthening INR.
(B) Interest Rate Differentials
Currencies of countries offering higher interest rates attract investors seeking better returns.
Example: If RBI keeps rates higher than the US Fed, foreign investors may buy Indian bonds, increasing INR demand.
(C) Inflation Levels
Countries with lower inflation usually see stronger currencies, as purchasing power remains stable.
High inflation erodes currency value. Example: Argentina’s peso depreciates sharply due to hyperinflation.
(D) Economic Growth & Trade Balance
Strong GDP growth attracts foreign capital, boosting currency.
A trade surplus strengthens currency (exports > imports), while deficits weaken it.
(E) Political Stability & Governance
Investors prefer stable democracies with strong rule of law.
Political crises, wars, or corruption scandals often trigger capital flight.
(F) Speculation & Market Sentiment
Traders bet on future currency directions. If markets believe the rupee will weaken, speculative selling accelerates the move.
(G) Central Bank Intervention
Central banks directly buy/sell currencies or adjust interest rates to stabilize their currency.
Example: Bank of Japan often intervenes to prevent excessive Yen appreciation.
7. Exchange Rate Systems
Throughout history, different systems have been used to manage currency values:
Fixed Exchange Rate – Currency pegged to gold or another currency (e.g., USD pegged to gold under Bretton Woods until 1971).
Floating Exchange Rate – Market forces determine value (used by US, EU, UK, Japan).
Managed Float – Central bank intervenes occasionally (India, China).
Currency Pegs – Some countries peg to USD (Saudi Riyal, Hong Kong Dollar).
8. Volatility in Forex
Forex is highly volatile—daily fluctuations create both risks and opportunities.
Example: Brexit referendum (2016) caused GBP/USD to crash overnight.
Global crises (COVID-19, Russia-Ukraine war) often trigger “flight to safety,” strengthening USD as investors rush to safe-haven assets.
9. Risks in Currency Markets
Exchange Rate Risk – Loss from adverse moves in rates.
Interest Rate Risk – Changes in rates affect currency value.
Liquidity Risk – Exotic currencies may have wider spreads.
Political/Geopolitical Risk – Wars, sanctions, coups affect currency flows.
Speculative Risk – Leverage magnifies losses.
10. Case Studies of Exchange Rate Dynamics
(A) USD-INR
Over decades, INR has depreciated from 1 USD = 7 INR (1970s) to ~83 INR (2025) due to inflation differentials, trade deficits, and dollar strength.
RBI actively manages volatility via interventions.
(B) Japanese Yen (JPY)
Known as a funding currency due to ultra-low interest rates.
Often used in “carry trades”—borrowing Yen cheaply and investing in higher-yielding assets elsewhere.
(C) Euro (EUR)
World’s second-most traded currency.
Dynamics depend on the Eurozone economy—if Germany faces slowdown, Euro weakens.
Conclusion
The currency market (Forex) is the invisible giant powering the global economy. It ensures that trade, investment, tourism, and remittances flow smoothly across borders. Its exchange rate dynamics reflect a complex interplay of economics, politics, psychology, and speculation.
For businesses, policymakers, and investors, understanding Forex is crucial—because a small change in exchange rates can alter profits, trigger inflation, or shake entire economies.
As the world moves toward digital money, AI-driven trading, and multipolar currency systems, the future of Forex will be even more dynamic and unpredictable. Yet one thing is certain: as long as nations exist with different currencies, Forex will remain the beating heart of global finance.
Institutions & Participants in Financial Markets1. Introduction
Financial markets are the backbone of global economies. They provide a platform where individuals, corporations, and governments can raise capital, invest savings, and manage risks. Behind every transaction in the stock market, currency exchange, bond market, or commodity trading, there are participants who make the system function. Some are individuals trading with their own savings, while others are large institutions managing billions of dollars. Together, they form a complex network of buyers, sellers, intermediaries, and regulators who ensure liquidity, stability, and transparency in markets.
Understanding Institutions and Participants is essential because they influence how prices are discovered, how risks are shared, and how capital flows across economies. Without them, financial markets would not function efficiently.
2. Definition of Institutions & Participants
Institutions in financial markets refer to organized bodies that create, regulate, or facilitate market activities. Examples include central banks (RBI, FED), regulators (SEBI, SEC), stock exchanges (NSE, NYSE), clearing houses, and depositories. Their primary role is to ensure smooth functioning, enforce rules, and reduce risks of defaults or fraud.
Participants are entities or individuals that actively take part in financial transactions. This includes retail traders, institutional investors, corporations, governments, and intermediaries like brokers and dealers. They provide liquidity, demand, and supply for financial assets.
Together, institutions and participants form the ecosystem of financial markets, where institutions provide the structure and participants provide the activity.
3. Types of Market Participants
(a) Retail Investors
Retail investors are individual participants who invest their personal savings in stocks, mutual funds, bonds, or derivatives. They usually trade in smaller quantities compared to institutions. Retail participation has grown tremendously with the rise of mobile trading apps, discount brokers, and financial literacy campaigns.
Strengths: Flexibility, diversity of strategies, emotional conviction.
Weaknesses: Limited capital, lack of information compared to institutions, prone to herd behavior.
Example: In India, after 2020, retail investors surged on platforms like Zerodha, Upstox, and Groww, contributing significantly to stock market liquidity.
(b) Institutional Investors
These are large organizations that pool funds from clients or members and invest systematically. They include:
Mutual Funds – Manage pooled capital for retail investors.
Pension Funds – Invest long-term for retirement benefits.
Insurance Companies – Invest premiums in safe and growth-oriented assets.
Hedge Funds & Private Equity – Use complex strategies to maximize returns.
Institutions play a dominant role because of their large capital base and access to advanced research. Their actions often influence market trends and sentiments.
(c) Brokers & Sub-Brokers
Brokers act as intermediaries between investors and the stock exchange. They provide platforms, research, and execution services. Sub-brokers or franchisees work under main brokers to service clients in smaller regions.
In India, SEBI regulates brokers, requiring them to register and follow compliance rules. Discount brokers like Zerodha revolutionized the industry by reducing costs and increasing retail participation.
(d) Market Makers & Dealers
Market makers are institutions or individuals who continuously provide buy and sell quotes for securities, ensuring liquidity in the market. Dealers trade on their own account, taking positions in securities to profit from price movements.
Example: In the Forex market, banks act as market makers by offering two-way quotes (bid and ask prices).
(e) Corporates
Companies participate in markets to raise funds by issuing shares, bonds, or commercial papers. They also engage in hedging using derivatives to manage currency or interest rate risks.
For example, Reliance Industries regularly taps debt markets, while Infosys issues shares under ESOPs.
(f) Governments & Central Banks
Governments raise capital through bonds (sovereign debt) to finance infrastructure, welfare, and development. Central banks regulate money supply, set interest rates, and intervene in foreign exchange markets.
The Federal Reserve (US) sets monetary policy that affects global markets.
The Reserve Bank of India (RBI) manages inflation, rupee stability, and liquidity.
(g) Regulators & Exchanges
Regulators (e.g., SEBI in India, SEC in the USA) create and enforce laws to protect investors and maintain fair markets.
Exchanges (e.g., NSE, NYSE) provide the physical or electronic infrastructure where buyers and sellers meet. They ensure price transparency, equal access, and fair competition.
(h) Foreign Institutional Investors (FIIs) & Foreign Portfolio Investors (FPIs)
Global investors participate in emerging markets like India to seek growth opportunities. They bring in large capital inflows, which can boost stock indices but also increase volatility if they withdraw funds quickly.
Example: In 2020–2021, FPIs invested heavily in Indian equities, leading to record highs in Nifty and Sensex.
4. Institutions in Global & Indian Context
Stock Exchanges
Global: NYSE, NASDAQ, London Stock Exchange.
India: NSE and BSE dominate trading volumes.
Clearing Corporations & Depositories
They reduce settlement risks by ensuring that buyers get their securities and sellers receive payments.
India: NSDL, CDSL.
Global: DTCC (USA), Euroclear (Europe).
Regulators
India: SEBI, RBI, IRDAI.
Global: SEC (USA), FCA (UK), ESMA (Europe).
International Institutions
IMF & World Bank – provide financial stability and funding to nations.
Bank for International Settlements (BIS) – sets banking regulations.
5. How Participants Interact in Markets
Financial markets are divided into:
Primary Market: Where new securities are issued (IPOs, bonds). Corporates and governments raise funds here.
Secondary Market: Where existing securities are traded. Retail and institutional investors interact here.
Price Discovery happens when buyers and sellers agree on prices based on demand and supply. Institutions often lead price discovery, while retail investors follow.
Technology’s Role: Algorithmic trading, high-frequency trading, and fintech platforms have transformed participation. Machines now execute trades in microseconds, increasing liquidity but also creating flash-crash risks.
6. Case Studies & Examples
2008 Financial Crisis: Triggered by reckless lending by banks, misuse of mortgage-backed securities, and regulatory gaps. It showed the danger of unregulated institutions.
Indian Markets Post-2020: Surge in retail investors and rise of discount brokers democratized investing. FIIs also played a strong role in pushing indices to record highs.
7. Challenges & Risks
Conflicts of Interest – Brokers may mis-sell products, institutions may prioritize profits over clients.
Market Manipulation – Pump-and-dump schemes, insider trading, and algorithmic manipulation distort fairness.
Globalization Risks – Capital flight during crises (e.g., FIIs pulling funds).
Regulatory Gaps – Some instruments (like crypto) still lack clear regulations.
8. Future of Institutions & Participants
AI & Algorithmic Trading will dominate markets, with human traders playing a smaller role.
Fintech & Digital Platforms will bring more retail investors into the system.
Global Institutional Flows will decide the fate of emerging markets like India.
Sustainable Finance – ESG-focused investing and green bonds will rise.
9. Conclusion
Institutions and participants together form the lifeline of financial markets. Institutions provide the rules, infrastructure, and trust needed for smooth functioning, while participants provide liquidity, capital, and demand. Their interaction shapes prices, drives innovation, and supports economic growth.
From a small retail trader buying a single stock to a central bank moving billions in currency reserves, each participant plays a vital role in maintaining balance. The future will bring more technology-driven participation, deeper global integration, and stronger institutional oversight.
In essence, the strength of a financial market depends on the quality of its institutions and the diversity of its participants.
Short Selling & Market Volatility WorldwideIntroduction
Financial markets thrive on a balance between optimism and skepticism. While investors who buy assets express confidence in growth, those who sell short represent a contrasting, yet equally vital, belief system. Short selling refers to the practice of selling borrowed securities with the expectation that their price will fall, enabling the seller to buy them back later at a lower price for a profit. Though often controversial, short selling is deeply embedded in the functioning of global financial markets.
On the other hand, market volatility refers to the speed and magnitude of changes in asset prices, reflecting uncertainty, investor sentiment, and macroeconomic conditions. Both concepts are closely interlinked: short selling can amplify volatility, while volatile conditions often fuel short-selling opportunities.
Globally, regulators, institutional investors, and policymakers debate whether short selling destabilizes markets or provides healthy skepticism that enhances efficiency. This discussion has become more critical after episodes like the 2008 Global Financial Crisis, the 2020 COVID-19 crash, and retail-driven short squeezes like GameStop in 2021.
This paper explores the mechanisms, history, controversies, regulatory frameworks, and global impacts of short selling, along with its deep connection to market volatility.
1. Understanding Short Selling
1.1 The Mechanics of Short Selling
The process of short selling involves several steps:
Borrowing the asset: A short seller borrows shares (or other securities) from a broker.
Selling in the open market: The borrowed securities are sold at the prevailing market price.
Repurchasing (covering the short): Later, the seller buys back the same quantity of shares, ideally at a lower price.
Returning the shares: The borrowed securities are returned to the lender, and the difference between the selling and repurchasing price becomes the short seller’s profit (or loss).
For example, if a trader sells borrowed shares of Company X at ₹1,000 each and repurchases them later at ₹800, the profit per share is ₹200 (excluding fees and borrowing costs).
1.2 Types of Short Selling
Naked Short Selling: Selling shares that have not been borrowed beforehand (often restricted).
Covered Short Selling: Selling shares that have already been borrowed (legal and widely practiced).
Synthetic Shorts: Using derivatives like options and futures to replicate short exposure.
1.3 Motivations Behind Short Selling
Profit-seeking: Traders speculate on price declines.
Hedging: Institutions use short positions to protect long portfolios.
Arbitrage: Exploiting mispricings in related securities.
Market correction: Identifying overvalued companies or fraudulent firms.
2. Market Volatility: A Global Phenomenon
2.1 Defining Volatility
Volatility measures the variability of asset returns, often expressed through standard deviation or implied volatility indices (e.g., VIX in the US, India VIX).
Historical Volatility: Based on past price movements.
Implied Volatility: Derived from option prices, reflecting market expectations.
2.2 Drivers of Volatility
Macroeconomic factors: Inflation, interest rates, GDP growth.
Political & geopolitical events: Elections, wars, trade tensions.
Corporate events: Earnings surprises, fraud revelations, mergers.
Market psychology: Fear and greed cycles.
Liquidity shocks: Sudden shortages or surges in capital flows.
2.3 Measuring Volatility Across the World
US: CBOE Volatility Index (VIX), often called the “fear gauge.”
India: NSE’s India VIX.
Europe: VSTOXX index.
Japan: Nikkei Volatility Index.
Volatility has universal dimensions but varies in intensity across emerging vs. developed markets.
3. The Interplay Between Short Selling & Volatility
3.1 Short Selling as a Source of Volatility
Downward pressure: Aggressive shorting can accelerate sell-offs.
Panic amplification: Retail investors may overreact to visible short interest.
Short squeezes: When heavily shorted stocks rise sharply, short sellers rush to cover, creating upward volatility.
3.2 Short Selling as a Dampener of Volatility
Price discovery: Shorts expose overvaluation and fraud, preventing bubbles.
Liquidity enhancement: Short sellers add trading volume, reducing bid-ask spreads.
Market efficiency: They ensure both positive and negative information is reflected in prices.
Thus, short selling has a dual effect: it can either stabilize by correcting mispricings or destabilize by triggering rapid sell-offs.
4. Historical Case Studies
4.1 The Great Depression (1929)
Short sellers were widely blamed for accelerating the market crash, leading to restrictions and the introduction of the Uptick Rule in the US (1938).
4.2 The Global Financial Crisis (2008)
Amid Lehman Brothers’ collapse, regulators worldwide banned or restricted short selling to prevent systemic risk. Critics argue these bans reduced liquidity and delayed price corrections.
4.3 European Debt Crisis (2010–2012)
Countries like Spain, Italy, and Greece banned short selling during sovereign debt fears. However, studies later showed such bans were ineffective in calming markets.
4.4 COVID-19 Market Crash (2020)
Volatility surged globally. Several European countries, India, and others imposed temporary short-selling restrictions, though the US refrained. Markets eventually recovered, highlighting that volatility stemmed more from uncertainty than short sellers.
4.5 GameStop Short Squeeze (2021)
A unique retail-driven rebellion where Reddit’s WallStreetBets community targeted heavily shorted stocks like GameStop and AMC. The short squeeze led to extreme volatility, losses for hedge funds, and debates about transparency in short selling.
5. Global Regulatory Perspectives
5.1 United States
Regulated by the SEC.
Uptick Rule (1938–2007): Allowed short selling only at higher prices than previous trades.
Alternative Uptick Rule (2010): Restricts shorting when a stock falls 10%+ in a day.
Transparency: Short interest data is disclosed biweekly.
5.2 Europe
European Securities and Markets Authority (ESMA) coordinates rules.
Transparency requirements: Large short positions must be disclosed publicly.
Temporary bans are common during crises.
5.3 Asia
Japan: Longstanding short-sale disclosure rules.
India: Short selling allowed with restrictions; naked shorting is prohibited. Stock lending & borrowing (SLB) mechanism facilitates covered shorts.
China: Very restrictive, viewing short selling as destabilizing.
5.4 Emerging Markets
Regulations often stricter due to concerns about volatility and investor confidence. Many nations restrict short selling during market stress.
6. The Ethical & Controversial Side
6.1 Criticisms of Short Selling
Seen as betting against success of companies.
Can exacerbate panic during downturns.
Potential for abusive practices, such as spreading false rumors (short-and-distort).
6.2 Defense of Short Selling
Vital for price discovery.
Helps identify fraudulent companies (e.g., Enron, Wirecard, Luckin Coffee).
Encourages transparency and corporate accountability.
6.3 Public Perception
Retail investors often view short sellers negatively, especially when firms collapse. Yet institutional investors appreciate their role in balancing optimism with caution.
7. Short Selling, Technology, and the Future
7.1 Algorithmic & High-Frequency Shorting
Algorithms execute rapid-fire shorts based on news, price movements, or arbitrage.
Concerns exist about flash crashes and heightened volatility.
7.2 Role of Social Media
Platforms like Reddit, Twitter (X), and Discord amplify sentiment.
Retail coordination can now challenge institutional short sellers.
7.3 Crypto Markets
Short selling extends to Bitcoin and altcoins via futures and perpetual swaps.
Volatility in crypto is often more extreme than in traditional markets.
7.4 ESG & Ethical Investing
Debates arise whether short selling aligns with sustainable finance principles. Some argue it deters harmful companies; others view it as destructive speculation.
8. Short Selling in Different Market Structures
8.1 Developed Markets (US, UK, EU, Japan)
Deep liquidity supports active short selling.
Transparency rules balance risks.
8.2 Emerging Markets (India, Brazil, South Africa)
Lower liquidity makes volatility concerns greater.
Short selling often tightly regulated.
8.3 Frontier Markets
Limited short-selling infrastructure due to lack of stock-lending systems.
Volatility often driven by macro shocks, not short activity.
9. Empirical Research on Short Selling & Volatility
Studies suggest short selling increases intraday volatility but contributes to long-term price efficiency.
Short-sale bans during crises reduce liquidity and increase spreads, worsening volatility rather than containing it.
Transparency of short positions has a calming effect, as investors better understand bearish sentiment.
10. Policy Recommendations
Maintain transparency: Public disclosure of short positions helps reduce rumor-driven panic.
Avoid blanket bans: Evidence shows bans worsen liquidity and delay corrections.
Encourage stock-lending markets: Well-functioning lending systems reduce settlement risk.
Balance retail vs. institutional interests: Retail investors need education to understand short selling rather than fear it.
Global harmonization: Given interconnected markets, international coordination is vital during crises.
Conclusion
Short selling and market volatility are inseparable components of the financial ecosystem. While short selling often attracts controversy, it remains a critical tool for liquidity, hedging, and price discovery. Global evidence shows that volatility is not inherently caused by short sellers but by broader uncertainty and structural imbalances.
Regulators face the delicate task of balancing market stability with efficiency. A world without short selling would risk bubbles, fraud, and illiquidity. Conversely, unchecked shorting could fuel panic. The challenge is to create transparent, fair, and robust systems where skepticism and optimism coexist.
As financial markets evolve—with technology, retail participation, and new asset classes like crypto—the role of short selling in shaping volatility will continue to grow. Rather than vilifying it, policymakers and investors must acknowledge its dual nature: both a source of turbulence and a guardian of truth in markets worldwide.

Currency Derivatives in International MarketsIntroduction
Global trade, cross-border investments, and multinational business operations depend heavily on currencies. Whenever goods, services, or capital cross borders, transactions often involve exchanging one currency for another. Because exchange rates constantly fluctuate, this creates both risks and opportunities for businesses, investors, and traders.
To manage these risks or speculate on currency movements, international financial markets provide a sophisticated set of instruments known as currency derivatives.
Currency derivatives are financial contracts whose value is derived from the exchange rate of two currencies. For example, a contract tied to USD/INR, EUR/USD, or JPY/CNY is a currency derivative. These instruments enable market participants to hedge against foreign exchange (forex) volatility, arbitrage between markets, or speculate on price trends.
This article will provide a comprehensive exploration of currency derivatives in international markets, covering their types, mechanisms, uses, risks, regulatory aspects, and global market trends.
1. The Need for Currency Derivatives
1.1 Exchange Rate Volatility
Currencies fluctuate due to factors like interest rate changes, inflation, trade balances, geopolitical events, and capital flows. For instance, when the US Federal Reserve raises interest rates, the US dollar typically strengthens, impacting emerging market currencies.
A European exporter selling machinery to India and receiving payment in Indian Rupees (INR) faces the risk that the INR might depreciate against the Euro before payment, reducing profit margins. Currency derivatives help hedge such risks.
1.2 Globalization and Trade
With the rise of global supply chains, companies constantly deal with multiple currencies. Currency risk can materially impact revenues and costs. Derivatives are necessary tools for financial planning, pricing, and budgeting.
1.3 Capital Flows and Investments
Portfolio investors and institutional funds investing abroad face currency exposure. For instance, a US-based investor holding Japanese equities will see returns influenced not only by the performance of Japanese stocks but also by the movement of USD/JPY.
1.4 Speculation and Arbitrage
Not all currency derivative participants are hedgers. Many are speculators (betting on movements for profit) or arbitrageurs (exploiting price inefficiencies across markets). This mix ensures liquidity and efficient pricing in derivative markets.
2. Types of Currency Derivatives
Currency derivatives exist in both over-the-counter (OTC) and exchange-traded markets. The most common types are:
2.1 Currency Forwards
A forward contract is a private agreement between two parties to exchange a fixed amount of one currency for another at a predetermined exchange rate on a future date.
OTC product: Customized in terms of amount, maturity, and settlement.
Commonly used by corporations for hedging.
Example: An Indian company expects to pay $1 million to a US supplier in 3 months. It enters a forward contract to lock the USD/INR rate at 84.50, ensuring certainty regardless of market fluctuations.
2.2 Currency Futures
Futures are standardized contracts traded on organized exchanges, obligating the buyer and seller to exchange currencies at a specific price and date.
Exchange-traded: Offers liquidity, transparency, and margin requirements.
Example: An investor on the CME (Chicago Mercantile Exchange) may buy a Euro futures contract against the USD, betting on Euro appreciation.
2.3 Currency Options
Options give the right (but not the obligation) to buy (call) or sell (put) a currency at a specified strike price before or at maturity.
Useful for hedgers who want downside protection but retain upside potential.
Example: A US importer buying goods from Japan may purchase a call option on USD/JPY to guard against Yen appreciation.
2.4 Currency Swaps
A currency swap involves exchanging principal and interest payments in one currency for those in another, often for long durations.
Used by corporations and governments to secure cheaper debt or match cash flows.
Example: A European company needing USD may swap its Euro-based loan obligations with a US company holding dollar liabilities.
2.5 Exotic Currency Derivatives
Beyond plain vanilla products, international markets also use structured derivatives:
Barrier options (knock-in, knock-out)
Basket options (linked to multiple currencies)
Quanto derivatives (currency-linked but settled in another currency)
These instruments cater to advanced hedging and speculative needs.
3. Mechanism of Currency Derivatives Trading
3.1 Pricing and Valuation
Forward Rate = Spot Rate × (1 + Interest Rate of Domestic Currency) / (1 + Interest Rate of Foreign Currency)
Futures prices are influenced by forward rates, interest rate parity, and market demand-supply.
Options pricing uses models like Black-Scholes or Garman-Kohlhagen (an extension for forex options).
3.2 Clearing and Settlement
Exchange-traded derivatives use central counterparties (CCPs) to guarantee settlement.
OTC derivatives often settle bilaterally, though post-2008 reforms require central clearing for many contracts.
3.3 Participants
Hedgers: Exporters, importers, MNCs, institutional investors.
Speculators: Traders betting on short-term price swings.
Arbitrageurs: Exploit mispricing between spot, forward, and derivative markets.
4. Role of Currency Derivatives in Risk Management
4.1 Corporate Hedging
Companies hedge to reduce earnings volatility. For example, Apple Inc. uses currency forwards and options to manage exposure to sales in Europe and Asia.
4.2 Portfolio Diversification
Fund managers hedge international portfolios to ensure returns are not eroded by currency losses.
4.3 Central Bank Intervention
Some central banks use derivatives indirectly to manage currency volatility without outright market intervention.
5. Risks in Currency Derivatives
While derivatives mitigate risk, they carry their own risks:
Market Risk – Adverse movements in exchange rates.
Credit Risk – Counterparty default in OTC forwards/swaps.
Liquidity Risk – Difficulty in exiting contracts, especially in exotic currencies.
Operational Risk – Errors in execution, valuation, or reporting.
Systemic Risk – Excessive derivative speculation (as seen in 2008 crisis) can amplify global financial instability.
6. Regulatory Framework in International Markets
US: Commodity Futures Trading Commission (CFTC) regulates currency futures/options.
Europe: European Securities and Markets Authority (ESMA) oversees derivatives under EMIR (European Market Infrastructure Regulation).
Asia: Singapore (SGX), Hong Kong (HKEX), India (SEBI) have their own frameworks.
Global: Bank for International Settlements (BIS) coordinates reporting and risk control.
Post-2008, G20 reforms emphasized:
Mandatory central clearing of standardized OTC contracts.
Reporting of derivatives trades to trade repositories.
Higher capital requirements for banks dealing in derivatives.
7. Major International Markets for Currency Derivatives
7.1 Chicago Mercantile Exchange (CME)
World’s largest market for currency futures and options (USD, Euro, Yen, GBP, CAD, etc.).
7.2 London
Global hub for OTC forex and currency swaps due to deep liquidity and time-zone advantages.
7.3 Asia-Pacific
Singapore Exchange (SGX): Growing hub for Asian currency derivatives.
India’s NSE/BSE: Offers USD/INR, EUR/INR, GBP/INR contracts.
China: Restricted but gradually opening with RMB futures and offshore CNH markets.
7.4 Emerging Markets
Increasing participation as trade volumes grow (e.g., Brazil, South Africa).
8. Case Studies
Case Study 1: Indian IT Companies
Infosys and TCS earn over 70% of revenue in USD/EUR but report in INR. To stabilize earnings, they actively use currency forwards and options.
Case Study 2: European Sovereign Debt
During the Eurozone crisis (2010–2012), several governments used swaps to manage currency-linked borrowings, highlighting both utility and hidden risks of derivatives.
Case Study 3: Hedge Fund Speculation
George Soros’ famous bet against the British Pound in 1992 (Black Wednesday) used massive currency derivative positions, forcing the UK out of the ERM (Exchange Rate Mechanism).
9. Current and Future Trends in Currency Derivatives
Rising Use in Emerging Markets: As Asia, Africa, and Latin America expand global trade.
Digital Platforms: Algorithmic and high-frequency trading dominate currency futures/options.
Clearing Reforms: Push for greater transparency in OTC markets.
Crypto and Digital Currencies: Bitcoin futures/options and central bank digital currencies (CBDCs) are reshaping forex risk management.
Geopolitical Tensions: Currency derivatives are increasingly used to hedge risks from wars, sanctions, and supply-chain disruptions.
ESG-linked derivatives: Growing alignment with sustainable finance trends.
10. Advantages and Criticisms
Advantages:
Hedging reduces business uncertainty.
Enhances global trade and investment flows.
Provides liquidity and efficient price discovery.
Criticisms:
Over-speculation can destabilize economies.
Complex derivatives can hide risks (as seen in 2008 crisis).
Dependence on clearing houses may concentrate systemic risks.
Conclusion
Currency derivatives are the backbone of modern international financial markets, enabling businesses, investors, and governments to manage risks associated with exchange rate fluctuations. They enhance global trade, promote investment flows, and ensure efficient allocation of capital.
However, they are double-edged swords. When used responsibly, they stabilize earnings, reduce volatility, and promote growth. But when misused, they can fuel financial crises.
As globalization deepens and financial technology advances, currency derivatives will only grow in importance. Regulators, corporations, and investors must balance innovation, risk management, and systemic stability to ensure that these instruments continue to support — rather than destabilize — the global economy.
Healthcare & Pharma StocksIntroduction
Healthcare and pharmaceutical (pharma) stocks represent one of the most vital and resilient segments of global equity markets. Unlike cyclical sectors such as automobiles or real estate, healthcare is a necessity-driven industry—people require medical care, medicines, and treatments regardless of economic ups and downs. This inherent demand creates a unique investment landscape where growth, stability, and innovation intersect.
Pharma and healthcare stocks include a wide variety of companies—ranging from multinational giants like Pfizer, Johnson & Johnson, and Novartis to Indian leaders such as Sun Pharma, Dr. Reddy’s Laboratories, and Cipla. The sector also encompasses hospitals, diagnostic chains, biotech innovators, medical device manufacturers, and health-tech startups.
This write-up provides a deep 360-degree analysis of healthcare & pharma stocks, covering their structure, business drivers, global trends, risks, opportunities, and investment strategies.
1. Structure of Healthcare & Pharma Sector
The healthcare & pharma ecosystem can be broadly divided into:
A. Pharmaceuticals
Generic drugs: Off-patent medicines manufactured at lower costs. (e.g., Sun Pharma, Teva)
Branded drugs: Patented products with high margins. (e.g., Pfizer, Novartis)
Active Pharmaceutical Ingredients (APIs): Raw drug materials, where India and China dominate.
Contract Research & Manufacturing Services (CRAMS): Outsourcing R&D and manufacturing.
B. Biotechnology
Companies focused on genetic engineering, cell therapies, and monoclonal antibodies.
High-risk but high-reward investments (e.g., Moderna, Biocon).
C. Hospitals & Healthcare Services
Hospital chains (Apollo, Fortis, Max Healthcare).
Diagnostics (Dr. Lal PathLabs, Metropolis, Thyrocare).
Health insurance companies.
D. Medical Devices & Technology
Imaging equipment, surgical tools, wearables (Medtronic, Siemens Healthineers).
Digital health platforms and telemedicine providers.
E. Global vs. Domestic Markets
Global players dominate innovation-driven drug discovery.
Indian players dominate generics, APIs, and affordable healthcare solutions.
2. Key Growth Drivers
A. Rising Global Healthcare Spending
Worldwide healthcare spending is projected to cross $10 trillion by 2030.
Ageing populations in developed nations and increasing middle-class healthcare demand in emerging economies fuel growth.
B. Lifestyle Diseases
Diabetes, hypertension, cardiovascular disorders, and obesity are increasing.
Continuous demand for chronic therapy drugs.
C. Patents & Innovation
Innovative drugs with patent protection ensure high profit margins.
Pipeline of oncology, rare disease, and immunology drugs is expanding.
D. COVID-19 Acceleration
Pandemic showcased the sector’s importance.
Vaccine manufacturers, diagnostics, and hospital chains saw exponential growth.
E. Government Policies & Healthcare Access
India’s Ayushman Bharat scheme, US Medicare expansion, and Europe’s universal healthcare systems are pushing accessibility.
F. Digital Transformation
Telemedicine, AI-based diagnostics, robotic surgeries, and wearable devices.
Creates new sub-segments for investors.
3. Risks & Challenges
A. Regulatory Risks
FDA (US), EMA (Europe), and CDSCO (India) have stringent regulations.
Compliance failures lead to import bans, plant shutdowns, and fines.
B. Patent Expirations
Blockbuster drugs lose exclusivity after 10–15 years.
Leads to generic competition and margin erosion.
C. Pricing Pressure
Governments cap drug prices to maintain affordability.
Generic drug prices are constantly under pressure.
D. R&D Uncertainty
Only 1 in 10,000 drug molecules successfully reaches the market.
High R&D costs with uncertain returns.
E. Geopolitical & Supply Chain Issues
China controls key raw materials (APIs).
Any disruption impacts global supply.
4. Global Leaders in Healthcare & Pharma
A. Pharma Giants
Pfizer (US): COVID-19 vaccine, oncology, cardiovascular drugs.
Johnson & Johnson (US): Diversified pharma, medical devices, consumer healthcare.
Novartis (Switzerland): Oncology, gene therapy.
Roche (Switzerland): Diagnostics and cancer treatments.
AstraZeneca (UK): Cardiovascular and respiratory therapies.
B. Biotechnology Leaders
Moderna & BioNTech: mRNA vaccine technology.
Gilead Sciences: HIV and hepatitis treatments.
Amgen: Biologic drugs.
C. Indian Leaders
Sun Pharma: Largest Indian pharma company, strong in generics.
Dr. Reddy’s: APIs, generics, biosimilars.
Cipla: Strong in respiratory segment.
Biocon: Pioneer in biosimilars.
Apollo Hospitals: Leading hospital chain.
Metropolis & Dr. Lal PathLabs: Diagnostics leaders.
5. Market Trends
A. Consolidation & M&A
Big pharma acquiring biotech startups.
Indian firms expanding globally via acquisitions.
B. Biosimilars & Biologics
Biologics (complex drugs made from living organisms) are the future.
Biosimilars (generic versions of biologics) gaining ground after patent expiry.
C. Personalized Medicine
Genetic testing enables customized treatments.
Oncology leading the way.
D. Artificial Intelligence in Drug Discovery
AI reduces time and costs in clinical trials.
Companies like Exscientia and BenevolentAI working with pharma giants.
E. Medical Tourism
India, Thailand, and Singapore attract patients globally due to cost advantage.
Growth in hospital and diagnostic sector.
6. Investment Perspective
A. Defensive Nature
Healthcare is non-cyclical—stable demand even in recessions.
Acts as a hedge in uncertain markets.
B. Growth Potential
Emerging markets like India offer double-digit growth.
Biotech and innovation-driven companies can deliver multibagger returns.
C. Dividends & Stability
Big pharma firms are cash-rich and provide regular dividends.
Stable revenue models for hospitals and insurers.
D. Valuation Metrics
Investors should analyze:
R&D pipeline: Future drug launches.
Regulatory compliance: FDA approvals, audits.
Debt levels & cash flow: Capital-intensive sector.
Market presence: US, Europe, and India exposure.
7. Indian Market Outlook
Pharma exports: India supplies 20% of global generics by volume.
Domestic healthcare: Rising insurance penetration and government spending.
Diagnostics: High growth with preventive healthcare awareness.
Hospital chains: Consolidation and increasing private equity investments.
API manufacturing push: Government incentives to reduce dependency on China.
8. Future Opportunities
Gene Therapy & CRISPR: Revolutionary treatments for genetic disorders.
mRNA Technology: Beyond vaccines, applicable in cancer therapies.
Wearable Health Tech: Smartwatches, glucose monitors, cardiac sensors.
Telemedicine: Remote healthcare becoming mainstream.
AI in Healthcare: Faster drug discovery, predictive healthcare analytics.
9. Risks for Investors
Litigation Risks: Patent disputes, product liability lawsuits.
Currency Fluctuations: Export-driven Indian pharma firms face forex risk.
Competition: Generic wars in the US and EU.
Policy Shifts: Government price controls can reduce profitability.
10. Investment Strategies
A. Long-Term Play
Biotech & R&D-driven pharma are long-term investments (10–15 years).
Examples: Biocon, Moderna, Roche.
B. Defensive Allocation
Hospitals, insurance, and generic pharma are safer bets for portfolio stability.
C. Thematic Investing
Focus on oncology, biosimilars, digital health, or telemedicine themes.
D. Diversification
Spread across global pharma (Pfizer, J&J), Indian generics (Sun, Cipla), and hospitals (Apollo, Fortis).
Conclusion
Healthcare & pharma stocks represent a unique mix of stability, growth, and innovation. The sector is driven by non-cyclical demand, global healthcare spending, lifestyle diseases, and constant innovation in biotechnology. At the same time, it faces challenges like regulatory hurdles, pricing pressures, and patent expirations.
For investors, healthcare and pharma provide defensive positioning in uncertain times and long-term multibagger opportunities in high-growth biotech and digital health. In India, the sector is set to grow rapidly with rising domestic demand, government support, and increasing global market share.
In essence, investing in healthcare & pharma stocks is not just about chasing profits—it is about betting on the future of human health and well-being.

Commodity Market TrendsIntroduction
The commodity market is one of the oldest forms of trade in human history. From ancient barter systems to modern-day electronic exchanges, commodities such as gold, silver, oil, grains, and livestock have always played a central role in global trade. Unlike stocks and bonds, which represent ownership of a company or debt obligations, commodities are tangible goods that people consume, use in manufacturing, or trade for value preservation.
Commodity market trends reflect how prices move over time, influenced by demand, supply, economic growth, geopolitics, climate, and investor behavior. Understanding these trends is vital for traders, investors, businesses, and policymakers because commodities impact everything—from inflation to national security.
In this essay, we’ll explore commodity market trends in detail, covering:
Types of commodities
Factors influencing commodity prices
Historical evolution of commodity trends
Current global trends
Sector-wise commodity insights
Role of technology and trading platforms
India’s role in global commodity markets
Risks and challenges
Future outlook
1. Types of Commodities
Commodities are broadly classified into two categories:
A. Hard Commodities
These are natural resources that must be mined or extracted.
Energy: Crude oil, natural gas, coal, uranium
Metals: Gold, silver, platinum, copper, aluminum
B. Soft Commodities
These are agricultural products or livestock.
Grains: Wheat, rice, corn, barley, soybeans
Cash crops: Cotton, coffee, sugar, cocoa, rubber
Livestock: Cattle, hogs, poultry
Each commodity has unique demand-supply cycles, trading methods, and price drivers, which create distinctive trends.
2. Factors Influencing Commodity Market Trends
Commodity trends are shaped by multiple interrelated factors.
A. Supply and Demand
A poor monsoon can reduce India’s wheat and rice production, pushing prices higher.
Rising industrial demand in China increases the global price of copper and steel.
B. Economic Growth
Strong GDP growth increases energy demand (oil, coal, gas).
Slowdowns reduce consumption and depress prices.
C. Geopolitical Events
Wars in oil-producing regions like the Middle East push crude prices up.
Trade sanctions disrupt supply chains, creating shortages.
D. Inflation and Currency Value
Commodities, especially gold and silver, are seen as a hedge against inflation.
A weaker US dollar generally boosts commodity prices since most are dollar-denominated.
E. Technological Advancements
Shale oil extraction revolutionized US energy supply.
Precision farming and GM crops increase agricultural yields.
F. Speculation and Investment Flows
Commodities are part of hedge funds’ and ETFs’ portfolios.
Heavy speculation can exaggerate short-term price swings.
3. Historical Evolution of Commodity Trends
Commodity markets have evolved through distinct eras:
A. Ancient and Medieval Period
Gold and silver were primary stores of value.
Spices, silk, and cotton drove global trade routes like the Silk Road.
B. Industrial Revolution (18th–19th Century)
Coal became central to powering factories and railways.
Agricultural markets expanded with colonial trade networks.
C. 20th Century
Oil replaced coal as the dominant energy source.
The Bretton Woods system (post-WWII) tied currencies to gold, which influenced commodity flows.
D. 21st Century
Commodities became financialized—futures, options, ETFs.
Climate change, ESG investing, and green energy are reshaping commodity dynamics.
4. Current Global Commodity Market Trends
A. Energy Commodities
Crude Oil – Prices remain volatile due to OPEC policies, US shale production, and geopolitics (Russia-Ukraine conflict, Middle East tensions).
Natural Gas – LNG demand is rising in Asia, especially India and China, while Europe shifts away from Russian supply.
Coal – Despite clean energy policies, coal demand remains strong in emerging markets like India due to electricity needs.
B. Metals
Gold – Functions as a safe-haven asset during inflation, recession fears, or geopolitical tension.
Silver – Dual role as industrial metal and safe haven. Solar panel demand is pushing industrial consumption.
Copper – Known as "Dr. Copper" because it reflects economic health. Demand is surging from EVs, batteries, and infrastructure.
Aluminum & Nickel – Essential in renewable energy technologies and lightweight transport manufacturing.
C. Agricultural Commodities
Grains – Climate change, supply chain disruptions, and fertilizer shortages drive volatility.
Coffee & Cocoa – Affected by weather shocks (El Niño) and global consumer demand.
Sugar & Cotton – Linked to biofuel trends, textile demand, and monsoon performance in India.
5. Sector-Wise Commodity Insights
A. Energy Sector
Oil demand is plateauing in developed countries but surging in Asia.
Renewable-linked commodities like lithium, cobalt, and rare earths are gaining importance.
B. Precious Metals
Gold remains the world’s ultimate crisis hedge.
Silver and platinum are benefiting from the green energy transition.
C. Base Metals
Copper and aluminum are crucial for infrastructure and EV adoption.
Supply disruptions in Africa and South America impact availability.
D. Agriculture
Population growth increases long-term demand for food commodities.
Climate change increases unpredictability—extreme droughts, floods, and pests.
6. Technology and Commodity Trading
Electronic Trading Platforms (MCX, CME, ICE) have made commodity markets global and fast-paced.
AI and Data Analytics help forecast weather impacts, demand patterns, and price trends.
Blockchain improves traceability in agricultural and mining commodities.
Algo-Trading has increased speculative flows and high-frequency trading.
7. India’s Role in Commodity Markets
India is both a major producer and consumer of commodities:
Gold & Silver: India is the second-largest consumer of gold, driven by cultural and investment demand.
Crude Oil: India imports over 85% of its crude needs, making it vulnerable to global price shocks.
Agriculture: Leading producer of rice, wheat, sugarcane, and cotton.
Coal: India is the second-largest coal producer but still imports due to quality mismatches.
Exchanges: MCX (Multi Commodity Exchange) and NCDEX (National Commodity & Derivatives Exchange) are the leading Indian platforms.
Government policies—like MSP (Minimum Support Price), import-export bans, and subsidies—also strongly influence domestic commodity trends.
8. Risks and Challenges in Commodity Markets
Price Volatility – Rapid swings can hurt producers, consumers, and investors.
Geopolitical Tensions – Wars, sanctions, and trade wars disrupt supply chains.
Climate Change – Unpredictable weather patterns affect agriculture and energy demand.
Technological Risks – Cyberattacks on trading platforms and supply chain disruptions.
Regulatory Risks – Changes in taxation, subsidies, and environmental laws affect trade.
9. Future Outlook for Commodity Market Trends
A. Energy Transition
The world is shifting towards renewables, EVs, and green hydrogen.
Demand for lithium, cobalt, nickel, and copper will surge.
B. Digital Commodities
Data, carbon credits, and even water rights may emerge as tradable commodities.
C. Inflation Hedge Investments
Investors will continue to use gold and silver as hedges against economic uncertainty.
D. Agriculture & Food Security
With rising global population (expected 10 billion by 2050), agriculture commodities will remain critical.
Precision farming, vertical farming, and biotech seeds will shape future supply.
E. India’s Growing Role
As one of the fastest-growing economies, India’s demand for energy, metals, and food will strongly influence global trends.
10. Conclusion
The commodity market is the backbone of the global economy, deeply tied to human survival, industrial growth, and financial systems. Its trends are not just numbers on a chart—they reflect global consumption patterns, political events, and technological changes.
In today’s interconnected world, understanding commodity market trends is essential for:
Traders who seek profit from price movements.
Businesses that need raw materials for production.
Governments that must ensure stability and security.
Investors looking for safe havens and diversification.
From gold and oil to wheat and copper, commodities are the foundation of every nation’s economic journey. As we move into a future shaped by green energy, climate change, and digitalization, the role of commodities will only grow stronger.
👉 In summary, the next era of commodity market trends will be defined by energy transition, technological disruption, and geopolitical rebalancing, making it one of the most exciting and unpredictable spaces in global trade.

Cryptocurrency & Digital Assets1. Introduction
In the past decade, finance has seen a revolution that goes beyond banks, stock markets, and traditional currencies. This revolution is called cryptocurrency and digital assets. What started as a niche experiment with Bitcoin in 2009 has now become a global phenomenon worth trillions of dollars. Cryptocurrencies, non-fungible tokens (NFTs), central bank digital currencies (CBDCs), and blockchain-based assets are redefining money, ownership, and trust in the digital era.
To understand this world, we need to cover not only the technical foundation but also the real-world applications, benefits, challenges, and risks. Let’s explore.
2. What Are Digital Assets?
At the core, a digital asset is anything of value stored electronically. This can include documents, music, art, or data. But in financial terms, digital assets refer to assets that exist purely in digital form and can be owned, transferred, or traded.
Examples:
Cryptocurrencies (Bitcoin, Ethereum)
Stablecoins (USDT, USDC)
Security tokens (digital representation of real-world securities)
NFTs (unique digital collectibles/art)
Central Bank Digital Currencies (CBDCs)
Digital assets are usually recorded and verified using blockchain technology, which ensures transparency, immutability, and decentralization.
3. What is Cryptocurrency?
A cryptocurrency is a type of digital asset designed to work as a medium of exchange, store of value, or unit of account. It is secured by cryptography, making it difficult to counterfeit or double-spend.
Key Features:
Decentralization – Not controlled by a single authority like banks or governments.
Blockchain-based – Transactions are recorded on a distributed ledger.
Cryptographic Security – Ensures authenticity and prevents fraud.
Peer-to-Peer Transactions – People can send money directly without intermediaries.
Global & Borderless – Works across countries with internet access.
4. The Origin of Cryptocurrencies
The story begins in 2008 when an anonymous person or group known as Satoshi Nakamoto released a whitepaper:
“Bitcoin: A Peer-to-Peer Electronic Cash System.”
The idea was to create money outside of government control, relying on cryptography and decentralized networks.
In 2009, Bitcoin was launched. It introduced blockchain technology as a transparent ledger, enabling trust without banks.
From there:
2015: Ethereum introduced smart contracts.
2017–2018: ICO (Initial Coin Offering) boom.
2020–2021: Rise of DeFi (Decentralized Finance) and NFTs.
2022–2023: Market corrections, regulations, and institutional adoption.
2024 onward: Growth of CBDCs, tokenization, and AI integration.
5. How Cryptocurrencies Work
To understand cryptocurrencies, let’s break down the components:
a) Blockchain Technology
A blockchain is a decentralized digital ledger that records all transactions.
Each block contains transaction data, a timestamp, and a cryptographic hash.
Once added, blocks cannot be altered (immutability).
b) Mining & Consensus Mechanisms
Proof of Work (PoW): Used by Bitcoin. Miners solve puzzles to validate transactions.
Proof of Stake (PoS): Used by Ethereum 2.0. Validators stake coins to secure the network.
Other mechanisms: Delegated Proof of Stake, Proof of Authority, etc.
c) Wallets & Keys
To own cryptocurrency, you need a digital wallet.
Wallets use private keys (your password to access funds) and public keys (your address to receive funds).
d) Transactions
When you send Bitcoin, your transaction is broadcasted to the network.
Miners/validators verify and record it on the blockchain.
Once confirmed, it becomes permanent.
6. Types of Cryptocurrencies
Bitcoin (BTC):
First cryptocurrency, digital gold.
Mainly used as a store of value.
Ethereum (ETH):
Introduced smart contracts and decentralized applications (dApps).
Backbone of DeFi and NFTs.
Stablecoins (USDT, USDC, DAI):
Pegged to stable assets like the US dollar.
Reduce volatility, widely used in trading.
Altcoins (Litecoin, Ripple, Cardano, Solana, etc.):
Offer various improvements or innovations over Bitcoin/Ethereum.
Utility Tokens:
Used within specific platforms (e.g., Binance Coin, Chainlink).
Security Tokens:
Represent ownership in real assets (stocks, real estate).
Non-Fungible Tokens (NFTs):
Unique digital items (art, music, in-game assets).
7. Non-Fungible Tokens (NFTs)
NFTs became mainstream in 2021 when digital art sold for millions.
Unlike cryptocurrencies (fungible, interchangeable), NFTs are unique and indivisible.
Examples:
Digital artwork (Beeple’s $69 million sale)
Collectibles (NBA Top Shot)
In-game items (Axie Infinity)
Music rights & virtual real estate
NFTs represent a revolution in digital ownership.
8. Decentralized Finance (DeFi)
DeFi is a financial ecosystem built on blockchain, without intermediaries like banks.
Key elements:
Lending & Borrowing Platforms (Aave, Compound)
Decentralized Exchanges (DEXs) (Uniswap, PancakeSwap)
Yield Farming & Liquidity Mining
Synthetic Assets & Derivatives
Benefits:
Open to anyone with internet.
Transparent and programmable.
Higher returns compared to traditional banking.
9. Central Bank Digital Currencies (CBDCs)
Governments are developing their own digital money, called CBDCs.
Unlike cryptocurrencies, CBDCs are centralized and backed by national banks.
Examples:
China’s Digital Yuan (e-CNY)
India’s Digital Rupee (pilot launched by RBI)
European Union exploring Digital Euro
CBDCs aim to combine the efficiency of digital assets with the trust of government money.
10. Advantages of Cryptocurrencies & Digital Assets
Decentralization – Reduced dependency on banks/governments.
Fast & Cheap Transactions – Cross-border payments in seconds.
Financial Inclusion – Access for unbanked populations.
Transparency – Blockchain records are public and verifiable.
Ownership Control – You truly own your assets (self-custody).
Innovation & Programmability – Smart contracts enable new business models.
Global Access – Works anywhere with internet.
Potential for High Returns – Many investors see massive growth.
Conclusion
Cryptocurrencies and digital assets are more than just speculative investments—they represent a new paradigm for money, ownership, and trust in the digital age. While risks exist, the opportunities for innovation, financial inclusion, and global economic transformation are immense.
From Bitcoin’s vision of decentralized money to NFTs redefining art and CBDCs reshaping government-issued currency, the world of digital assets is evolving rapidly. We are witnessing a once-in-a-generation shift that could impact how humans trade, invest, and interact for decades to come.

80% Of Time - A Trading Edge You Don't Want To MissDo you want to know why trading with median lines, also known as pitchforks, can be so successful? It’s simple:
Prices swing from one extreme back to the middle.
From the middle, they often swing to the other extreme.
What do we see on the chart?
- The upper extreme
- The center
- The lower extreme
So far, so good.
Now let’s follow the price and learn a few important rules that belong to the rulebook of median lines/pitchforks, and with which you can make great trades.
Point 1
The price starts and is sold off down to…
Point 2
...and from there starts to rise again, up to…
Point 3
...which is the center. And here we have a rule that is very important and one that you need to be aware of in trading to be successful:
THE PRICE RETURNS TO THE CENTER IN ABOUT 80% OF ALL CASES
If we know this, then we can stay in a trade with confidence.
Point 4
The price climbed even higher but missed the upper extreme.
This is the “Hagopian Rule” (named after the man who discovered it).
And the rule goes: If the price does not reach the next line (upper extreme, lower extreme, or center), then the price will continue moving in the opposite direction from where it originally came.
Phew...that’s a mouthful ;-)
But yes, we actually see that the price does exactly this.
From point 4, where the price missed the upper extreme, the price not only goes back to the center but continues and almost reaches the lower extreme!
Now if that isn’t cool, I don’t know what is!
And what do we have at point 5?
A "HAGOPIAN"!
What did we just learn?
The price should go higher than the center line.
Does it do that?
Oh yes!
But wait!
Not only does the Hagopian Rule apply. Remember?
"The price returns to the center line in about 80% of the cases."
HA!
Interesting or interesting?
So, that’s it.
That’s enough for now.
Now follow the price yourself and always consider which rule applies and whether it’s being followed.
How exactly do you trade all this, and what are the setups?
...one step at a time.
Don’t miss the next lesson and follow me here on TradingView.
Wishing you lots of success and fun!
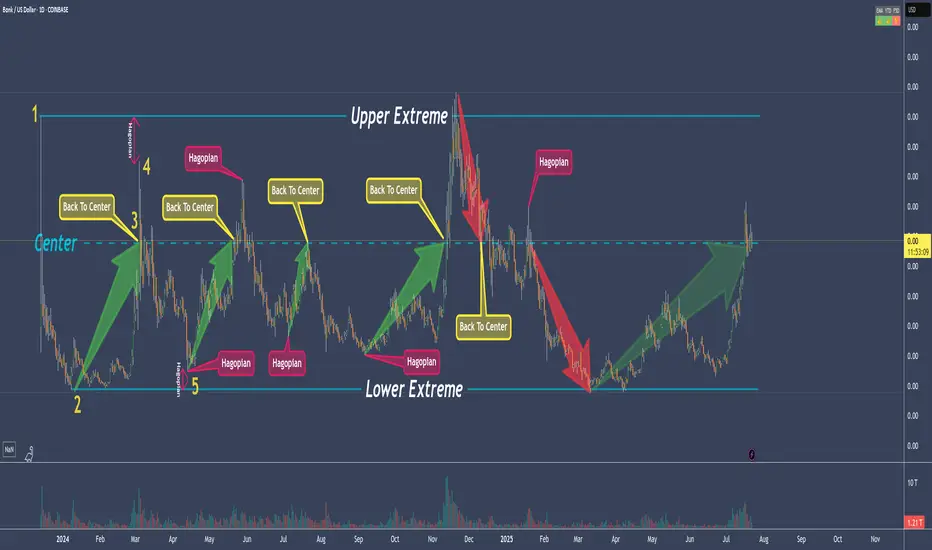
Mastering the MACD - How to use it in trading?The MACD, or Moving Average Convergence Divergence, is one of the most widely used technical indicators in trading. It was developed by Gerald Appel in the late 1970s and is designed to reveal changes in the strength, direction, momentum, and duration of a trend in a stock's price. At its core, the MACD is a momentum oscillator, though it is commonly plotted as a line chart rather than the traditional bounded oscillators like the RSI. Despite being unbounded, traders use the MACD primarily to identify potential buy and sell signals.
What will be discussed?
- How does the MACD work?
- How to use the MACD in trading?
- Divergences
- Conclusion
How does the MACD work?
The MACD is calculated by subtracting the 26-period Exponential Moving Average (EMA) from the 12-period EMA. The result of this calculation is the MACD line. A nine-period EMA of the MACD line, known as the signal line, is then plotted on top of the MACD line. The third component is the MACD histogram, which represents the difference between the MACD line and the signal line. The histogram gives traders a visual cue about momentum: when the histogram bars are growing in height, momentum is increasing in the direction of the MACD line; when they shrink, momentum is slowing down.
How to use the MACD in trading?
Understanding how to use the MACD in trading requires some interpretation of the relationships between these components. One of the primary signals traders look for is a crossover between the MACD line and the signal line. When the MACD line crosses above the signal line, it is considered a bullish signal, suggesting that it might be a good time to buy. Conversely, when the MACD line crosses below the signal line, it indicates a bearish signal and potentially a good time to sell. These crossovers tend to be more significant when they occur below or above the zero line, which is where the MACD and signal line are equal. A crossover below the zero line followed by a move above it could signal the beginning of an uptrend, while a crossover above the zero line followed by a move below it might signal a downtrend.
Divergences
Another important application of the MACD is identifying divergence between the MACD and the price action of the asset. Divergence occurs when the price is moving in one direction and the MACD is moving in the opposite. For instance, if the price makes a new high but the MACD forms a lower high, it can be a warning sign that the upward momentum is weakening and that a reversal could be on the horizon. Similarly, if the price hits a new low but the MACD makes a higher low, it might suggest a potential bullish reversal.
Conclusion
In summary, the MACD is a versatile and powerful indicator that helps traders analyze the momentum and direction of a market trend. Its ability to provide both trend-following and momentum signals makes it a valuable tool in a trader’s toolkit. While it is not a standalone solution, when used properly and in conjunction with other strategies, the MACD can greatly enhance the accuracy and confidence of trading decisions.
Thanks for your support.
- Make sure to follow me so you don't miss out on the next analysis!
- Drop a like and leave a comment!

Can AI Forge America's Next Shield?Palantir Technologies finds itself strategically positioned at the forefront of a potentially transformative U.S. defense initiative, the "Golden Dome" missile defense system. As a crucial partner in a consortium reportedly led by SpaceX and including Anduril Industries, Palantir is a leading contender for significant involvement in this multi-billion-dollar project. Golden Dome aims to establish a next-generation, networked shield against advanced missile threats, emphasizing rapid development and integration of space-based sensors and diverse defensive capabilities, moving beyond traditional procurement timelines.
Within this ambitious framework, Palantir's role leverages its core expertise in AI and large-scale data analytics. The company is anticipated to provide the essential software platform required to process and interpret data from potentially hundreds or thousands of tracking satellites, creating real-time situational awareness and enabling coordinated responses across the complex defense network. This involvement could also benefit from innovative procurement approaches, such as SpaceX's proposed subscription model, potentially securing stable, long-term revenue streams for Palantir.
Recent successes underscore Palantir's readiness for such a demanding role. The rapid adoption of its Maven Smart System by NATO validates its AI capabilities in high-stakes military environments, while its partnership with Vatn Systems demonstrates the utility of its platform in scaling and modernizing defense manufacturing. Securing a key position in the Golden Dome would represent a major strategic victory, solidifying Palantir's ascent as a disruptive force in the defense technology sector and signaling significant growth potential as it helps shape the future of national security.

Gold Target $4054 Year 2025-2026 With Reasons & 4$rules.1st Tp completed at 3341
2nd Tp 3437
3rd Tp 3622
4th Tp 3747
Final target is $ 4054 for Year 2025 to 2027
Below the Base line mentioned in chart will be the Seller profit zone which is marked as 1st Support, 2nd Support, 3rd Support & 4th Major Support.
Current Major reasons mentioned in the chart and future will be running of food, drinking water crisis and health issues will remain on high alerts (after covid 19 and pollution issues) and Insurance companies profits will be on Top of every Monthly trading results.

EURUSD LIVE TRADE AND EDUCATIONAL BREAKDOWN EUR/USD remains offered and below 1.1300
EUR/USD is feeling the squeeze, revisiting the area below its key 1.1300 support as the US Dollar gains extra momentum on Tuesday. Mixed domestic data hasn't done the Euro any favours either.
