Learntotrade

Week 37/52. Trade #2. USDCAD expanding flat over for more upsideSee the pattern lines on my chart. Let it correct back a little and then I will look to go long. Easily equal top, perhaps a little more.

Week 37/52. BTCUSD, How its lookingI see a lot of analysis on tradingview about the way BTC is looking, right now here is mine. Small upside before slightly bigger downside. Watch and see :)

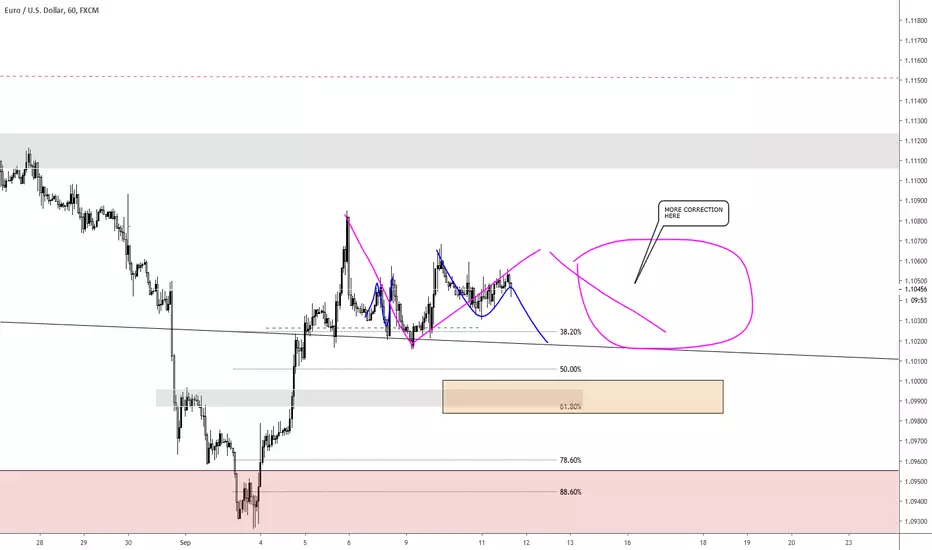
Week 37/52. EURUSD Correction build up for more upsideThis one looks like it will take a while to build up. Unsure when it will be ready. Just watching...
GOLD (NEW LOW) (Right shoulder potential)Short term fall to 1492 area. Then 1533 area for a right shoulder formation.

GOOD OPPORTUNITY-LONG COVERS-STRONG LEVELWonderful classic setup- hyper growth facing a strong level!
I do not care about the fundamentals. I just know, that facing a good level is a great opportunity for people to cover their longs and take profit.
So, unless we see an instant breakout, and the price stops at the level, people will start covering parts of their positions, and the big buyer will stop being so aggressive, hoping to get more volume at this level!
Basic Technicals! All you need is a chart!
probability of the trade is about 50%, with the risk reward being over 1:3
GOOD OPPORTUNITY!

Bollinger confirms with price actionHow do you know if a reversal is likely to take place on support?
1. The bottom bollinger is pinned on a support level
2. Price action buy signal
This setup is a bit more complex because of the resistive trend line drawn, once that breaks its adios!
Don't invest what you can't afford to lose. This is not investment advice. Subjective view/report of a financial product only.
You can learn price action trading at no cost. Join my mailing list to receive more information zc.vg
Join me in Forex Bootcamp for live updates using the link below.
DISCLAIMER
All information published within this website is purely for educational purposes and offers no guarantees. Profit Fx, Forex Bootcamp and any of its associates cannot be held responsible for any trades that you have executed in any way whatsoever. Please familiarize yourself with the relevant risks involved when trading forex, CFD’s and other products. Any trading is done solely at your own risk. Profit Fx, Forex Bootcamp and any of its associates are in no way employed by any broker or any other legal entity. All information published within this website does not constitute advice, but rather objective information about a financial product and analysis or report of a financial product.

LITECOIN DOUBLE CONFIRMATION MASSIVE SHORT OPPORTUNITYBOTH head and shoulders AND breakout below a serious level after a descending triangle(as a part of head and shoulders), all signaling a massive short opportunity, after a pullback to the level!
Only a tiny stop needed, while the gains are massive! That is where the beauty of SIMPLE technical analysis is seen!
More indicators=more dust into the eyes! The chart and the power of your mind is ALL you need!

GBPUSD SHORT-Long wick formation on support suggests going long until 1.22040 and rejection of TL back down.. or market re-opens and pushes through support to continue short.
This coincides with my EURGBP analysis, as GBP loses its value, we'll see the opposite for EURGBP.

Sell signal from price actionThe engulfing bar is a great signal from price action. Notice the inside bar false breakout pattern on D1 time frame.
This is a good example where the support was broken and tested from the under side as resistance and a sell signal from price action completed.
Don't invest what you can't afford to lose. This is not investment advice. Subjective view/report of a financial product only.
You can learn price action trading at no cost. Join my mailing list to receive more information zc.vg
Join me in Forex Bootcamp for live updates using the link below.
DISCLAIMER
All information published within this website is purely for educational purposes and offers no guarantees. Profit Fx, Forex Bootcamp and any of its associates cannot be held responsible for any trades that you have executed in any way whatsoever. Please familiarize yourself with the relevant risks involved when trading forex, CFD’s and other products. Any trading is done solely at your own risk. Profit Fx, Forex Bootcamp and any of its associates are in no way employed by any broker or any other legal entity. All information published within this website does not constitute advice, but rather objective information about a financial product and analysis or report of a financial product.


EURUSD LONGThere's a lot going on here.
-Bullish Pin bar rejects 1.10650 support level and weekly trend line.
-The poorly circled area (my bad) shows shift in momentum past the previous swing.
-The exchange rate retraces 78.6% on the support that price most previously rejected.
Looking to go long ya dun know.

GOLD (CORRECTION POSSIBILITY)In relation to my previous idea, I'm still in agreement that the overall outlook is bullish and Gold will rise to 1560 and beyond, however due to the rise of USD and a 50% retracement of Gold's current price, I assume price 'may' break support to find the 1480 usd level before turning around. (May is the operative word).

Quick Tip for Traders: (Please Read)In the past I've often left trades and forgotten I had them open.
It's ALWAYS ALWAYS ALWAYS IMPORTANT to place a Stop Loss and Take profit, for every trade you place, especially if you Day/intraday/Swing & Position trade. I don't often scalp and if I do I'm usually in and out very quickly in around 10-15 minutes.
Now lets say you place a trade, entry after candle close, from a level of support or resistance, test/re-test, pullback, breakout etc.
Main priority is to establish the risk which I either make tight which is dependent on the trading environment (Trending) or if I'm going to hold the trade for a long time then SL below previous low. Followed by how much profit to take. Let's say the market is likely to increase 200 pips, I personally would make sure my TP is is around 20 pips under.
Then, for joining the trade, I make sure almost every trade is made on either 1 hour chart or 15 minute, because pullbacks are more defined if you're able to establish the trend. I only use the 5 minute chart for re-entry if I've missed an opportunity.
If I entered at 1.20514, I would be in around 60 pips profit. The beginner idiot me would have left the trade and done something else.
It's important to establish if you're in profit, pips are like points that you score in a game. You play tactically and defensively to score as many points as possible, so if you place your SL at say 30 pips in profit, if the market turned on you, you'd close out in profit rather than a loss, in which case you'd now be running a risk free trade.
Obviously, as the pips stack up, naturally you'd increase your SL in profit as well.
So I hope this tip is helpful and improves your trading and limits your losses.
Have a blessed day!

GBPJPY (IDEA)If the exchange happens to
re-test or retrace and make a Higher Low, I'd be looking to go long.
I understand price is currently under the EMA, but looking at the weekly & daily for confluence, price has tested a major level of support. So I'd assume based on previous exhaustions of price, this is a potential reversal point for GBPJPY.


GBPUSDFollowing the brief sell off the week before, sellers dipped their toes towards 1.2000 and failed
Buyers spent all last week slowly pushing though and break through two levels (marked Resistance Level 1 and 2 on the chart).
Seasonal wise, we have approached a point where the weighted and all-time seasonal trends diverge
Given how oversold GBP is on all the charts, I will continue to look for intraday buy setups (mainly in the crosses) ensuring to trail stop losses tightly
The COT positioning is such that all pairs are gearing for a massive short squeeze. A clean break of Resistance level 3 and expect the flood gates to open. This is also the area where to take the safest buy trade

DXY LongBuyers made a break for it early last week following a period of consolidation
Looking across the major charts, the move up is more to do with EUR weakness rather than dollar strength
Expect a continuation to the upside with the EURUSD and possibly USDCHF charts as the best ways to buy dollar
Should price break the August Swing High then look to target the Monthly R1 Pivot

USDCAD H&S (Right Shoulder)Price tests the support zone and looks like it's going to form a pin bar. If price does remain above support, it would confirm my prediction that price will form a H&S pattern.
On the 1H chart, we can see the H&S more clearly the previous test showed a bullish engulfing candle and on the current test of support we see another candlestick pattern on the support:
The exchange rate on the the daily chart also shows no signs of making a new high:

EURGBP, bears in bound.. So we have a simple:
-break of upward channel
-Market exhaustion
-Momentum change
-Bearish Divergence
Let's see what happens..

Who am I? Identify who you are. (USDCAD short)This entire time I've been trading, I've done my own analysis, I've bagged bare £'s, but if you go to my previous analysis's, bmt I'm talking like some next articulated professional don. I trade from my bedroom not for some bank, my analysis is simple and should be easy to read and understand. It's kinda mad now because I have the mindset of a trader, I tend to have this new trading lingo but more time I'm just talking about a couple of lines and a few patterns and how price relates in a certain environment, I also think of myself as this trader and that's it like there's no more and only live as a trader but tend to forget who I am. I forgot my personality and what type of person I am & tbh I think knowing who you are will help you identify what type of trader you are as well, like they're both linked if ygm.
Coming to the realisation, trading is a skill, that shouldn't take over your whole life. It's a lucrative income that when you know how to do it, calm. Money come long with practice. Make time for other things as WELL!
Just airing my thoughts, have a blessed day my G's!

