EUR/USD - Outlook (LTF ranging market)🔥 EUR/USD Outlook Breakdown 🔥
Let’s decode this clean structure — multi-time-frame style with a punch of trader slang 👇
🧭 Weekly Timeframe
We’re chilling just under a long-term bearish resistance trend, and the last few weeks show clear compression beneath that line.
The weekly breakout candle couldn’t sustain upside, hinting sellers are still lurking.
Price holds under 1.1800, keeping HTF (higher-time-frame) structure bearish.
➡️ Eyes on the 1.1500–1.1450 zone as next liquidity grab if momentum kicks in.
📆 Daily Timeframe
Daily shows a ranging market between 1.1750 resistance and 1.1550 support.
We saw a BOS earlier in the structure, but bulls couldn’t follow through.
Multiple rejections from the supply block confirm short-term hesitation.
The support trendline is hanging on — but if it snaps, expect the cascade to begin.
Targets line up clean:
🎯 Target 1: 1.1400
🎯 Target 2: 1.1150
🎯 Target 3: 1.1000
⏰ 8H Timeframe
On the 8H, we’re playing ping-pong inside that same range.
Price grabbed the BSL (Buy-side Liquidity) up top and retraced to the mid-range demand.
Both BH zones are acting as intraday traps — classic indecision setup.
Until we break out clean, expect chop.
➡️ However… here’s the key line:
“HTF supports bearish price action although STF is currently ranging giving unclear direction. HTF will take control.”
That means we’re likely setting up for a fake bullish pop before a strong bearish drive, once HTF order flow dominates.
🎯 Trade Idea
Bias : Bearish (waiting for HTF dominance)
Setup : Sell the fake-out above range highs or on break & retest of 1.1550 support
Targets : 1.1400 → 1.1150 → 1.1000
Invalidation : Daily close above 1.1750
Gameplan : Stay patient — HTF flow will win.
⚡ Summary
EUR/USD is stuck in a rangey mess, but the bigger picture screams bearish.
When HTF takes back control, expect a breakdown toward 1.1400+ zones.
Shorts will be the move once that range floor cracks.
Level

USD/CHF - Outlook Breakdown🔥 USD/CHF Outlook Breakdown 🔥
Let’s unpack this setup across the timeframes — clean and simple trader talk 👇
🧭 Wee kly Timeframe
Price is squeezing tight within a descending channel, holding under that key 0.8050–0.8100 supply zone.
We’ve seen multiple rejections there, confirming strong seller control.
Structure-wise, it’s still bearish — last week’s BOS (Break of Structure) sealed the lower bias.
➡️ Expect continuation lower unless we see a weekly candle close above 0.8050.
📆 Daily Timeframe
Price had a reaction from the second wave of supply, tapping into the daily zone around 0.8050 before rejecting.
The move broke minor daily structure to the downside, confirming bearish order flow.
We’re now hovering near a support shelf ~0.7920, but the context still favors shorts while below that daily zone.
➡️ Next clean liquidity pocket sits near 0.7820–0.7850.
⏰ 8H Timeframe
Here’s where the detail shines.
We’ve got a nice 5-wave internal structure forming:
(1) BOS confirming shift to bearish flow
(2) Pullback into 8H BH zone (premium area)
(3) Sweep of local SSL (liquidity grab)
(4) Retest of 71% fib zone (perfect premium fill)
(5) Targeting external HTF SSL (around 0.7820)
Currently retesting that mini 8H supply (0.7940–0.7960).
If it holds — 💣 expect the drop to continue towards 0.7820.
🎯 Trade Idea
Bias: Bearish
Sell Zone: 0.7940–0.7960 (retest of 8H supply / 71% fib)
Targets : 0.7850 → 0.7820
Invalidation: 0.8000 (clean break & close above)
Bonus Tip: Watch for a lower-TF liquidity sweep before short entries for cleaner confirmation.
⚠️ Summary
USD/CHF still sits in a tight bearish squeeze under strong higher-timeframe supply.
Until bulls reclaim 0.8050, the path of least resistance = downside.
Next major magnet: 0.7820 liquidity pool.

BTC vs 116.7k–118k: breakout or FOMC rejection?__________________________________________________________________________________
Market Overview
__________________________________________________________________________________
BTC is pinned below the 116.2k–118k supply after rebounding from ~107k, defending the 115.16k pivot. It’s a range-to-break with elevated intraday volumes against a cautious macro backdrop.
Momentum: Range with a mild bullish tilt 📈 while 115.16k holds; a clean breakout needs > 116.74k.
Key levels:
- Resistances (4H/12H/D) : 116.18k–116.74k · 118.0k–118.8k · 124.28k (D).
- Supports (2H/4H/W) : 115.16k–115.20k · 114.16k · 111.97k.
Volumes: Normal on 1D; very high on 1H/30m/15m — a catalyst for a box breakout from 115.2k–116.2k.
Multi-timeframe signals: 1D/12H = Up; 6H/4H/1H = NEUTRAL BUY above 115.16k; 2H = NEUTRAL SELL — a close above 116.74k adds upside conviction; losing 114.16k reopens 111.97k.
Risk On / Risk Off Indicator: NEUTRE VENTE — a slight risk-off stance that contradicts the tactical bullish momentum; demand confirmations and smaller size.
__________________________________________________________________________________
Trading Playbook
__________________________________________________________________________________
Strategic context: Higher-timeframe uptrend (12H/1D) but facing a tight 116.2k–118k supply wall — favor staged execution and confirmed breakouts.
Global bias: Slight long bias while 115.16k holds; higher-timeframe invalidation on a clean daily close < 111.97k.
Opportunities:
- Long on breakout: Close/retest held > 116.74k aiming 118k/120k.
- Tactical “buy-the-dip”: Reclaim of 115.20k after a sweep, stop below 114.16k.
- Tactical short: Rejection at 116.7k–118k OR 30m/1H breakdown < 114.75k targeting 114.16k then 111.97k.
Risk zones / invalidations:
- Break below 114.16k invalidates intraday longs and opens 111.97k.
- Strong reclaim > 116.40k–116.74k invalidates rejection shorts.
Macro catalysts (Twitter, Perplexity, news):
- FOMC: 25 bps cut widely expected; dot-plot and presser = volatility triggers; “sell-the-news” risk.
- US Retail Sales (pre-Fed): could tilt the box breakout.
- Softer China data: growth headwind; keeps risk appetite uneven.
Action plan:
- Long Plan : Entry 115.30–115.90 (reclaim/breakout) · Stop 114.16 · TP1 116.18 · TP2 116.74 · TP3 118.00 · R/R ≈ 1.5–3.0.
- Short Plan : Entry 116.10–116.70 (rejection) or < 114.75 (breakdown) · Stop 116.90–117.00 (rejection) / 115.17 (breakdown) · TP1 115.16 · TP2 114.16 · TP3 111.97 · R/R ≈ 1.5–2.5.
__________________________________________________________________________________
Multi-Timeframe Insights
__________________________________________________________________________________
Higher timeframes lean up, but the supply band at 116.2k–118k caps momentum.
1D/12H: Uptrend, compressing below 116.7k; a daily close > 118k would open 120k.
6H/4H/1H: Active range 115.16k ↔ 116.18/116.74k; buy-the-dip works above 115.16k if volumes confirm; intraday is whip-prone.
2H/30m/15m: 115.16k is the hinge; very high volumes create wicks — wait for clean retests; ISPD/MTFTI favor scalps while 115.16k is defended.
Key divergence: Risk On / Risk Off Indicator = NEUTRE VENTE vs MTFTI Up — keep size modest and demand follow-through post-break.
__________________________________________________________________________________
Macro & On-Chain Drivers
__________________________________________________________________________________
FOMC is the key macro catalyst in a hesitant risk-on regime, while on-chain/flows remain more subdued than euphoric phases.
Macro events: 25 bps cut expected; dot-plot and Powell Q&A as triggers; “sell-the-news” possible. US Retail Sales can pre-position flows; softer China data is a growth headwind.
Bitcoin analysis: Pressing the upper band (116.4k) and 116.7k–118k supply; a clean close above 118k opens >120k; a decisive loss of 115k reopens 114.16k → 111.97k.
On-chain data: ETF flows declining, derivatives more influential; range 110k–116k — sustained holds above 114k attract flows; below 108k raises HTF downside risk.
Expected impact: Macro/on-chain mix argues for “confirmation first, size second”; it supports a cautious bias until > 116.74k breaks with volume.
__________________________________________________________________________________
Key Takeaways
__________________________________________________________________________________
BTC is coiling just below 116.7k–118k into FOMC week.
- Trend: Higher-timeframe bullish but capped; slight risk-off background (Risk On / Risk Off Indicator = NEUTRE VENTE).
- Prime setup: Confirmed breakout > 116.74k (retest held) toward 118k/120k; alternatively, a break < 114.16k puts 111.97k back in play.
- Macro: FOMC is well priced — first move can be a head fake.
Stay disciplined: seek confirmations and retests, scale in tranches, and let the market show persistence. ⚖️

DSYNC/USDT NEW INCREASE VOLUMEDSYNC/USDT NEW INCREASE VOLUME
New upcoming volume, that's what the trend data shows, we will follow this coin with updates by confirmations.

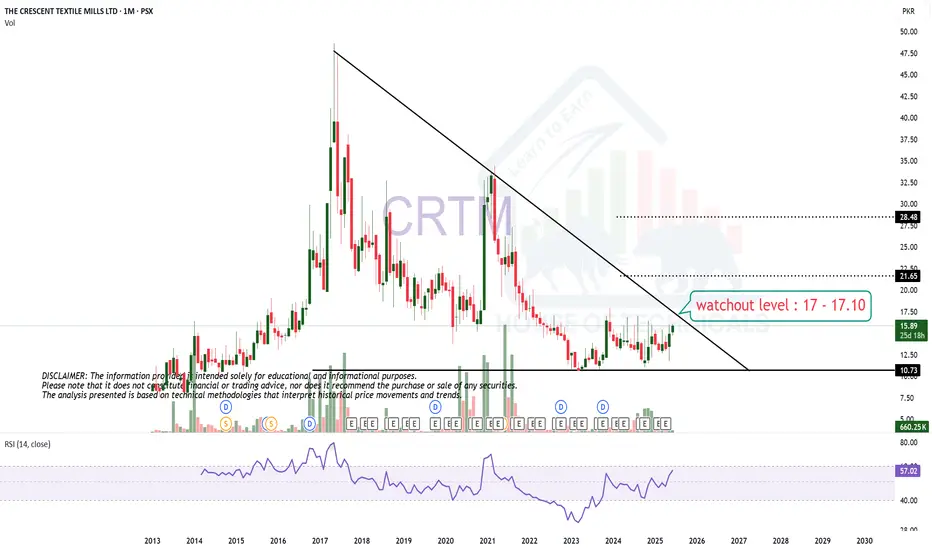
Watchout LevelWatch out level for CRTM is around 17 - 17.10 which is actually a Strong Resistance point.
Crossing & Sustaining this level will lead it towards 21 initially.
SHIB levelI have been watching this level on SHIB and it has been holding for a while. I think it's a good level with potential of something big.

The IWM is sitting at critical support!!!On Friday, the IWM broke through a multi year support line (beige) and closed below a multi year parallel channel. Thankfully, it found support at its 200 day MA. If the IWM cannot recapture the inside of the parallel channel this week and confirms a close below the 200 day MA - watch out below. This should be on every one’s watch list this week because where the small caps go - every other risk asset will follow!!!

ADA NEXT RUN
according to pattern of cycle that how fall and rise to new levels , we can have same pattern including double bottom and breaking resistance levels and reaching to new prices .
ex cycle remained 4 months and we expect new cycle done in 3 or 4 months and reaching to 12$

POPCAT/USDT NEW INCREASE VOLUMEPOPCAT/USDT shows the low time frame possibility for new volume which can affect the price for an uptrend. ( depend all on high chance) There are no guarantees in the markets.
The new increase volume updates always start with interest if there is a confirmation to follow and if there is a building with a hold for a time.
90% of coins this time are not building coins. Some % also show a start fake trend and return to where it started. time frame confirmation + high levels building is important for a healthy coin.
POPCAT known when is the right moment that the volume is higher than normally coins at same range.

New Key Level formationOANDA:EURCAD
the blue horizontal line above symbolizes a new Key Level.
Resistance Key Level, a.k.a. "KUS1".

IOTX TREND BREAKIOTX has a good chance to break in the coming time since the IOTX has at this moment, is building a view that could show interesting results soon.
We will follow IOTX for the possibility of breaking in the coming times.

simple horizontal support levelprice showing strong rejection once again on strong horizontal support level 1.07234
before big news usa cpi

GOLD|Important areas of supply and demandHello friends, I hope you are well.
We have the gold chart in the one-hour time frame.
Yesterday we said that we will wait if the support zone is broken down, the next target is the zone (2005-2008).
Now in this area, with the formation of candlestick patterns, it has moved upwards.
The areas that are important for us are the bottom of the previous broken area (2013) and the next area of the origin of the downward aggressive movement, i.e. the price range (2024-2028) for sell positions.
If we lose the support area (2008-2005), our next target is the support area (1990-1995).

1:18!KWH's Journal Entry #47
"Timing"
A. Which session is being traded?
—North America! (8AM-11AM)
"Level"
B. Which key level is price trading from?
—Week Low!
"Behavior"
C. What behavior is price exhibiting at the key level?
—Star!
Conditions are met!
Place the position where most optimal!

1:19!KWH's Journal Entry #46
"Timing"
A. Which session is being traded?
—North America! (8AM-11AM)
"Level"
B. Which key level is price trading from?
—Week Low
"Behavior"
C. What behavior is price exhibiting at the key level?
—Star!
Conditions are met!
Place the position where most optimal!

1:18!KWH's Journal Entry #44
"Timing"
A. Which session is being traded?
—North America! (8AM-11AM)
"Level"
B. Which key level is price trading from?
—Equilibrium!
"Behavior"
C. What behavior is price exhibiting at the key level?
—Star!
Conditions are met!
Place the position where most optimal!

1:10!KWH's Journal Entry #44
"Timing"
A. Which session is being traded?
—North America! (8AM-11AM)
"Level"
B. Which key level is price trading from?
—00!
"Behavior"
C. What behavior is price exhibiting at the key level?
—Engulfing!
Conditions are met!
Place the position where most optimal!

1:10!KWH's Journal Entry #43
"Timing"
A. Which session is being traded?
—North America! (8AM-11AM)
"Level"
B. Which key level is price trading from?
—00!
"Behavior"
C. What behavior is price exhibiting at the key level?
—W Pattern! (C)
Conditions are met!
Place the position where most optimal!

1:5!KWH's Journal Entry #42
"Timing"
A. Which session is being traded?
—North America! (8AM-11AM)
"Level"
B. Which key level is price trading from?
—50!
"Behavior"
C. What behavior is price exhibiting at the key level?
—M Pattern! (C)
Conditions are met!
Place the position where most optimal!

GOLD → The fall continues. Target 1828, 1812 and 1800OANDA:XAUUSD has been making a new downward jump since the opening of the session on Monday. The strong distributive move continues. The price is approaching an important area
The chart shows an important liquidity area, but not the final one (1800). At the moment I am interested in the 1828-1812 area. The nearest support line may be tested soon, followed by a correction before further decline. The strong bearish trend continues in the market on the back of TVC:DXY strengthening. ISM Manufacturing PMI & Prices are released today, as well as FED Chars Powell speaks. It is worth paying attention to these releases. From the technical analysis point of view, I will wait for a bounce from 1828 towards the nearest resistance to increase liquidity, after which the price will continue another decline towards 1812 and 1800. The moving averages are showing a strong trend and there is a strong signal on D1
Support levels: 1828, 1812
Resistance levels: 1846
I expect a continuation of the fall in the medium term. Before the further fall, a pullback may be formed, watch the price reaction to the marked levels
OANDA:XAUUSD COMEX_MINI:MGC1! COMEX:GC1! OANDA:XAGUSD COMEX:SI1! TVC:DXY
Regards R. Linda!

Total (Crypto Market Cap) 1W until end of 2023Price is expected to move sideways until mid October between 1T and 1.115T
Starting mid October scenario is splitting into two: Optimistic and Realistic. End of October will show which scenario takes place.
Optimistic scenario includes prolonged sideways movement until start of November and consequent steady growth until the end of 2023.
Realistic scenario implies breakdown below 1T bottoming no lower than 922B and ranging there until February with possible false breakout on the edge of 2023 and 2024. Steady growth is expected no earlier than mid February 2024.
In my humble opinion, I tend to err to Realistic scenario and it is more aligned with my view of Others.

Impulses and zones 2In the first part, we got two zones from the impulse: Global, in it we will look for a level for selling and buying! and Control, now we set the impulse 32401.86-29221.55 in this zone, and again we get two zones: Control and Local 17613.94-14474.71
and Buy Level 16216.72
At this level, on a daily timeframe, you can close a sell and open a buy!
In the third part we will go down 4 hours, and we will define another zone!
The volume price of another exchange is located in our buy zone.
The average price of the volume turned out to be $500 higher than our level!
Impulses work on any charts and time!
BTCUSD Taken for a visual example!

FLOW in the buy zone!!!FLOW is in the global buy zone 0.70-0.19
Buy level 0.413
Local buy zone 0.667-0.345
Buy level 0.480
Buy zone 0.497-0.348
Buy level 0.416
Volume price was 0.627
As long as the price is under the volume price in the FLOW buy zones, you can buy !!!
