ES (SPX, SPY) Analysis, Key Zones, Levels for Tue, (Jan 27)
BIAS: CAUTIOUSLY BULLISH — Breakout Watch
ES is testing 6,995-6,998 in premarket after rallying from the 6,970 area overnight. We're now less than 0.5% from all-time highs. Asia hit new records, Europe is bid, and risk appetite is at five-year highs according to Goldman Sachs. The path of least resistance is higher - but FOMC Wednesday and Mag 7 earnings create headline risk.
The dip buyers got their fill overnight. Now it's breakout or rejection at 7,000.
OVERNIGHT RECAP
Asia/Europe session was bullish across the board. MSCI Asia regional index hit a new all-time high. South Korean chipmakers rallied despite the tariff headlines. Stoxx 600 pushed higher led by a 21% surge in Puma. US futures followed with S&P +0.3% and Nasdaq +0.7%.
The yen gave back some gains, falling 0.2% as intervention fears cooled slightly. Gold and silver held near record highs. Dollar remained weak near 2022 lows.
Key overnight developments that shifted sentiment:
South Korea's Blue House clarified that the US letter they received was NOT directly related to Trump's tariff announcement. This de-escalates the immediate tension.
Canada's PM Carney said he had a "good conversation with President Trump." Another de-escalation signal.
Japan's Finance Minister Katayama confirmed they will "take action in line with the US-Japan FX agreement" and "closely coordinate with US authorities as needed." The intervention threat remains but is now expected rather than surprising.
BACKGROUND: IRAN TENSIONS
Trump told Axios on Monday that the US has "a big armada next to Iran" as the USS Abraham Lincoln carrier strike group entered the region. This is ongoing posturing, not a new headline — markets have already digested it. Watch for any escalation but this is not driving price action today.
WHAT'S DRIVING THE RALLY
Goldman Sachs strategists note that investor appetite for risk is at its greatest level in five years. Economic confidence is overcoming geopolitical concern.
Micron surged 5% in premarket after announcing plans to expand memory chip production. This is bullish for the semiconductor complex and supports the AI infrastructure narrative heading into Mag 7 earnings.
The three-year bull market continues to find buyers on every dip. Investors are looking to earnings this week to validate the AI-driven rally.
SCHEDULED CATALYSTS
Tuesday 10:00 AM: Consumer Confidence
Wednesday 2:00 PM: FOMC Decision (97% hold expected)
Wednesday 2:30 PM: Powell Press Conference
Wednesday After Close: Microsoft, Meta, Tesla earnings
Thursday 8:30 AM: Q4 GDP Advance (Atlanta Fed tracking 5.4%)
Thursday After Close: Apple earnings
Friday 8:30 AM: Core PCE (Fed's preferred inflation gauge)
The FOMC is fully priced for a hold at 3.50-3.75%. The market will trade Powell's tone. Hawkish = pullback. Dovish = breakout fuel.
Mag 7 earnings Wednesday night are the main event. These can swing ES 50+ points. Microsoft and Meta expectations are high. Any disappointment could trigger a sharp reversal from 7,000.
SUPPORT AND RESISTANCE ZONES
RESISTANCE
R2: 7,015 to 7,025
Extension target if 7,000 breaks cleanly. This is where profit-taking kicks in on breakout longs.
R1: 6,997 to 7,005
Current battle zone. Overnight high 6,998.75 and psychological 7,000. Must break and hold above 7,005 to confirm breakout.
SUPPORT
S1: 6,985 to 6,990
Overnight support and VWAP area. First level to buy if we pull back. Expect bids here.
S2: 6,970 to 6,978
Prior value area and overnight rally base. Strong support. If this holds on a pullback, bullish structure intact.
S3: 6,952
Monday's low. Losing this invalidates bullish structure and opens gap fill to 6,920-6,940.
PRIMARY SETUP: BREAKOUT LONG
We're at the door. The overnight session was bullish, de-escalation headlines are hitting, and risk appetite is at five-year highs. The setup favors a breakout above 7,000.
Trigger: Clean break and hold above 7,000 for 5+ minutes
Entry: 7,002 to 7,005 on the retest. Do NOT chase the initial spike. Wait for price to break above 7,000, pull back, and hold it as support.
Stop: 6,993
Target 1: 7,015 to 7,020 (take partials, move stop to breakeven)
Target 2: 7,035 to 7,040 (trail remainder)
Risk: 10-12 points
Reward: 15-35 points
R:R: 1.5:1 to 3:1
If the breakout fails and we reject back below 6,995, do NOT take this setup. Wait for price to pull back to S1 (6,985-6,990) or S2 (6,970-6,978) and reassess for a dip buy.
RISK FACTORS
Government Shutdown — 77% probability by Friday. Senate Democrats blocking DHS funding after Minneapolis shootings. Partial shutdown likely but markets typically shrug off short shutdowns.
Minneapolis Unrest — Two citizens killed by federal agents this month. Protests ongoing. Driving the shutdown standoff and adding political uncertainty.
Trump Tariffs - South Korea 25% threat de-escalated slightly with Blue House clarification. Canada conversation "good" per PM Carney. Still watch for headline risk.
Iran - USS Abraham Lincoln now in region. Tensions ongoing but not escalating today. Background noise unless new headlines hit.
Overbought Technicals - Daily oscillator at 110 (extreme). We're extended and due for mean reversion eventually, but momentum can stay overbought longer than expected in trending markets.
RISK MANAGEMENT
Reduce position size by 50% this week
No overnight holds through Wednesday earnings
Take quick profits at resistance
Use breakeven stops once in profit
Be ready to flip direction on headline surprises
The market can move 30-50 points on a single headline. Capital preservation first.
BOTTOM LINE
Bulls are in control. We rallied overnight, de-escalation headlines are hitting, and risk appetite is at multi-year highs. The setup favors a breakout above 7,000.
But this is FOMC week with Mag 7 earnings Wednesday night and a government shutdown Friday. The breakout needs to happen with conviction or we risk a "buy the rumor, sell the news" reversal.
Key question: Can ES break and hold 7,000 before FOMC? If yes, the path opens to 7,020-7,040. If no, expect consolidation between 6,978-7,000 until Wednesday's catalysts resolve.
Trade what you see, not what you think. Good luck !!!
Levels

ES (SPX, SPY) Analysis Week of January 26-30, 2026ES FUTURES | Week of Jan 26-30, 2026 | FOMC + Mag 7 Collision
ES closed Friday at 6,914.50 — sitting at equilibrium ahead of the most catalyst-dense week of Q1.
KEY CATALYSTS
Tue-Wed: FOMC Meeting — 94% hold at 3.50-3.75%, Powell speaks Wed 2:30 PM
Wed AMC: MSFT, META, TSLA earnings
Thu 8:30 AM: Q4 GDP — Atlanta Fed nowcast 5.37% (HOT)
Thu AMC: AAPL earnings
Fri: PCE Inflation, Month-end flows
Wild cards: Fed Chair replacement speculation, Trump-Canada 100% tariff threat, Winter storm (150M affected)
SENTIMENT SNAPSHOT
VIX: 16.09 (complacent)
SKEW: 148 (hidden tail risk)
Put/Call: 0.76 (neutral)
AAII Bulls: 43% (elevated)
NAAIM: 88% invested
Credit Spreads: Tight (risk-on)
DIX: 45%+ (dark pool buying)
Margin Debt: $1.225T ATH
Read: Retail bullish, institutions hedging. Late-cycle but no crash signals.
KEY LEVELS
Resistance:
6,956-6,970 — PWH/PDH cluster
7,040 — 4H Strong High (90%)
7,100-7,150 — Fib extensions
Support:
6,892-6,907 — 1H Fibs
6,875-6,880 — Weekly EQ (key)
6,857-6,860 — PWL
6,820 — 1H Weak Low
TRADE IDEA — MONDAY
Bias: Long on dip
Setup: Buy pullback to 6,875-6,892 support cluster
Stop: Below 6,857
Targets: 6,911 then 6,948 then 6,970
Why: Pre-FOMC consolidation typical, strong breadth (65% beating SPX — 2nd best in 50 yrs), dips being bought, no bearish trigger until Wed.
Invalidation: Close below 6,857 or VIX above 20 sustained.
RISK FACTORS
Intel crashed 17% Fri — semi headwind
DXY collapsing (97.17) — policy uncertainty
Gold $5,044 / Silver $107 — safe haven bid
Hot GDP could trigger hawkish Fed repricing
SCENARIOS
Bullish (25%): Break above 6,970 targets 7,040-7,100
Range (50%): Chop 6,880-6,970 until Wed
Bearish (25%): Break below 6,857 targets 6,820-6,780
RESPECT THE RANGE UNTIL PROVEN OTHERWISE.
Good Luck !!!

Review and plan for 22nd January 2026Nifty future and banknifty future analysis and intraday plan.
stocks with quarterly results.
This video is for information/education purpose only. you are 100% responsible for any actions you take by reading/viewing this post.
please consult your financial advisor before taking any action.
----Vinaykumar hiremath, CMT

Plan for 21st January 2026 Nifty future and banknifty future analysis and intraday plan.
stocks and commodities too.
This video is for information/education purpose only. you are 100% responsible for any actions you take by reading/viewing this post.
please consult your financial advisor before taking any action.
----Vinaykumar hiremath, CMT

GOLD Weekly Levels: Buy/Hold 4270/4300 Target 4500/4633 🔱 GOLD WEEKLY SNAPSHOT — EXECUTIVE SUMMARY
✨ Gold in wave-4 accumulation after extended impulse
🟡 Primary impulse complete: 3910 → 4500 (H2/H4)
🔄 Current pullback: 4500 → 4268 = corrective, not reversal
🧱 Accumulation zone: 4300–4268 (buy dips only)
📈 Trend remains bullish while above 4210
🚀 Wave-5 target: 4630–4650 price discovery zone
⏳ Expect consolidation before expansion
⚠️ Invalidation: acceptance below 4210
🎯 Strategy: buy & hold dips, don’t chase highs
🏦 Final leg likely followed by larger consolidation
🗳️ Gold Weekly Scenarios — What’s Your Play?
Which path do you have for XAUUSD next week?
🅰️ Hold 4,27x–4,30x → continuation toward 4,500+ / wave-5 extension
🅱️ Dip into 4,25x–4,26x, then rotate higher (accumulation before breakout)
🅲 Acceptance > 4,380 → squeeze confirms upside continuation
🅳 Your level: drop one price you’re watching most next week
🔥 GOLD WEEKLY SNAPSHOT — BY PROJECTSYNDICATE
🏆 Swing High / Swing Low
$4,500 → $4,268 — controlled pullback from the wave-3 peak following an extended impulse. The decline into the $4,26x area shows overlap, compression, and reduced momentum, consistent with a wave-4 corrective phase rather than trend reversal. Weekly structure remains constructive while price holds above key invalidation.
📈 Trend
Higher-timeframe:
Primary trend remains bullish following a completed 5-wave impulse on H2/H4, with wave-3 extension from $4,000 → $4,500 confirming strong trend participation.
Tactical:
Current price action fits a wave-4 accumulation / consolidation phase:
Shallow pullback relative to wave-3
Overlapping ranges
Compression above prior breakout structure
As long as price holds above $4,210, the tape favors continuation into wave-5 rather than deeper correction.
🛡 Supports – Accumulation / Buy-Side Zones
$4,300–$4,270 🟢 Accumulation zone
Primary wave-4 basing area. This zone represents:
Prior minor breakout structure
Overlapping corrective price action
Area of strongest dip-buying interest
Preferred zone for buy-the-dip positioning, not aggressive chasing.
$4,250–$4,230:
Secondary support shelf and intraday defense zone. Acceptance below this area would increase corrective risk but does not yet invalidate the bullish structure.
$4,210 🔑 Structural invalidation
Loss and acceptance below $4,210 invalidates the wave-5 continuation thesis and signals a deeper corrective phase instead of immediate trend extension.
🚧 Resistances – Upside Objectives / Expansion Targets
$4,380–$4,400:
First upside resistance and near-term liquidity magnet. A clean reclaim and hold above this zone would confirm wave-4 completion.
$4,500:
Prior high and breakout trigger. Acceptance above $4,500 opens the door for wave-5 price discovery.
$4,630–$4,650 🎯 Wave-5 target zone
Projected wave-5 expansion objective based on prior impulse proportions. This zone represents the final upside leg of the current impulse sequence before a larger-degree consolidation becomes likely.
🧭 Bias Next Week
Primary bias: buy dips within the accumulation zone, do not chase highs.
The market structure favors:
Continued consolidation early week
Holding above $4,250–$4,210
Breakout attempt toward prior highs later in the week
As long as price remains above $4,210, upside continuation remains the dominant scenario.
⚖️ Base Case Scenario
Early week:
Price continues to range within $4,270–$4,330, maintaining compression and absorbing supply from late longs.
Mid-week:
Sustained holding above the accumulation zone invites renewed upside momentum toward $4,380–$4,400.
Expansion phase:
Acceptance above $4,500 triggers wave-5 continuation toward $4,630+, with momentum-driven price discovery.
🚀 Breakout / Invalidation Triggers
Bullish confirmation:
Daily acceptance above $4,500 confirms wave-5 in progress and shifts focus to higher expansion targets.
Bullish invalidation:
A clean break and acceptance below $4,210 invalidates the wave-5 thesis and signals a deeper corrective structure instead of continuation.
🔓 Bull / Bear Structural Lines
Bull structure line:
Above $4,210 — impulse structure intact, dips are corrective and buyable.
Bear expansion line:
Below $4,210 — bullish continuation delayed; opens scope for a deeper retracement toward lower demand zones before any renewed upside.
🧭 Recommended Strategy — Buy & Hold Dips (Accumulation Phase)
⚠️ Illustrative framework, not financial advice. Manage risk according to your own rules.
1️⃣ Primary Strategy — Accumulate Pullbacks
Focus on $4,300–$4,270 for staged long exposure
Avoid chasing strength near highs
Use acceptance and structure confirmation for entries
Risk management / invalidation:
Tactical invalidation: sustained acceptance below $4,210
Upside objectives:
First objective: $4,380–$4,400
Breakout objective: $4,500
Expansion target: $4,630–$4,650 (wave-5 projection)

ES (SPX, SPY) Analysis, Key Levels, Setups for Thur (Jan 15)
The E-mini S&P 500 (ES) closed at 6,961.50, down 40.25 points or 0.57% from the previous day's close of 7,001.75. This marks the second consecutive decline, with the technology sector leading the losses.
Session Highlights:
- Prior Day High (PDH): 6,979.75
- Prior Day Low (PDL): 6,923.25
- Overnight High (ONH): 7,002.50
- Overnight Low (ONL): 6,963.50
- Volume Weighted Average Price (VWAP): 6,947.00
- Value Area High (Y-VAH): 6,957.50
- Point of Control (Y-POC): 6,940.50
- Value Area Low (Y-VAL): 6,927.50
The session featured a cautious tone, opening at 6,972.25 and briefly testing a low at 6,926.50 through New York afternoon hours. Buyers emerged near a critical cluster of support, allowing for a slight recovery ahead of the close, although the overall day ended on a negative note. The market is seeing a risk-off rotation as technology underperforms, whereas energy stocks reached all-time highs and precious metals rallied, with silver increasing by over 6% to above $92.
---
Key News and Catalysts
1. Semiconductor Tariffs (High Impact)
President Trump has implemented a 25% tariff on advanced computing chips including NVDA’s H200 and AMD’s MI325X. Certain exemptions are in place for chips used in data centers, startups, and public sector applications. The White House cautioned that additional tariffs could be imposed soon.
2. CPI/PPI Data (Released January 14)
December's Consumer Price Index (CPI) met expectations, but the Core CPI revealed weaker-than-anticipated results. The Producer Price Index (PPI) rose by 0.2% in line with forecasts. Analysts believe this data will likely lead the Federal Reserve to maintain its current stance through at least March.
3. Retail Sales (Released January 14)
November retail sales data were released post-shutdown, showing a better-than-expected increase of 0.6%, surpassing the predicted growth of 0.5%, thus reinforcing the narrative of consumer strength.
4. Bank Earnings
Bank of America reported earnings exceeding projections (98 cents vs 96 cents expected), while Wells Fargo fell short on revenue targets. The market awaits reports from Goldman Sachs, Morgan Stanley, and BlackRock, which could further influence the financial sector.
5. Geopolitical Developments
- Ongoing discussions regarding Greenland in the White House
- A Supreme Court ruling on tariffs may come soon
- Arguments concerning Federal Reserve independence are scheduled for January 21
---
Economic Calendar for January 15
8:30 AM ET (6 releases):
- Initial Jobless Claims: Expected 215K | Prior 208K
- Empire State Manufacturing Index: Expected +1.1 | Prior -3.9
- Philadelphia Fed Manufacturing Index: Expected -2.9 | Prior -10.2
- Import Prices MoM: Expected 0.0% | Prior +0.1%
- Export Prices MoM
- Continuing Claims
10:00 AM ET:
- Business Inventories: Expected +0.1%
- Existing Home Sales
Note: Future retail sales release dates remain to be determined by the Census Bureau due to ongoing data verification from the shutdown period.
---
Overnight Session Forecast
Asia Session (6:30 PM - 2:00 AM ET)
Bias: Neutral to Slightly Bearish
- Markets in Japan, China, and Hong Kong will react to the chip tariff announcements, while India is closed for local elections. Initial volatility is anticipated with a test of the overnight low at 6,963.50 expected, particularly focusing on Asian semiconductor stocks like TSMC and Samsung.
London Session (2:00 AM - 6:00 AM ET)
Bias: Neutral, Range-Bound
- With several significant UK data releases approaching, including GDP and Industrial Production, market participants should monitor for potential movements in the Euro Stoxx 50, which is at record highs. The anticipated trading range is set between 6,940 and 6,980, pending US data developments.
Pre-Market/NY Open (6:00 AM - 9:30 AM ET)
- Earnings from Goldman Sachs, Morgan Stanley, and BlackRock will influence market sentiment. The upcoming Philly and Empire Fed surveys will offer insights into the manufacturing sector, along with initial jobless claims data expected to provide a gauge on the labor market.
---
Key Resistance Zones
R1: 6,979.75 | PDH
R2: 7,002.50 | ONH + Psychological level at 7K
R3: 7,040 - 7,050 | January Swing High
R4: 7,094.50 | 1.272 Fibonacci (1H)
R5: 7,113.25 | 1.272 Fibonacci (4H)
R6: 7,149.75 | 1.272 Fibonacci (Daily)
R7: 7,161.75 | 1.618 Fibonacci (4H)
Key Support Zones
S1: 6,947 - 6,952.50 | VWAP + Asian Session Low
S2: 6,927.50 - 6,940.50 | Y-VAL to Y-POC cluster
S3: 6,923.25 | PDL / Equilibrium
S4: 6,880 - 6,900 | PWL zone
S5: 6,800 - 6,788 | PML + Major Weekly Support
The 6,923-6,940 range presents a significant confluence of support.
---
Trade Setups for Tomorrow
Primary Setup: Value Area Bounce (Long)
Context: With the bull market intact, the price is positioned within a value area, finding support below.
- Entry Zone: 6,927 - 6,940
- Trigger: Bullish displacement from support
- Stop Loss: Below 6,918
- Targets:
- Target 1: 6,965
- Target 2: 6,979.75
- Target 3: 7,002.50
Risk-Reward Calculation (for an entry at 6,935 and stop at 6,918):
- Risk: 17 points
- Target 1 Reward: 30 points → 1.76:1
- Target 2 Reward: 44.75 points → 2.63:1
- Target 3 Reward: 67.5 points → 3.97:1
Invalidation: A close below 6,918 with follow-through.
Secondary Setup A: ONH Breakout (Long)
- Entry Zone: Above 7,002.50
- Trigger: 15-minute close above ONH with volume
- Stop Loss: Below 6,985
- Targets:
- Target 1: 7,020
- Target 2: 7,040
Note: Target 1 alone presents unfavorable risk-reward; focus on achieving Target 2 with partial at Target 1.

Review and plan for 14th January 2026Nifty future and banknifty future analysis and intraday plan.
Quarterly results- hcltech, tataelxsi, dmart.
This video is for information/education purpose only. you are 100% responsible for any actions you take by reading/viewing this post.
please consult your financial advisor before taking any action.
----Vinaykumar hiremath, CMT

DASHUSDT rally from support tests daily resistance Dash has shown significant growth, rising more than 75% from the daily support range of 37.30-38.65. The upward movement was accompanied by active participation from large volumes, indicating attempts by major players to defend the support and immediately exit accumulation.
The rally paused at the daily resistance zone of 65.70-69.56, where bears responded with volume to limit further upward movement. This shows that this area remains a key level for price control.
For bulls, it is now critical to break through the resistance and hold above it. Otherwise, bears could establish accumulation or even push the price back down using their volume.
Accumulation in the current situation appears more like a neutral scenario, with a balance established between the sides. However, bulls still hold the advantage, and bears will need significantly more volume to push the price lower.
Thus, Dash is caught between support and resistance, with the balance of power currently tilted toward bulls. The next move will depend on which side takes control of the key level first.

Gold Weekly Levels: Break above 4555 → 4625/4635🔱 GOLD WEEKLY SNAPSHOT — EXECUTIVE SUMMARY
✨ Bulls remain in control as price transitions into the Wave-5 extension sequence
🟡 Key unlock level: 4555 — a clean break/acceptance above opens continuation fuel
🚀 Wave-5 extension target: 4625–4635 (primary upside objective / price discovery ceiling)
🧲 Fresh overhead sell-side liquidity: 4625–4635 = high-probability “max-out + reversal” zone
🔄 Expectation after 4625–4635: corrective rotation lower profit-taking + liquidity sweep
🛡 Bull structure remains intact while above: 4350 first major buy-side pool
⚠️ Bears’ post-extension objectives: 4350 → 4275 fresh buy-side liquidity targets
🎯 Strategy this week: trade with the trend into 4625–4635, then shift mindset to correction timing
🏦 Core play: don’t chase highs under 4625–4635; scale out into target, then stalk reversal setup
________________________________________
🗳️ Gold Weekly Scenarios — What’s Your Play?
Which path do you have for XAUUSD next week?
🅰️ Hold above 4555 → wave-5 extension triggers → 4625–4635 sweep
🅱️ Fakeout / dip under 4555 early week → reclaim → squeeze into 4625–4635
🅲 Direct drive into 4625–4635 → rejection confirms reversal → correction targets 4350/4275
🅳 Your key level: 4555
________________________________________
🔥 GOLD WEEKLY SNAPSHOT — BY PROJECTSYNDICATE
🏆 Swing Structure
Gold is still operating in a bull-controlled tape, but this week is about finishing the move:
• 4555 is the trigger level that opens the door for continuation.
• Once continuation engages, the market is likely to seek a final liquidity run into 4625–4635.
• That zone is important because it’s not just a target — it’s fresh overhead sell-side liquidity, meaning it’s where late longs get trapped and smart money sells into strength.
• After the sweep completes, the roadmap flips: correction phase begins, with bears likely targeting fresh buy-side liquidity at 4350 and 4275.
________________________________________
📈 Trend
Higher-timeframe bias
Primary bias remains bullish, with the market positioned for a Wave-5 extension.
Tactical
This week is likely to trade in two phases:
Phase 1: Continuation & Extension
• Bulls defend structure, build pressure, then break 4555
• Momentum rotates higher as stops/liquidity fuel expansion
• Price seeks the 4625–4635 magnet
Phase 2: Max-Out & Correction
• Once 4625–4635 is tagged/swept, upside becomes asymmetric risk
• Expect rejection behavior stall → wick → displacement down
• Market shifts to “where’s the next liquidity pool?” → 4350, then 4275
________________________________________
🛡 Supports — Demand / Buy-Side Liquidity Zones
4555 Pivot / Trigger
This is the most important tactical level this week:
• Above it: continuation bias stays active
• Below it: market may chop, reload, or run a dip-reclaim pattern
4350 Fresh buy-side liquidity
• This is a post-extension magnet.
• If Wave-5 completes near 4625–4635, 4350 becomes the first major “bear target”.
• Also likely to act as a reaction zone once tagged.
4275 Fresh buy-side liquidity
• Secondary downside objective once 4350 is taken.
• Often the “final grab” zone that completes the correction leg.
• Expect increased bid interest here after liquidity is swept.
________________________________________
🚧 Resistances — Upside Objectives / Wave-5 Expansion Targets
4555 Breakout gate
• Break + acceptance = green light
• Rejection + failure = delay, not necessarily reversal until 4625–4635 is visited
4625–4635 Wave-5 extension + fresh sell-side liquidity
This is the main event:
• The market is expected to run this zone because it holds fresh overhead liquidity
• This is where you expect:
o stop runs
o late FOMO entries
o liquidity sweep behavior
o reversal conditions forming
Trade mindset at 4625–4635:
✅ take profits / reduce risk
❌ don’t initiate fresh longs late into the zone (unless you’re scalping with strict rules)
________________________________________
🧭 Bias Next Week
Primary bias: bullish continuation into 4625–4635, then correction expected.
What you’re trading this week:
• Bulls: break 4555 → push extension
• Bears: wait for 4625–4635 sweep → trigger correction → target 4350/4275
________________________________________
⚖️ Base Case Scenario Most likely path
Early week: pressure + positioning
• Market holds firm and works around the pivot zone
• Any dips are likely corrective and designed to reload liquidity for the break
Mid-week: trigger + acceleration
• 4555 breaks/holds
• Momentum expands; price begins seeking the upper liquidity pool
Late week: target hit + reversal risk increases sharply
• Price reaches 4625–4635
• Expect “max-out” behavior:
o stall / compression at highs
o wick sweeps
o sharp rejection candles
• Once rejection confirms, correction leg begins targeting:
o 4350 first
o 4275 next
________________________________________
🚀 Breakout / Invalidation Triggers
✅ Bullish confirmation trigger
Clean break + acceptance above 4555
• Confirms Wave-5 continuation is active
• Increases probability of reaching 4625–4635
⚠️ “Max-out” reversal trigger (what you’re watching at the top)
Sweep into 4625–4635 + rejection
Common confirmation behaviors:
• quick spike into the zone, then close back below
• repeated failure to hold above 4630-ish
• sharp displacement down after a liquidity grab
✅ Bearish continuation trigger
Rejection confirmed from 4625–4635 + breakdown through local supports
• Opens correction flow into 4350, then 4275
________________________________________
🔓 Bull / Bear Structural Lines
🟢 Bull control line: Above 4555
🟡 Transition line: 4625–4635
🔴 Bear objective line: Below post-top breakdown correction seeks 4350 → 4275
________________________________________
🧭 Recommended Strategy Framework
1️⃣ Primary Play — Ride Wave-5 into the extension
Idea: Bulls maintain control → break 4555 → push into 4625–4635
• Build exposure only when the market proves it can hold above 4555
• Prefer entries on:
o reclaim/hold of 4555
o shallow pullbacks that respect the breakout structure
• Risk management focus: avoid chasing once price is extended and nearing 4625–4635
2️⃣ Profit-taking Plan — Scale out into 4625–4635
This is your sell-side liquidity zone:
• Reduce longs into the target
• Tighten risk aggressively
• Assume reversal risk rises the closer price gets to 4635
3️⃣ Secondary Play — Hunt the correction AFTER the sweep
Once Wave-5 extension completes:
• Bears likely target fresh buy-side liquidity:
o 4350
o 4275
Correction mindset:
• First drop often sharp (trap release)
• First bounce likely around 4350
• If 4350 breaks clean, expect continuation into 4275
________________________________________
✅ Weekly Levels
• 4555: breakout gate / continuation trigger
• 4625–4635: wave-5 extension + sell-side liquidity (reversal window)
• 4350: buy-side liquidity target #1 (post-top correction)
• 4275: buy-side liquidity target #2 (deeper correction objective)

ES (SPX, SPY) Analysis, Key Levels, Setups for Mon, (Jan 12)MACRO/FUNDAMENTAL OVERVIEW
Primary Driver: Fed Independence Crisis Signals Major Risk-Off Environment
The predominant headline today revolves around a significant development concerning Federal Reserve independence. Fed Chair Jerome Powell revealed that the Justice Department issued a subpoena to the central bank, intimating the possibility of a criminal indictment. Powell described this as part of the administration's ongoing pressure to influence rate decisions, emphasizing, "The threat of criminal charges arises when the Federal Reserve prioritizes its best assessments for public service over the President's preferences."
Market Implications:
Analysts at Evercore ISI anticipate a "sell-America" narrative reminiscent of last April's peak tariff shock, predicting declines for the dollar, bonds, and equities in Monday's trading. Following the news, the markets showed muted initial responses; the U.S. dollar slipped 0.2% against a basket of currencies, while S&P 500 futures decreased by 0.5% and Nasdaq 100 futures fell 0.8%.
Political Risk Calendar:
In a noteworthy legal development, the Supreme Court is scheduled to hear arguments regarding Fed Governor Lisa Cook's potential removal on January 21. Additionally, former President Trump is reportedly interviewing BlackRock's Rick Rieder for a Fed chair position this week. Sen. Thom Tillis (R-NC) has indicated he will oppose any Trump nominee for the Fed "until this legal matter is fully resolved."
Safe Haven Flows:
Gold witnessed a notable rise of over 1%, surpassing $4,590 per ounce, reaching record highs as concerns over Federal Reserve independence and geopolitical tensions stoked demand for safe-haven assets. Silver also experienced a significant uptick, climbing 4.4% in spot trading to $83.50 an ounce after briefly reaching $83.96. The Swiss Franc emerged as the strongest performer among G10 currencies.
Secondary Drivers:
Ongoing unrest in Iran has intensified, with reports of protests resulting in hundreds of fatalities and Trump hinting at military strikes, propelling oil prices to a one-month high (Brent above $63, WTI above $58). The banking and financial sectors experienced weakness amid Trump's intentions to freeze credit card interest rates. Meanwhile, 30-year Treasury yields climbed 4 basis points to 4.86%, driven by inflation concerns. Lastly, December's weak non-farm payroll figures (averaging just 29,000 jobs per month in Q4 compared to 57,000 in Q2-Q3) complicate the Fed's path, although inflation risks remain a significant factor.
Market Analysis: SMC Structure Overview (4H/1H)
Daily Overview: The market has recently seen a rejection from the premium zone, exceeding 7,000, leading to a sequence of lower highs following a recent higher high at approximately 7,020. A break of structure (BOS) was confirmed at these recent highs, with the market now retracing.
4-Hour Perspective: The higher-low (HL) structure remains intact, with key support located in the 6,950-6,960 range. The pivotal weekly low (PWL) at 6,900 is a crucial level that must be maintained for bullish continuation. The premium zone is clearly delineated above 7,000.
1-Hour Insights: A change of character (CHoCH) is apparent, with an HL being constructed around 6,956. However, the recent sequence of lower highs/lower lows suggests prevailing short-term bearish pressure, with an equilibrium around 6,940.
The oscillator matrix indicates a bearish momentum divergence across multiple timeframes, particularly with the RSI remaining compressed within the 50-70 range.
Primary Sentiment: Bearish to Neutral
The prevailing risk-off sentiment is underscored by the technical structure reflecting distribution from the premium zone.
Scenario 1: Fade Rally into Y-POC/Prior Close (High Probability)
The overnight gap down sets the stage for the potential to fade any rally toward the 6,995-7,005 area, which encompasses the Y-Point of Control (POC) and the prior close, contingent on confirming order flow rejection.
- Entry Zone: 6,995-7,005
- Confirmation: Look for cumulative volume delta (CVD) divergence, iceberg selling on Bookmap, and any failed breakouts at the Y-Volume Area High (VAH).
- Targets: 1) 6,968 (overnight low), 2) 6,950-6,955 (prior day low/London low), 3) 6,900 (PWL).
- Stop Loss: Above 7,020 (previous day high, PDH).
Scenario 2: Long from Discount Zone (Countertrend Play)
Should price sweep past the prior day low (PDL) and reach the 6,950 HL zone or delve deeper to the 6,900 PWL, traders should monitor for absorption signals and CVD reversal to consider a countertrend long position.
- Entry Zone: 6,945-6,955 (initial attempt) or 6,890-6,910 (PWL area).
- Confirmation: Look for robust bid absorption, CVD divergence, and visible iceberg buying.
- Targets: 1) 6,970-6,975 (mid-range), 2) 6,995 (Y-POC).
- Stop Loss: Below 6,880 for PWL entries.
Headline Risk: The market remains sensitive to headlines related to further Federal Reserve/Department of Justice developments, comments from former President Trump regarding Powell, or any rulings from the Supreme Court. Traders are advised to adjust positions in light of potential volatility.
CPI Preview: As markets position ahead of the CPI release on Wednesday, a hotter print could instigate a hawkish posture, supportive of the dollar but bearish for equities.
Good Luck

GBPUSD Institutional Levels: Sell 1.3490 → Buy 1.3360🔱 GBPUSD WEEKLY SNAPSHOT — EXECUTIVE SUMMARY
✨ GBPUSD trading inside a liquidity-driven range with expansion risk
🔄 Current environment: balanced → reactive, awaiting liquidity taps
🧱 Fresh sell-side liquidity / sell zones (premium):
• 1.3460
• 1.3490 upper premium / stop-rich zone
🟢 Fresh buy-side liquidity / buy zones (discount):
• 1.3390
• 1.3360 deeper draw / max pain zone
📉 Price currently oscillating between fresh liquidity pools, not trending
🧠 Both sides are unmitigated → clean reactions likely on first touch
⚖️ Market favors mean-reversion trades until a liquidity sweep occurs
🎯 Expect sharp reactions, not chop, at marked levels
⚠️ Bias is conditional, not directional:
• Above mid-range → sellers gain control
• Below mid-range → buyers gain control
🎯 Recommended strategy:
👉 Buy from fresh buy-side liquidity
👉 Sell from fresh sell-side liquidity
🗳️ GBPUSD WEEKLY SCENARIOS — WHAT’S YOUR PLAY?
Which path do you expect for GBPUSD this week?
🅰️ Tap 1.3460–1.3490 → sharp rejection → move back into range
🅱️ Sweep 1.3360 → strong bounce → rotation higher
🅲 Full range sweep (both sides) → expansion next
🅳 Your level: drop ONE price you’re watching most 👇
________________________________________
🧠 GBPUSD MARKET LOGIC — Institutional Read
• Liquidity is stacked symmetrically above and below current price
• No strong acceptance yet → algos farming both sides
• First touch of fresh liquidity = highest R:R
• Repeated taps weaken the zone → wait for displacement
• Expansion likely after one side is fully swept
________________________________________
⏳ EXPECTATIONS GOING INTO THE WEEK
⬆️ Rallies into 1.3460–1.3490
→ Watch for rejection, displacement, or failure to accept
→ Favor sell-side reactions
⬇️ Drops into 1.3390–1.3360
→ Watch for absorption, divergence, or strong wicks
→ Favor buy-side reactions
🧨 A clean sweep + acceptance beyond either extreme
→ Signals range resolution & new directional leg

XAUUSD Intraday Plan | Technical Levels to WatchYesterday, we highlighted that failure to hold above 4464 would likely lead to a retracement into lower support zones. That scenario played out as price failed to sustain above 4464, broke lower, and moved back toward the immediate support zone, aligning with the MA200, which is currently providing dynamic support after the MA50 gave way.
If price can find support in this area and reclaim the 4432 resistance, another attempt toward 4464 comes into focus, with potential for further upside should momentum rebuild.
However, if selling pressure remains, watch 4390 as the next key downside level. A break below that would shift attention to lower support zones, where buyers may look to step back in.
📌Key levels to watch:
Resistance:
4432
4464
4530
Support:
4390
4352
4315
4274

EURUSD Institutional Levels: Short Premium 1750–1800 → 1600🔱 EURUSD WEEKLY SNAPSHOT — EXECUTIVE SUMMARY
✨ EURUSD positioned in a corrective bearish structure (distribution → continuation)
🔴 Primary sell impulse: 1.1800 → 1.1600 confirms bearish control
🔄 Current price action: corrective rallies (sell-the-rip environment)
🧱 Institutional sell zone: 1.1750 – 1.1800 (major resistance stack)
🟡 Intermediate resistance: 1.1750 (reaction zone before continuation)
📉 Bearish bias remains valid below: 1.1800
🎯 Downside liquidity targets:
• First buy-side liquidity: 1.1600
• Expansion support / max pain: 1.1500
⬇️ Market structure: lower highs + weak retracements = continuation risk
⏳ Expect rallies to be capped before range expansion lower
⚠️ Invalidation: sustained acceptance above 1.1800
🎯 Strategy: Short sell rips / rallies into resistance
🏦 Larger accumulation likely only after liquidity is swept below 1.1600–1.1500
________________________________________
🧠 EURUSD MARKET LOGIC Institutional Read
• Sellers defend premium zones (1.1750–1.1800)
• Buyers are reactive, not aggressive
• Downward arrows dominate flow → bearish continuation favored
• Any upside without acceptance = distribution
________________________________________
🗳️ EURUSD WEEKLY SCENARIOS — WHAT’S YOUR PLAY?
Let me know in the comments section below.
Which path do you expect for EURUSD this week?
🅰️ Rejects 1.1750–1.1800 → clean selloff toward 1.1600
(Textbook sell-the-rip continuation)
🅱️ Range grind below 1.1750 → liquidity build → breakdown to 1.1500
(Slow bleed before acceleration)
🅲 Fake breakout above 1.1750 → sharp rejection → impulsive drop
(Bull trap / stop-hunt scenario)
🅳 Your level: drop ONE price you’re watching most this week 👇

BTCUSD Institutional Levels: Sell Premium 97 500–102 000🔱 BTCUSD WEEKLY SNAPSHOT — EXECUTIVE SUMMARY
✨ Bitcoin positioned in a late-cycle distribution structure with elevated bull trap risk
🔴 Primary sell-side liquidity magnet reclaimed at 97 500 confirms seller interest
🔄 Current price action shows upside probes without sustained acceptance
🧱 Institutional sell zones stacked above market
• 100 000 psychological magnet
• 102 000 technical overshoot and bull trap extension
🟡 Reaction resistance zone at 97 500
📉 Bearish-to-neutral bias remains valid below 102 000
🎯 Downside liquidity objectives
• First buy-side liquidity pocket at 85 000
• Major accumulation and max pain zone at 80 000
⬇️ Market structure shows expansion up without follow-through followed by fast rejection risk
⏳ Expect upside attempts to be sold into rather than accepted
⚠️ Invalidation requires sustained acceptance and consolidation above 102 000
🎯 Strategy Sell strength into premium zones Buy only after liquidity sweep into discounts
🏦 Larger accumulation favored only after buy-side liquidity is cleared below 85 000 to 80 000
🧠 BTC MARKET LOGIC — INSTITUTIONAL READ
• Sellers active at psychological and technical round numbers
• Upside extensions used to distribute inventory
• 97 500 acts as a pivot between distribution and acceleration
• Acceptance above 100 000 required to flip bias
• Failure near highs increases probability of fast drawdown into liquidity pools
• Downside targets represent value zones not momentum trades
🗳️ BTC WEEKLY SCENARIOS — WHAT’S YOUR PLAY?
Which path do you expect for BTC next?
🅰️ Rejection at 97 500 to 100 000 → breakdown toward 85 000
Classic distribution into sell-side liquidity
🅱️ Spike into 100 000 to 102 000 → sharp rejection → fast drop to 80 000
Textbook bull trap and liquidity sweep
🅲 Range below 97 500 → compression → expansion lower into 85 000
Slow build before acceleration
🅳 Your level Drop ONE BTC price you are watching most this week 👇

ES (SPX, SPY) Analysis Week-ahead from Jan 5 to Jan 9, 2026Multi-Timeframe Market Analysis
Weekly Overview: The Big Picture
The E-mini S&P 500 (ES) continues to demonstrate an uptrend on a macro scale, characterized by a series of higher highs and higher lows. However, the recent market activity has resembled a gradual grind near the upper boundaries of a multi-month trading range—a behavior often referred to as “premium.” This indicates a slowdown in upward momentum, with pullbacks becoming increasingly pronounced. While the market does not exhibit extreme overbought conditions, the acceleration seen in prior weeks has noticeably diminished.
Daily Trend and Range Dynamics
On a daily basis, the market is operating within an upward trend that is currently exhibiting range-bound characteristics. We are witnessing repeated attempts to test the upper supply zone around the 6980-7000 level, followed by mean reversion toward the mid-to-lower 6900s. The latest daily swing reflects a pullback from this upper band, positioning prices now towards the center of this range, where liquidity zones take precedence over simply chasing trends.
4-Hour Perspective: Impulse vs. Correction
Analyzing the 4-hour chart reveals a distinct corrective move followed by a rebound that has yet to solidify a sequence of higher highs. While the overarching weekly trend remains bullish, the current 4-hour action feels more like a rebound effort, with the market in a phase of "repair" after experiencing a sharp decline.
1-Hour Intraday Context
At the intraday level, the latest 1-hour movement reflects a rebound from the lower 6800s towards the resistance zone in the low-to-mid 6900s. This places traders in a critical “decision zone” as we enter Monday's session, where the market faces a pivotal moment: it must either reclaim and sustain levels above these key resistance shelves (indicating bullish continuation) or risk further fading of rallies, which would suggest a return to range-bound or corrective trading.
Oscillator and Momentum Indicators (Weekly and Daily)
From a momentum perspective, the weekly oscillators point to a constructive yet cooling outlook, lacking signs of a fresh breakout structure. Daily momentum indicators are closer to neutral territory, indicative of a market that appears to be in a wait-and-see mode, poised for a catalyst to determine its next direction.
Volatility Metrics Analysis
VIX Overview
The CBOE Volatility Index (VIX) closed the previous session at 14.51, reflecting a decline throughout the day.
VIX Term Structure
The VIX term structure remains in contango, with an upward-sloping curve indicating that implied volatility is anticipated to rise over the coming months. Specifically, the implied volatility for January sits at 12.55, February at 15.38, and March at 17.34, with further increases projected for later months. This pattern is typically indicative of stable market conditions, suggesting that volatility is being priced higher down the line compared to the present.
Rates Volatility (MOVE)
The MOVE Index, which measures volatility in interest rates, is currently at 62.36 as we approach market close, also reflecting a decrease on the day. This level does not indicate significant stress within the market, aligning more with an environment in which investors are not exhibiting panic regarding interest rate fluctuations.
Options and Positioning Overview
Current Put/Call Ratios (Latest Daily Figures)
- Total Put/Call: 0.83
- Index Put/Call: 1.08
- ETP Put/Call: 0.85
- Equity Put/Call: 0.56
Analysis: The equity flow currently exhibits a call-leaning sentiment, as indicated by the lower equity put/call ratio. In contrast, index hedging remains active, with the index put/call ratio above 1. This duality is characteristic of late-cycle market behavior, where investors often purchase upside in individual stocks while simultaneously maintaining protective index hedges.
10-day Moving Average of Put/Call Ratios
Unfortunately, a definitive and authoritative 10-day moving average for the total put/call ratio is not readily available from the sources providing daily data in a machine-readable format. While the daily figures presented are confirmed, the 10-day averages cannot be securely sourced at this time.
SKEW - Tail Risk Pricing
The SKEW index closed at 141.86, a figure that Cboe describes as reflective of the pricing dynamics surrounding out-of-the-money SPX options, particularly those associated with tail risk. Typically, values for SKEW fluctuate within the 100-150 range. The implication is clear: despite a calm front-end volatility environment (as suggested by VIX levels), tail hedges are attractively priced.
Dealer Gamma Insights
Considering the current landscape of low spot volatility coupled with contango and a modest equity put/call ratio, market conditions suggest that dip buyers may defend the initial downside levels effectively. However, the elevated SKEW indicates that the demand for downside tail protection is increasing, meaning that if the market breaches key support levels (S4), panic-induced hedging activity could accelerate rapid downward movements. This interpretation is based on the metrics discussed and does not represent direct insights from dealer positioning.
Market Breadth and Internals Analysis
Advancers vs. Decliners (NYSE)
On January 2, 2026, the New York Stock Exchange recorded 1,882 advancing issues compared to 882 declining ones.
Breadth Oscillator (McClellan)
The NYSE’s McClellan Oscillator is currently at -18.826, a notable improvement from -76.414 previously. This indicates that while breadth remains slightly negative, the recent uptick suggests a reduction in selling pressure.
Sector Performance Snapshot
Recent market activity has highlighted leadership in the energy sector, along with notable strength in semiconductor stocks, while consumer segments have lagged behind. Should this trend continue, it would support a “grind/range” market environment rather than a drastic “waterfall selloff,” unless unexpected macroeconomic events disrupt the landscape.
Market Dynamics: Minor Wobble vs. Distribution Day
With breadth showing signs of improvement and credit markets not exhibiting significant stress, the current evidence leans towards a “minor wobble/consolidation” scenario rather than a full-scale distribution. This outlook holds, provided that key support levels remain intact and market internals do not deteriorate concurrently.
Credit and Funding Overview
High Yield ETFs
- HYG: 80.67
- JNK: 97.24
High Yield Spreads (OAS)
As of the last available print on December 31, 2025, the ICE BofA US High Yield OAS stands at 2.81%. This level is considered tight and typically signifies “orderly credit” conditions. It is important to monitor these spreads closely; a sharp widening could signal increased risk aversion, which often leads to more significant pullbacks in equity markets.
Sentiment and Crowd Positioning
AAII Sentiment (Latest)
- Bullish: 42.0%
- Neutral: 31.0%
- Bearish: 27.0%
The current sentiment readings indicate a notable tilt toward optimism. While this sentiment alone does not serve as a reliable timing mechanism for market reversals, it effectively diminishes the “wall of worry” that frequently fuels market squeezes.
Cross-Asset and Global Risk Tone
Crypto (Risk-On Proxy)
- BTC: 91,314
- ETH: 3,137.63
The resilience in cryptocurrency prices typically reflects a broader risk-on sentiment, although it should be noted that this is not a definitive indicator for daily movements in equities.
ES vs. NQ Relative Strength
The Nasdaq (NQ) continues to exhibit higher beta characteristics. If NQ consistently underperforms during market rallies, it may hinder attempts for the S&P 500 (ES) to push through resistance levels at R1 and R2.
Scheduled Events(ET):
Mon Jan 5
• 10:00 AM - ISM Manufacturing PMI (Dec)
Tue Jan 6
• 9:45 AM - S&P Global Final Services PMI (Dec)
Wed Jan 7
• 8:15 AM - ADP Employment Change (Dec)
• 10:00 AM - ISM Services PMI (Dec)
• 10:00 AM - JOLTS Job Openings (Nov)
• Late afternoon - Fed speaker risk (watch headlines)
Thu Jan 8
• 8:30 AM - Weekly Unemployment Claims
• 8:30 AM - Productivity and Unit Labor Costs (Q3)
Fri Jan 9 (highest impact)
• 8:30 AM - Nonfarm Payrolls, Unemployment Rate, Average Hourly Earnings
• 10:00 AM - University of Michigan Consumer Sentiment (prelim)
Two A++ setups (Level-KZ Protocol 15/5/1)
A++ Setup 1 - Rejection Fade Short (R1/R2 cap)
Entry: 6934.75-6937.50
Hard SL: 6946.25 (above the 15m rejection wick)
TP1: 6906.50 (S1)
TP2: 6889.50 (S3 top)
TP3: 6875.50 (S4 top)
Invalidation: 15m acceptance above 6940.75 and holding (no immediate snapback)
A++ Setup 2 - Bounce Long (S4 defend)
Entry: 6869.00-6876.00
Hard SL: 6859.75 (below the reclaim wick and below 6861.75 fib magnet)
TP1: 6902.75 (S1)
TP2: 6938.50 (R1)
TP3: 6982.50 (R3 first tag)
Invalidation: 15m bodies holding below 6866.75
Good Luck !!!

2026 roadmap for gold xauusd with my strategy Trading Roadmap Based on a Proprietary Strategy
Introduction
As we look toward 2026, this analysis presents a comprehensive and well-structured roadmap for trading XAU/USD (gold) grounded in my proprietary strategy. The focus is on key market drivers, technical indicators, and geopolitical factors to provide traders with actionable insights and a clear vision of potential price trajectories for gold in the coming year.
Objectives of the Report
Delve into the fundamental and technical aspects likely to influence gold prices in 2026, including anticipated shifts in monetary policy, inflation trends, and global economic conditions.
Identify key support and resistance levels, chart patterns, and relevant indicators that can guide buying and selling decisions, with a particular emphasis on swing positioning.
Analyze the impact of external factors such as interest rates, currency fluctuations, and market sentiment on gold’s performance.
Provide a practical framework for implementing my strategy, equipping traders to navigate the complexities of the gold market and seize profitable opportunities in the year ahead.
Structure of the Analysis
Macro View and Market Catalysts for 2026
Monetary Policy: Anticipated changes in interest rates and policy measures that could influence gold.
Inflation and Economic Growth: Assess global inflation trends and their implications for gold as a safe-haven asset or inflation hedge.
Physical Demand and Supply: Considerations from key markets (jewelry, investment demand, ETFs) and their impact on price dynamics.
Technical Analysis and Key Levels
Key Supports: Identify price levels where reactions are likely.
Key Resistances: Areas where price may encounter resistance.
Important Chart Patterns: Triangles, channels, and other salient patterns guiding potential directional moves.
External and Internal Indicators: Moving averages, RSI, MACD, and other tools embedded in your proprietary strategy.
Geopolitics and Market Sentiment
Geopolitical events and policy decisions by major economies and their effects on fear/uncertainty and hedging demand for gold.
Currency volatility and its relationship with XAU/USD.
Execution Framework for 2026
Entry and exit considerations: Combine key levels with signals from your technical indicators.
Risk Management: Position sizing, stop-loss, take-profit, and risk controls aligned with your risk profile.
Roadmap for Positioning: How to adapt to evolving market conditions and optimize swing opportunities.
Key Takeaways for Maximizing Profitability
Rapid adaptation to economic news and central bank announcements.
Continuous monitoring of technical indicators and dynamic re-leveling of levels on breakouts or retests.
Maintain flexibility in the strategy to accommodate sudden market shifts.
2026 Market Outlook
Technical Analysis and Key Levels
Geopolitical and Sentiment Analysis
Execution Strategy with Actionable Steps
Risk Management and Capital Allocation
Conclusion and Final Outlook for Swing Trading
these levels in my chart are key levels for your swing trade

Unified Support And Resistance Theory: real mechanical levelsBefore we start:
Wave Auction Theory and many preceding posts concerning the levels are now considered legacy. It’s an absolutely working entity, but it’s just a ‘model’.
Volume & signed volume & volume delta would be used interchangeably;
Timeframe = ‘rolling’ amount of data we utilize, e.g. weekly, intra-week.
Resolution = aggregation frequency we use to represent that timeframe, e.g 30m.
E.g a daily (intra-day) timeframe on CME can be represented as 276 5min bars, 46 30min bars, 12 2h bars, or 1380 1min bars, etc. (Yes btw, that's your seasonal windows you heard from me).
Support and resistance levels are exclusively based on (aggregated) tick data, not on orderflow, not on liquidity. Liquidity and CVD based level are structural levels, they form ‘before’ market and limit orders meet, before ticks even emerge. For gaining this information mathematically, you need these 2 scripts: volume analysis & liquidity analysis .
Prerequisites:
Uniform / Sagitta grid , these grid levels would be later referred as anchors or seeds. We would be finding & using only the closest real levels to these anchors.
How levels get positioned & cleared aka consumed aka broken. The same logic would apply to other kinds of levels, not only price-based ones. The main rule stays the same: a level can be positioned with new bars ‘only’ on the same resolution it was located initially.
How to separate (aggregated) tick data into analytical units aka auctions (also briefly mentioned there )
(optional) knowing what Bias-Variance Tradeoff is.
I think USART is not a model, good chances are this is the endpoint source entity. It explains the deepest low-level nature of support & resistance levels, which is tightly linked with information theory. Ironically, the nature of support and resistances is much closer to DSP (Digital Signal Processing) then all this endless variety of custom time-domain filters. Let’s start.
3 Methods of discovering S&R levels
Mathematical method (the blueprint of reality): this is the most general way. Represented by what I called MBAD , QBAD , and PBAD .
- Performs best when market activity is typical or decreased
- Performs ok when market activity is increased
- Performs bad when market activity is extreme
Mechanical method (‘the’ objective reality): these are the real actual levels, this post is focused on them.
- Performs best when market activity is increased
- Performs ok when market activity is extreme
- Performs ok when market activity is typical or decreased
Representation/learning/intuitive/”by feel” method (what objective reality Wants to be): a quick & compressed grasp of reality. An experienced organic would just take a look at the data and ‘feel’ where the levels are. In code, it can be done with a proper clustering algorithm & a couple of other things. The idea is to match the way an organic brain does it. Another script and/or post would be made for this one.
- Performs best when market activity is extreme
- Performs ok when market activity is increased
- Performs bad when market activity is typical or decreased
Also, knowing the 2nd and 3rd method would save you if for some reason your quant math is unavailable atm. Like imagine you rely on MBAD for your objective trading signals, but need to trade / make a decision fast without TV nearby.
Mechanical (real) levels
Signal = information = change
In (aggregated) tick data, supports and resistances are simply locations of change events in (Price & Time & (signed) Volume) field. This is it, the most general and complete definition of what S&R levels really are, mechanically.
These change points carry & reveal & prove information. Imagine a counter example, you have a perfect straight diagonal line (not necessary price movement, any process) that goes on and on forever. There are no distinct points of interest to detect, no S&R levels there, because nothing changes, it just keeps going as it goes. Now once smth changes, e.g it reverses, now we have a point of interest at that reversal.
How to define changes in price, time, volume (necessary for final levels)
Given tick data (aggregated, say 5min chart) has 3 types of fields i.e Price, time, volume delta, we have 3 types of levels as well (we’ll need all the types, but won’t need every individual level).
Choose correct data resolutions first
The mechanical method requires 3 distinct resolutions for each type of level over the same timeframe.
Say our timeframe is intra-week aka inter-day, on CME, we need:
High resolution: last 230 30min bars, for price-based levels. High variance, low bias.
Medium resolution: last 60 2h bars, for time-based levels. Medium variance, medium bias.
Low resolution: last 20 6h bars, for volume-based levels. Low variance, high bias.
^^Me I like to display all 3 resolutions on the same chart
Price-based supports and resistances
^^ When the direction of price movement changes, so simply pivot highs and pivot lows, a couple of examples are marked. Note: when the first or the last datapoint in a triplet is NaN/na, 2 points are enough to detect a pivot high/low. E.g: na, 45, 67: 45 is pivot low; 76, 11, na: 11 is pivot low.
Notice that we use bar highs and lows, these points are recorded by price rule (highest and lowest print of a bar).
Time-based supports and resistances
^^ Basically open-close pairs between the bars: closing print of a bar & opening print of the next following bar. If the previous or next bar is na, like when a session starts/ends. We then use only one print. Study the screenshot pls. After it is clear if a level is becoming resistance or support, we can get rid of one of the prints and choose the final print representing the level: the lowest out of 2 for supports, the highest out of 2 for resistances. Only then levels are considered as formed.
Notice that we use close and open here, these points are recorded by time rule (earliest and latest prints of a bar).
Volume-based supports and resistances
^^ When (inferred or real, depending on asset class) volume delta switches from negative to positive, both bars (say the last with positive delta and the first with negative delta) would provide us 2 levels each: price of the largest sell tick and price of the largest buy tick. This info is unavailable in retail trading platforms, but good news we don’t need it for the assets where we prefer inferred volumes vs the real ones, so equities, bonds, FX. There. Both largest sell tick price and largest but tick price would collapse to bar midrange.
...
The process
Once we know how to locate the levels, we need to pick the ones we need:
Put/imagine the anchors on every finished analytical unit aka auction, and on currently on-going auction. In this post we’d separate market activity into auctions by trading sessions.
Always recall that each anchor has a predetermined lifespan (levels do Not exist 4ever if not-broken):
^^ in mechanical method we don’t use limit levels
After a level is formed (a session is finished):
- Basis lives for 1 more session
- Deviations live for 2 more sessions
- Extensions live for 3 more sessions
- We don’t use limit levels in mechanical method
Look when a new auction opens. We need to find supports below and resistances above.
Find the closest real levels (both positioned and not-positioned ones) to anchors, priority is always: price > time > volume. This way, each anchor would be represented and objectified by 1 or several nearby real mechanical levels. That’s what fibo traders are missing: instead of locating the real price-action based levels ‘nearby’ dem fibo levels, they use the fibo levels like the endpoint truth.
^^ levels for the next sessions
Final hard stop loss & take profit for each level is the level itself +- 1 volatility measure, which is ~ the auction range divided by 3.4641 (aka sqrt12)., of that auction that originated the level. I can explain more how to make it absolutely data-driven and real on request, but it's a negligible improvement.
Improved stop losses: if a level is already positioned (tested), it has a native soft invalidation point. If it’s hit, you can keep the final hard SL but try to exit at breakeven where you’ve entered. It doesn’t mean that the anchor level itself is broken, remember, we can represent each anchor with several real levels nearby.
Improved take-profits: in any doubts, in questionable context etc, 1:1 Risk:Reward is the rule. Because from info perspective, when price leaves the field of a level (remember +- 1 vola measure), it loses contact with it, now it’s outside of the influence area of that level, it means our position also loses the connection with the level from info perspective.
Otherwise, if there’re some supporting factors, you can keep the position, but remember, now you're doing long-n-hold or short-n-hold. One of the supporting factors can be when liquidity and volume imbalance are ‘both’ favoring the hold.
...
∞

#Banknifty Directions and Levels for December 26Bank Nifty current view:
Current view suggests that if the initial market declines and breaks the immediate support level, we can expect a minimum of 58896 to 58822.
Alternate view:
If the market starts positive or if the initial move pulls back, we can expect a maximum of 38 to 61% in the current swing. Structurally, it’s a corrective pattern, so once it reaches that area, the correction may continue there.

MNQ (15m) POI Map — Why These Levels Matter and how to use themMNQ (15m) POI Map — Why These Levels Matter (and how I’m using them)
I don’t like “winging it” once the market starts moving fast. So before the session (or during quieter pre-market hours), I mark **Points of Interest (POIs)** that I expect price to **react from**—either as support/resistance, liquidity targets, or “decision zones” where bias can flip.
These POIs are not magic lines. They’re **locations where order flow has already proven itself**, and where I want to be *ready* instead of *surprised*.
---
## How I chose these POIs (my filter)
Each POI on this chart was mapped using 3 things:
1. **Structure (15m swings / pivots)**
Where price previously *broke structure* or *rejected hard*.
2. **Liquidity (obvious targets)**
Equal highs/lows, clean swing points, and “everyone sees it” areas where stops sit.
3. **Reaction history (clean reactions)**
Levels that have already caused a noticeable bounce, stall, or reversal = worth respecting again.
---
## The Levels (Bull POIs)
### **BULL POI #1 — 25,810.50**
This is my **first decision level** in the current zone. It’s the closest “line in the sand” where:
* Holding above it keeps bullish continuation alive
* Losing it opens the door for a rotation back into the lower POIs
**How I use it:**
If we tag this area and **hold/accept above** (strong bodies, wicks getting bought, reclaim after a sweep), I’m looking for longs targeting the next POI up.
---
### **BULL POI #2 — 25,874.25**
This one is a **higher pivot / reaction zone**—the type of level where price often:
* pauses to consolidate
* rejects for a pullback
* or breaks through and turns into support
**How I use it:**
If price is trending up, this is a logical **first major target** and a spot to either scale profit or look for a clean break-and-retest to continue.
---
### **BULL POI #3 — 25,927.00**
This is a **liquidity + swing area**. It’s the kind of level that’s attractive for:
* stop runs above prior highs
* profit-taking
* reversal setups if momentum stalls
**How I use it:**
I treat this as a “reaction expected” level. If we arrive with weak momentum, I’m cautious chasing longs into it.
---
### **BULL POI #4 — 25,949.25**
This is my **upper extreme POI**—usually a bigger “decision area” where:
* late longs get trapped if momentum dies
* reversals can form (especially after a sweep)
* or we get continuation if the tape is strong
**How I use it:**
I’m more likely to **take profit into this** than initiate fresh longs unless the market is clearly in expansion.
---
## The Levels (Bear POIs)
### **BEAR POI #1 — ~25,754 zone (25,754.25 on my map)**
This is my **bearish trigger / pivot**. If price loses Bull POI #1 and continues lower, this becomes the next major “prove it” level.
**How I use it:**
If we break down into this area and **reject** (heavy wicks, failed reclaim), I’ll look for continuation shorts toward the next bear POIs.
---
### **BEAR POI #2 — 25,649.75**
This is a deeper **demand/reaction pocket**—a level I expect price to *respect* or at least *pause* at.
**How I use it:**
This is a common “bounce zone.” If shorts are in profit, I’m scaling here. If we sweep it and reclaim, I’m watching for reversal setups.
---
### **BEAR POI #3 — 25,622.25**
This is the **lower extreme / liquidity pool** level—where panic moves can exhaust and snap back.
**How I use it:**
I’m not trying to short *into* this level late. This is where I expect **either**:
* a final flush and reversal attempt
**or**
* a strong breakdown continuation (if the day is truly risk-off)
---
## The whole point of mapping POIs
These levels give me a simple plan:
* **Hold above Bull POI #1 → bullish bias stays active**
* **Lose Bull POI #1 → expect rotation to Bear POI #1**
* **Each POI is either a target, a reaction zone, or a bias flip zone**
I’m not predicting. I’m preparing.
---
## Execution Rules (what I wait for at a POI)
At any POI, I want confirmation like:
* **Sweep + reclaim** (liquidity grab then strong close back through)
* **Break + retest** (clean structure change)
* **Rejection candles** (wicks + follow-through away from the level)
* **Acceptance** (multiple closes above/below = level flips)
Then I manage risk using a simple concept:
**Invalidation goes just beyond the POI. Targets are the next POI.**
---
### If you’re using my tool stack:
These POIs pair well with:
* **ORB direction/bias**
* **VWAP/EMA context**
* **Reversal confirmations** (only when the POI + context agree)
---
**Not financial advice. Futures are high risk—size accordingly and protect your downside.**
If you want, I can turn this into a cleaner “TradingView publish-ready” format with a tighter intro + bullet layout, and add your usual TRADESWITHB call-to-action at the end.

Professional Fibonacci Trading GuideMost professional traders use Fibonacci for one reason
It defines where risk and opportunity are asymmetric
Fibonacci levels highlight where pullbacks tend to pause before trend continuation
Not because of magic
Because order flow and trader behavior cluster there
The Only Levels That Matter
✓ 0.50 psychological balance
✓ 0.618 highest probability continuation zone
✓ 0.786 trend validation level
These zones are where professionals wait
Not chase
How It’s Used
✓ Identify a clean impulse move
✓ Draw from swing low to swing high
✓ Wait for price to retrace into 0.50 to 0.618
✓ Enter only after price shows acceptance
✓ Stops sit below 0.786
✓ First target is prior high
✓ Extensions project continuation targets
Why Daily Timeframe
✓ Filters noise
✓ Aligns with institutional flow
✓ Cleaner structure
✓ Better risk to reward
✓ Less overtrading
Lower timeframes distort Fibonacci
Daily charts reveal intent
Key Rule
Fibonacci is not an entry signal
Price reaction is
Wait for price to reach the level
Then wait for confirmation
That patience is the edge
RB Trading
Education only
Risk management required

Why the Reaction Matters More Than the Level!!!Most traders spend their time hunting for the perfect level.✖️
Support. Resistance. Demand. Supply.
They draw the zone… and assume price must react.
But professionals know something crucial:
The level itself is not the edge.
The reaction is.
Here’s why.
1️⃣ Levels Are Common Knowledge
Everyone sees the same support.
Everyone sees the same resistance.
If levels alone were enough, everyone would be profitable.
A level is just a location.📍
It doesn’t tell you who is in control.
2️⃣The Reaction Reveals Intent
What matters is how price behaves at the level.
Ask yourself:
- Does price reject immediately or hesitate?
- Are candles impulsive or overlapping?
- Does price leave the level with strength or drift away slowly?
A strong reaction tells you:
➡️ One side stepped in aggressively.
A weak reaction tells you:
➡️ The level exists… but conviction doesn’t.
3️⃣ Clean Rejections Beat Perfect Levels
A slightly imperfect level with a violent reaction
is far more valuable than a textbook level with no follow-through.
Professionals wait for:
- sharp rejections
- momentum expansion
- structure confirmation
They don’t assume... they observe.
4️⃣ Failed Reactions Are Warnings
When price reaches a level and does nothing…
that silence is information.
Failed reactions often lead to:
- level breaks
- deeper moves
- trend continuation
The market is telling you:
➡️ “This level no longer matters.”
📚The Big Lesson
Levels tell you where to look.
Reactions tell you what to do.
If you shift your focus from drawing levels to reading behavior at levels,
your trading instantly becomes clearer and more objective.
⚠️ Disclaimer: This is not financial advice. Always do your own research and manage risk properly.
📚 Stick to your trading plan regarding entries, risk, and management.
Good luck! 🍀
All Strategies Are Good; If Managed Properly!
~Richard Nasr

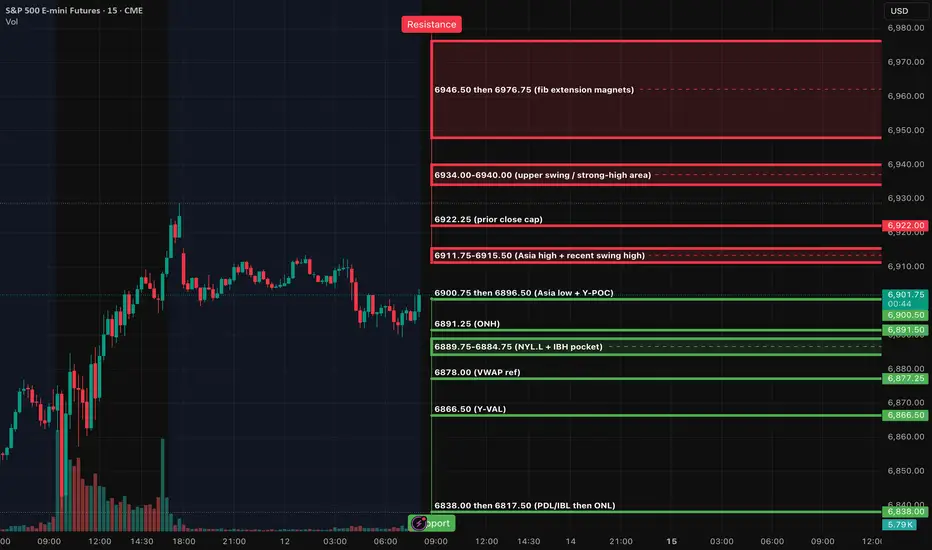
ES (SPX, SPY) Analysis, Levels, Setups for Fri (Dec 12)CONFIRMED EVENTS - FRI 12/12 (ET)
13:00 - Baker Hughes U.S. rig count
15:30 - CFTC Commitments of Traders (COT) release (usual time)
Theme risk: liquidity headlines remain in play with the Fed starting reserve-management T-bill buying on 12/12 (not a data print, but worth respecting).
Market Analysis: Pre-Market Overview
As we approach the market open, the ES is currently positioned near the main pivot point at 6896.50 (Y-POC). Overnight trading saw a rise to the 6911.75-6912.50 range, but prices have since retraced back below a critical resistance zone at 6908.50-6909.25, which includes the year’s value area high (Y-VAH) and the previous day’s high (PDH). This dynamic suggests a cautious trading atmosphere characterized by “tight range first, trend second,” unless we witness a definitive reclaim above this resistance.
When ES gets this tight, it usually means liquidity is being packed for a pop (either direction). The trap is overtrading inside the middle of the box.
Right now the clean box is:
• Premium zone: 6900.75 then 6908.50-6909.25
• Bottom zone: 6892.00 then 6889.75
Key Resistance Levels:
- 6900.75: Asia session low
- 6908.50-6909.25: Significant resistance from Y-VAH and PDH
- 6911.75-6912.50: Upper threshold to watch
If buyers can maintain a position above 6909.25 for 15 minutes, it may set the stage for a rally towards 6922.25, aligning with prior closing levels.
Key Support Levels:
- 6892.00: London session low
- 6891.25: Overnight high
- 6884.75: Further potential support
- 6878.00: Continued downside target
- 6866.50: Year’s value area low (Y-VAL)
A decisive move below 6892.00 could trigger a morning pullback towards the 6884.75-6878.00 zone, with 6866.50 acting as a deeper support reference.
Today’s market activity will likely be influenced by developments in the semiconductor sector. Broadcom is placing pressure on the AI space due to concerns over margins, while Nvidia's outlook is being scrutinized in light of recent China-related headlines. Traders should brace for increased volatility around the 6900 and 6909 levels as movements in semiconductor stocks unfold.
The only significant intraday economic release scheduled is the Baker Hughes rig count, expected at 1:00 PM ET. Investors should also note that larger US economic data releases are anticipated next week, following a backlog caused by the recent government shutdown.
A++ SETUP 1 - REJECTION FADE (SHORT) from 6911.75-6915.50
15m pushes above 6911.75/6915.50 and closes back below 6909.25 - then 5m retest fails - then 1m first pullback gives LH.
Entry: 6909.75-6911.25
Hard SL: 6916.25 (above the rejection wick)
TP1: 6896.50
TP2: 6884.75
TP3: 6878.00
A++ SETUP 2 - ACCEPTANCE CONTINUATION (LONG) above 6922.25
15m full-body close above 6922.25 - then 5m pullback holds 6915.50-6911.75 and re-closes up - then 1m HL to enter.
Entry: 6916.00-6918.00 (on the hold)
Hard SL: 6908.25 (below the hold + back under PDH/Y-VAH area)
TP1: 6934.00
TP2: 6946.50
TP3: 6976.75
Good Luck
#Banknifty directions and levels for December 9th:If the gap down sustains, we can expect the minimum targets of this correction to reach the channel bottom. if the index consolidates or breaks this level, the correction may continue.
> An important point is that this correction may occur gradually, the channel bottom will acting as a strong support.
> Additional technical factors to watch the 20 EMA (on the 15-minute chart) and the 38% Fibonacci retracement level. A break above the 20 EMA or the 38% Fibonacci level can confirm a reversal from bearish to bullish.
Until such confirmation, the market bias remains bearish.
