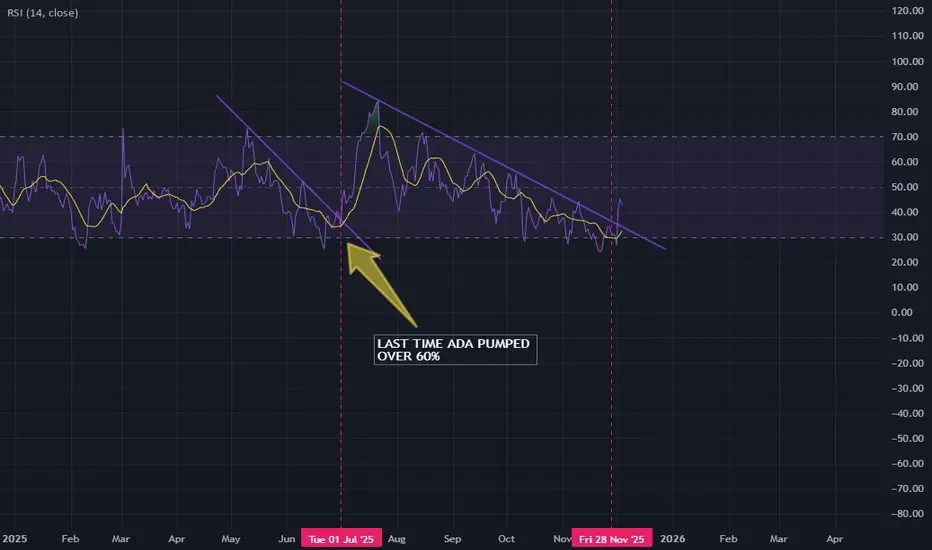
RSI BREAKOUT ON ONE DAY CHARTLast time RSI had a trend line break up on the one day.
ADA pumped over 60%
LINE
GBP/JPY Bullish Breakout SetupGBP/JPY is forming a bullish structure above the trend line after a break of structure (BoS). Price is consolidating and showing potential for an upward move toward the marked target zones near 203.00.

EURUSD in channel resistance rangeHello friends
The EURUSD currency pair has reached the ceiling in the channel resistance range and you can take a sell position at this price.
The stop loss if the price stabilizes above the trend line in the 4h time frame is in the price range of 1.16900
The take profit is in the channel bottom range in the price range of 1.14800
Dear traders, please do not forget about capital management, risk management and adherence to the stop loss.
When the price reaches the target, the update for this currency pair will be posted again, so follow me to be informed about low-risk and successful trading ranges and be the first to know
I hope you are profitable.

BTCUSD: Watching for the Dip and Bounce to the Trend LineHello everyone, here is my breakdown of the current Bitcoin setup.
Market Analysis
From a broader perspective, the price of Bitcoin is currently consolidating within a large Range, just below a major descending Trend Line. This indicates a period of balance and energy build-up after a significant prior move.
Currently, the price is in a corrective pullback within this Range. It is heading towards the lower support levels, a key area where buyers have previously shown strength and absorbed selling pressure.
My Scenario & Strategy
My scenario is built on the idea that this consolidation is a bullish accumulation phase. I think that before the main rally continues, the market will make a small corrective movement down to test the Support zone.
I'm looking for a confirmed bounce from this Support zone around the 109000 level. This would be the key signal that the pullback is over and that buyers are ready to take control for a move towards the upper boundary of the consolidation.
Therefore, the strategy is to watch for this bounce. A successful rebound would validate the long scenario. The primary target for the subsequent rally is the 115500 trend line at the top of the Range.
That's the setup I'm tracking. Thank you for your attention, and always manage your risk.

SWDY Decrease AnalysisSWDY stock is in a decreasing zone. It reached the lowest support line at 73.011. In case of rebounding up which is highly expected, it'll reach the resistance line 75.011 to reach the 75.215 then the 3rd at 75.338

EGX30 Trend Line AnalysisEGX30 stock is currently falling but rebounded at the support line 31,365.902. In case of taking an upward trend it is expected to breach the resistance line at 31,543.291, then reach the resistance line at 31,681.261. In case of falling it's expected to break the 1st support line 31,316.627 then the 2nd support line 31,227.932, then the 3rd support line 31,198.367

SWDY Trend AnaylsisSWDY stock is in a downward trend. In case of falling, it's expected to break the first support line at 78.025 points, till it reaches the second support line at 76.249 points. In case of rising, it's expected to reach the first support line 78.687, the second support line 78.928, and the third support line at 79.019, which is highly anticipated due to its latest acquisition.

How to use Trading View - Part 2 - Drawings and AlertsHow to use Trading View - Part 2 - Drawings and Alerts
Remember to assign different colours to different Time Frames as we saw in the last video. www.youtube.com
Also, you can be a bit innovative and use the Trend lines to create alerts not just for the price but time as well.

How to use Trading View - Part 1 - Trend Lines and Time FramesHow to use Trading View - Part 1 - Trend Lines and Time Frames
Use these different tools to make the most of your trading View account.
Make sure to differentiate your time frames so that your charts are decluttered and you have a very clean chart handy always.
Avoid drawing too many lines and drawings at irrelevant time frames.
Keep it Simple,
Keep it Consistent,
Keep it Clean.

LTC breakout, buying opportunity potentialLittle more than a few days ago I posted a very similar breakout for XRP. The market answered and we sore some parabolic upward lunges. LTC has been slow to react to the overall bullish sentiment within the market. But as before, I've been monitoring it closely and awaiting a potential buy signal. Today, it looks as though there is an event, MACD and volume breakout to give us a very strong buying signal. I just wonder if we'll see the types of lunges we saw with XRP and whether this overall trend line breakout and orgasmic upward lunge that we saw with XRP will be typical with other coins. Perhaps LTC is next? I'm on the train, let's put it that way. Follow for more.

BTC, could it be that simple?We've seen a surge of BTC of late, and a wonderful popcorn affect of a large number of ALTs, including some lesser known one. The upper trend line could act as resistance for BTC pushing it down slightly to complete wave 4 of 5. Not forgetting that this is only wave ONE of 5 of the highest degree of trend. So, we still have 2,3,4 and 5 to go to the upside. Forewarned, there may well be a little bump down as we buffet against the upper trend line but what goes down, must go up! Follow for more.

GBPAUD Bullish It's in bullish mode because:
-Brook down trend
-Liquidity taken
-Dos not touch the lower channel line

My Guides Line for Monthly Chart!with the time seeing Btc Price // i see the harmonical trends line ocorrurring// and i follow them before it happen.. and i can use it to sell or buy.. but in the last times, i lost some coins because i selling on worry time.. sorry friends;. its are guides line to see future prices what will could be happen..

(BTC) bitcoin "support & resistance"BTC chart view using RSI support & resistance combined indicator by DGT appears to show a new support price line very near where the price is now. Before this time and the last few days there was nothing but resistance lines for days, months even. The red line basically supplants the fact that there is a new established level to determine where the price may increase from. Typically there can be fears to seeing this line if the investment does not break from the pattern line and rise above. With BTC because the value is so large at over $1.4 trillion USD I'm not sure what to think other than that it's literally making a statement that says BTC is reaching a level of maximum sales and profit buying from investors where the counterbalance is beginning to favor on the side of selling.

Bitcoin can exit from pennant and continue grow to 45400 levelHello traders, I want share with you my opinion about Bitcoin. By observing the chart, we can see that the price a few time ago declined to the 41400 support level, where it turned around and started to rise inside the upward channel. In the channel, BTC rose to a 45400 resistance level, which coincided with the seller zone and soon broke this level. Price rose a little higher, after which it exited from the channel, entered to pennant, and at once made a downward impulse from the resistance line to the support level, thereby breaking the 45400 level one more time. Next, BTC some time traded near the 41400 support level, and later it declined to support line of the pennant, breaking the support level, but soon price turned around and in a short time rose back. Also recently BTC rose to the resistance line of the pennant, where it continues to trades near now. So, in my mind, Bitcoin can break the resistance line, thereby exiting from the pennant, make a retest, and then rebound up to the resistance level, or after the breakout of the resistance line, BTC will at once continue to move up to the resistance level. For this reason, I set my target at the 45400 resistance level. Please share this idea with your friends and click Boost 🚀

in workim thinkink about two possibles trends up to 2025 building the guides line in fibolevels, but, find fibo level for future is almost impossible, but is not impossible.

golden trend line price are coming down from 2088 level on h4 time frame
price is making lower low with lower high a clear down trend below yellow
if trend line breakout instant bullish from 2016 but until breakout it is bearish


AUDUSD: Fake move!Hello traders,
Bearish trend-line was broken the day before yesterday! It was a fake one! It triggered SL of some traders, including us, and came back again. Any pips below 0.6285 will activate our order around 0.6367
Take care!
AUDJPY: Could GDP Release change the trend?Hello traders,
AUDJPY Is going upward.
Our main Scenario is the long one:
Long Scenarios:
After breaking 95.050, We'll wait for a retracement.
TPs are: 95.650, 96.600
SL: below 94.700
Short Scenario will be published in case of breaking the upper trend-line.
Pivot points, Support and Resistance and also Sentiment data were used for this analysis.

AUD /CHF swing pointHello traders
I see sellers entering from a swing point. I expect the price to drop to equilibrium at least for a correction


Price Action breaking Equilibrium zone?Hey Guys,
For now our buy order is in 19% profit. So we set our stoploss to break even. When price action on SHIBUSDT breaks the Equilibrium zone we will make huge profits!
Cheers!
