LINE


Trading view: USDJPY 09/06/16WAIT for the BO, then WAIT for the consolidation/retracement and ENTER in the BO of the consolidation --- this is the WWE pattern :)

Don't miss that trade. Really nice risk reward.I looking for price action about 0.70500 zone, maybe a pinbar on beeb bearish outside bar.
Potential triple top on daily.

USDJPY SHORT IDEA 1:2 USDJPy has pushed through horizontal level @ 109.68 to now test strong daily trend line currently seeing indecision.
if price can break below 109.85 showing strong continuation... looking to take short a position with stops at previous 8 hour candle high 110.48
1:2 targets


USDJPY: More Weakness Could Be In StoreIf our view above is correct then JPY will gain even more in the next few sessions or even days. That said, we will keep a close eye on USDJPY for possible shorts after a pullback as leg down from March high looks like a new five wave decline in play. Our special focus should then be on black wave 4 for shorts, while 112.01 level remains in play.
www.ew-forecast.com
@ewforecast

AUDJPY - Potential for multiple Day and Swing Trading setupsMultiple swing and day trading setups on the 15m and 60m time frame.
I've simply applied predictive analysis to forecast price action over the coming days or weeks. Techniques I used for this are advanced patterns, trend lines, breakout patterns and Fibonacci ratio levels.
The positive expectancy on this type of strategy has been very high provided that we see this type of pattern develop on all the time frames.
All the best

USOIL - Long outlookThis has been on a relentless selloff for nearly 2 years, oversupply is currently in place, but if that changes with OPEC etc then demand may return (albeit temporarily), to start up a mini bull market for oil but we doubt it will go much higher that $45.00 in the near future and in fact maybe lower lows.

AUDNZD breaks 1.0880 Handle - Bullish Bias Confirmed.As we enter the weeks and months ahead we are likely to see price rise to the 1.085 and even 1.1300 handle. On January 27th, we have a strong Bullish break of the 1.0880 handle. This gave me confirmation that price likely tends to climb up a good ways before making it's way elsewhere.
Trade Idea: Waiting for a retrace to 1.0880 and a proper show of rejection. Looking for an opportunity to LONG.

USDJPY long ideaHello everyone, i will be posting here my ideas, so i can keep track of them.
Why i dont publish in private? Because i am open to any suggestion, so if anyone wants to tell me something about the idea i published, i will be glad to read what he or she has to tell me !
In this case i am posting the pair usdjpy, which seems to be on a corrective structure. On the 1H chart there is a clear impulse up (arrow) followed by a correction, so buying when the trendline is broken should be a good idea.
I will stop looking for buy setups when price goes below previous low of the impulse up.

GBPNZD 240M: Breakout of Trendline + Retest Learn to Trade Harmonic Patterns at www.plantotrade.com
The GBPNZD just broke the lower Trendline and now retests the privous price level. A good opportunity to get involved in the trade. We expect price to move down to retest the previous swing low level.


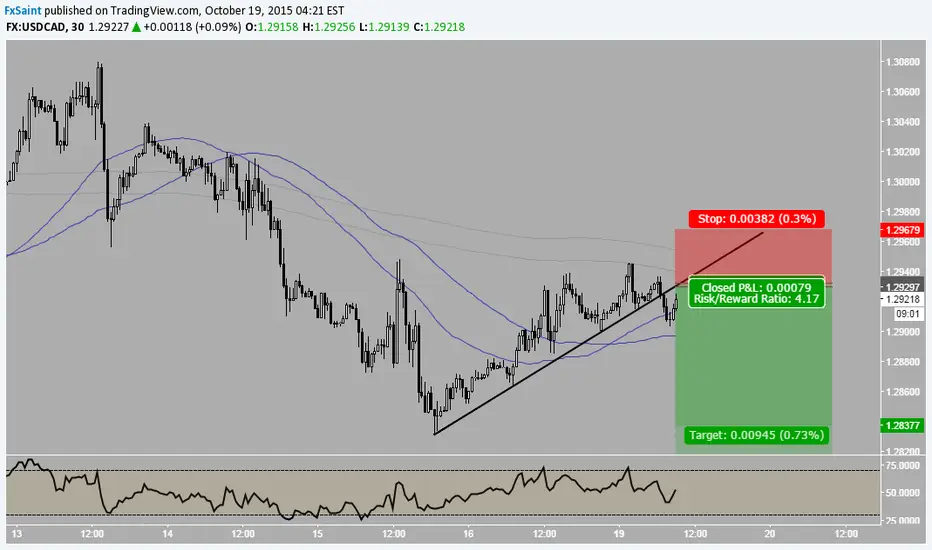
USDCAD - LineShorting this pair keep my trust on line. If grounds are ready than USDCAD will fall after tapping this line.
Bitcoin Awaits Price Reaction to Hagopian LineIf price closes above the Hagopian Line, it's likely that pivot 2 (p2 on the chart) level will be tested.

Opening week sell possibility 2 - GBP/USD2. GBP/USD
Recently, resistance has been eye-catching on GBP/USD in the 1.5660 area where price closed off of last week not only rejecting this price proximity but also warding off trend line support that price action broke through in the last week of August. This duo of resistance proposes a price movement to the downside over the coming days.
entry - below low of bearish bar
stop loss - above high of bearish bar
target - at previous support levels/lows

GBPUSD LONG ideasMarket is being cross-shareholdings . Market might take a big profit and to break above the resistance line of 1.5375 . On top of 1.54413 because there is no resistance line . So there is a possibility to go missing over at once .

Outlook for next months--- Please readjust the scaling so that the spiral sits just above recent price action ---
We are still in the process of consolidation.
In my opinion, the recent drop should not be interpreted as a meaningfull breakdown.
It's still within the acceptable range.
Price bounced of the longest possible MA at 222 (using Bitstamp due to good historic data).
A break (not pierce!) of the red upsloping line would give a clear sell signal with targets in the OTE buy zone 186-200.
Also consider the yellow trendline crossing the OTE zone.
A buying signal is a bit more complex so I subdivided it into 3 signals:
1. Buy : cross of red spiral and no new lows after that.
2. Buy : break of green trend line and holding the 231 level.
3. Buy : break of red log dowtrend line + breaking & holding of strong resistance at 260 for more confirmation
The target depends on how long you would you like to stick to your longs.
I would close all longs at 340 - 375 levels max.
Good luck ! : ]

$GPRO Potential breakout. Breakout potential through trend line resistance. 20 DMA support holding up.


SN Sanchez Energy Accum/Dist Breakout to All Time HighsSanchez Energy's chart may look down-and-out with recent profit taking, but actually it is the Accumulation/Distribution Line (ADL) that tells the real story. The ADL has broken out to all time highs, and now the chart has to play catch-up and rally, the Heikin-Ashi TrendBars are signalling that the new bullish trend has already started.
Reference ADL Divergence
www.tradingview.com
