LINEA/USDT at Decision Zone — Breakout or Further Decline?LINEA/USDT remains in a medium- to long-term bearish structure. Since the peak around the 0.043+ area, price has consistently formed lower highs and lower lows, confirming strong seller dominance. Currently, price is trading near the lower boundary of the structure, close to historical lows, while also interacting with the major descending trendline.
---
Pattern Explanation
Primary Pattern: Descending Trendline / Bearish Trend
A well-defined descending trendline connecting the major highs.
Every rebound attempt has been rejected by this trendline.
Market Structure
The overall structure remains Lower High – Lower Low (LH – LL).
No valid break of structure (BOS) toward bullish conditions so far.
Price Behavior
Price recently showed a minor bounce, but remains capped below the descending trendline, indicating bearish continuation unless a breakout occurs.
---
Key Levels
Resistance Zones:
0.00750 (nearest resistance & trendline area)
0.00930
0.01090
0.01300
0.01500
0.02125 (major resistance / distribution zone)
Support Zones:
0.00632 – 0.00600 (current minor support)
0.00500 (major support / all-time low area)
---
Bullish Scenario
Price successfully breaks and closes above the descending trendline on the daily timeframe.
Additional confirmation if price:
Holds above 0.00750
Forms the first higher low
Bullish targets:
0.00930
0.01090
0.01300
This scenario is considered a relief rally or corrective move, unless a major structure shift occurs.
---
Bearish Scenario
Price fails to break the trendline and gets rejected.
A valid bearish continuation if:
Daily close below 0.00600
Downside targets:
0.00500 (key support)
If 0.00500 fails, the risk of new lower lows increases due to lack of historical demand below this zone.
---
Conclusion
LINEA/USDT is still under strong bearish pressure. As long as price remains below the descending trendline, any upward movement is likely to be a pullback before continuation to the downside. A bullish bias only becomes valid after a confirmed trendline breakout with structural change. Traders should wait for clear confirmation and maintain strict risk management.
#LINEAUSDT #LINEA #CryptoAnalysis #TechnicalAnalysis #BearishTrend #DescendingTrendline #Altcoin #MarketStructure #SupportResistance
Linea

LINEA Update📊 LINEA Update
LINEA failed once again to break out above the red resistance zone 🔴
This shows that sellers are still strong at this level, keeping pressure on the price ⚠️
A clean breakout above the zone would be needed to confirm bullish momentum 📈

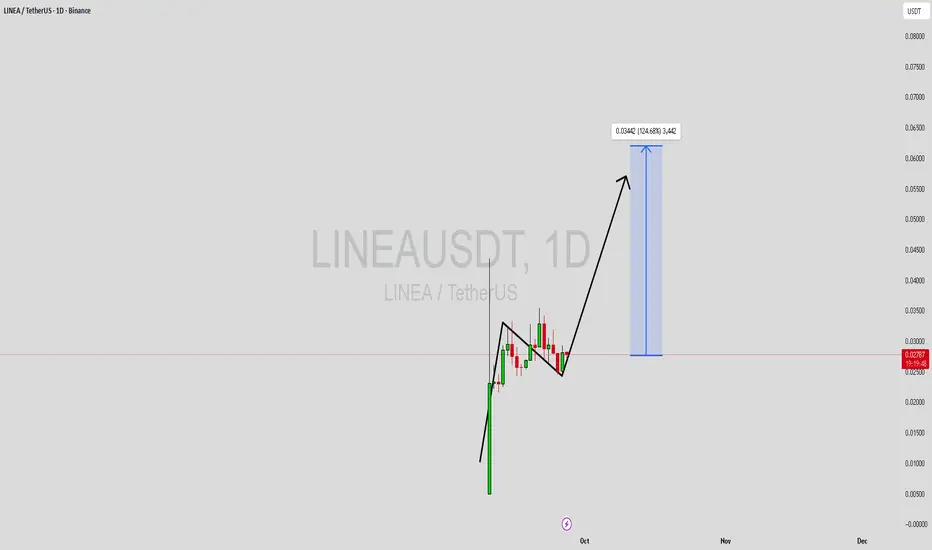
LINEAUSDT Forming Bullish WaveLINEAUSDT is showing a strong bullish wave pattern that signals momentum is building for a potential breakout move. The structure reflects sustained accumulation, supported by good trading volume, which highlights that investors are actively positioning themselves. With this technical setup, the pair is projected to aim for gains around 90% to 100%+, making it an attractive candidate for traders looking for high-reward opportunities.
The bullish wave formation often acts as a continuation of upward momentum, and LINEAUSDT appears to be respecting this setup well. The price action has been consolidating in a healthy manner, creating a strong base that could fuel a sharp rally once resistance levels are cleared. This type of accumulation phase typically precedes impulsive moves, giving traders confidence in the medium-term outlook.
Investor interest is also on the rise, as seen from both volume participation and the consistency of market support. If momentum continues to build, LINEAUSDT could quickly establish itself as one of the notable performers in the current cycle. The alignment of technical structure, volume, and sentiment positions this pair favorably for the coming sessions.
✅ Show your support by hitting the like button and
✅ Leaving a comment below! (What is You opinion about this Coin)
Your feedback and engagement keep me inspired to share more insightful market analysis with you!
LINEAUSDT Forming Bullish WaveLINEAUSDT is currently shaping a bullish wave pattern, a strong indicator that the market could be preparing for a significant upward rally. This pattern highlights the continuation of buyer dominance and signals the possibility of sustained price growth. With an expected gain projection of 90% to 100%+, this setup is catching the attention of traders looking for high-potential opportunities in the altcoin market.
The trading volume remains solid, which is a positive factor confirming the validity of this bullish setup. Healthy volume indicates strong investor participation and liquidity, both of which are crucial for a breakout to sustain momentum. When coupled with a bullish wave pattern, these signals make LINEAUSDT an attractive option for those seeking mid- to long-term gains.
Investor interest in this project is on the rise, further strengthening the bullish outlook. Growing engagement from traders and institutions alike could fuel even more demand and create conditions for accelerated price action. As the wave pattern continues to develop, this pair is positioned well for a breakout phase that could deliver substantial returns.
✅ Show your support by hitting the like button and
✅ Leaving a comment below! (What is You opinion about this Coin)
Your feedback and engagement keep me inspired to share more insightful market analysis with you!

Linea 4H Linea is playing well on 4 hour time frame. Absolutely great structure of Higher High and Higher Low. We can expect the targets shown on charts. NFA DYOR..

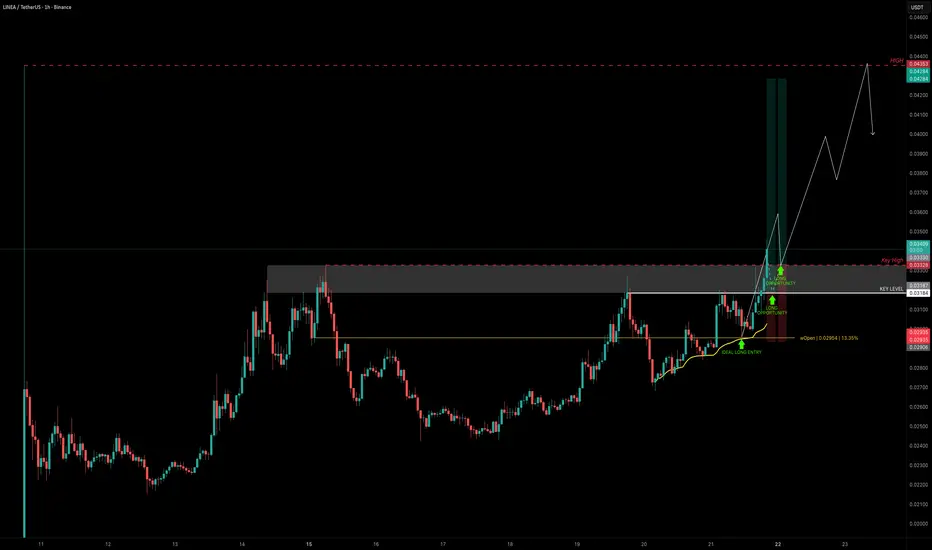
LINEA — $0.033 Key Break Could Unlock Big UpsideLINEA is starting to look interesting. Currently trading around $0.032 (~500M market cap), this level acts as resistance that needs to be broken for bullish continuation.
Earlier today, we already had a clean long setup from $0.03 support, in confluence with the weekly open ($0.02954) and anchored VWAP (yellow line), which held and gave a solid bounce.
Next Long Setup Idea
Entry 1: Watch for a breakout above the key high at $0.03328, then retest for confirmation.
Entry 2: Alternatively, a hold above $0.032 could offer a safer re-entry.
Stop-Loss: Below $0.03 support for now.
Targets
TP1: $0.036
TP2: $0.04
TP3: $0.043
Final Target: $0.065 (aligns with 1B market cap resistance)
This setup could yield:
+30% gain if exited around $0.043
+100% potential if momentum drives price into the $0.065 zone
Quick Take
A breakout and retest of $0.03328 would open the path toward the $0.036–$0.043 zone. If momentum continues, the 1B market cap resistance at $0.065 becomes a realistic macro target.
🔍 Indicators used
DriftLine — Pivot Open Zones → For identifying key yearly/monthly/weekly/daily opens that act as major S/R reference points
➡️ Available for free. You can find it on my profile under “Scripts” and apply it directly to your charts for extra confluence when planning your trades.
_________________________________
💬 If you found this helpful, drop a like and comment!
LINEAUSDT: Inverse H&S Breakout!LINEAUSDT is showing a strong Inverse Head & Shoulders pattern on the 4H timeframe, signaling a potential bullish reversal after weeks of consolidation. Price has now broken above the neckline, opening the door for a continuation move to the upside.
Key Points:
- Clear Inverse H&S with Left Shoulder – Head – Right Shoulder.
- Neckline breakout confirmed with bullish momentum.
- Volume profile shows heavy support around 0.029 – 0.030 zone.
Trade Setup:
- Entry Zone: Above neckline breakout (~0.033–0.034).
- Target Zone: $0.055
- Stop-Loss: Below 0.0265
Cheers
Hexa

LINEA - Crime Pump ?Linea continues to trade inside a well-defined range, with the red zone overhead acting as a heavy supply block.
> Range Structure:
Price action remains trapped between 0.0223 – 0.0310, with no clean breakout on either side. Until we clear resistance, expect continued chop.
> Critical Resistance:
The red area (0.0310–0.0327) is the gatekeeper. A decisive breakout above this zone is the first real confirmation for a bullish trend shift and potential strong upside momentum.
> Support Levels to Watch:
0.0249
0.02239 (range bottom / last line of defense)
TL;DR
No breakout, no trend. Until Linea takes out the red supply zone, we’re stuck in a range and price will likely keep chopping sideways. Break above = bulls step in. Fail = extended range play.

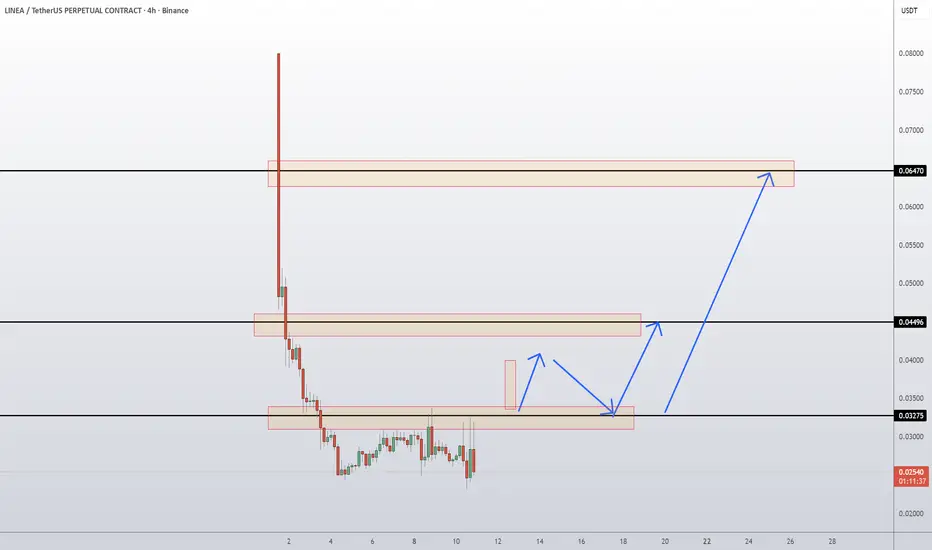
Linea Coin Token Prediction and Technical AnalysisLINEA/USDT remains under heavy selling pressure after its sharp launch spike, but price is now consolidating in a narrow range just below the 0.0327 resistance. The chart shows possible accumulation, with buyers looking to defend this base for a potential recovery. If price reclaims 0.0327, a push toward the next key resistance at 0.0449 could unfold. Sustained strength above that level opens the door toward 0.0647 major resistance. On the downside, repeated failure to hold above 0.0327 risks dragging price back into weakness.
📈 Key Levels:
Buy trigger: Reclaim and hold above 0.0327 support
Buy zone: 0.0327 – 0.0350 region
Target 1: 0.0449 resistance
Target 2: 0.0647 resistance
Invalidation: Daily close below 0.0250 (would extend bearish pressure)
👉 Follow me for More Real Time Opportunities.
Share your Thoughts if you have any?
Foxy long - time to shine soon!?Foxy looks good!
Foxy's price licks the edges of the cup perfectly.
Within 2-3 weeks, it is very possible that Foxy will fight through the yellow resistance around 0.0175. If Foxy then continues (which I believe) with an upward move, I think we can reach the all time high quite quickly. A possible 100% trade right here.
Zoom in to find a good entry and compare it to all other opportunities in the market right now.
Foxy is a risky meme coin, non financial advice!

EURGBP pronosticoexiste un fuerte techo, un valor anterior que esta transformando en piso, seguimos en tendencia, y topa con la linea de tendencia, que indica que seguira subiendo.
depues es probable que haga un patron de Hombro cabeza y hombro, para descender. habria que darle segumiento

AUDUSD short 4HEn temporalidad Diaria tocó la linea de tendencia principal bajista, por lo tanto está en una zona con gran probabilidad de ventas, y más aún sumándole esta confirmación de rompimiento en 4h.

GBPUSD long D - swingRuptura de tendencia, nivel 27 del fibbo alcista, y buena posición en RSI, por lo que el panorama da grandes probabilidades a nuestro favor.

GBPAUD short 4hPosible movimiento, teniendo en cuenta nuestra estrategia de rompimiento de linea de tendencia, RSI y estructura con un alto más bajo.
