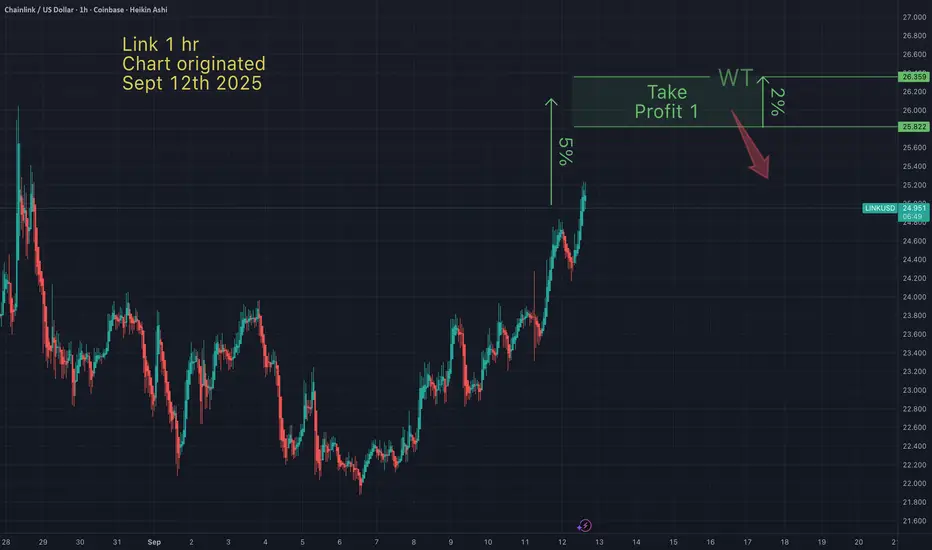
Link - Take profit targetI anticipate Link will hit my take profit this weekend. I bought the bottom last Sunday, so I'm happy with my profits, even if Link goes higher than my TP.
May the trends be with you.
LINK
LINK/USDT 12h chart🔹 key levels
• Support (red lines):
• 21.73 USDT → First strong support (tested several times).
• 20.17 USDT → Another key support (potential descent, if the price drops below 21.7).
• 18.10 USDT → deeper support (larger pullback).
• resistance (green lines):
• 23.22 USDT → The price is currently testing this level.
• 24.14 USDT → strong resistance if you manage to break 23.2.
• 25.54 USDT → Higher resistance, last local peaks.
⸻
🔹 Trend
• We see an upward trend (orange trend), which was defended at around 21.7.
• The price is currently testing the top of the channel → If the candle closes above 23.2, possible movement towards 24.1 - 25.5.
⸻
🔹 oscillators
• Stoch RSI:
• strongly bought (blue and orange line high in zone 80).
• It may suggest short -term withdrawal if there is no breakdown.
• RSI classic:
• He bounced off the level ~ 40 and grows slightly.
• Still a lot of space to grow before entering the purchase zone (70+).
⸻
🔹 Scenarios
1. Bycza (Bullish):
• Breaking above 23.2 USDT and confirmation of this level as support → Target 24.1 and 25.5.
2. Bear (bearish):
• Rejection from 23.2 and Trendline fracture down → decrease to 21.7, and then even 20.1.
⸻
✅ Summary:
The link is now at an important moment - either it will break 23.2 and will go higher (24-25.5), or will reflect and return to around 21.7. The oscillators show that there may be a small correction short -term, but the medium -term trend still looks upwards.

what I will do with link “Waiting for a range breakout and reversal at 22.61 to target 23.74 for a 5% move, stop at 22.07, 2:1 ratio.”
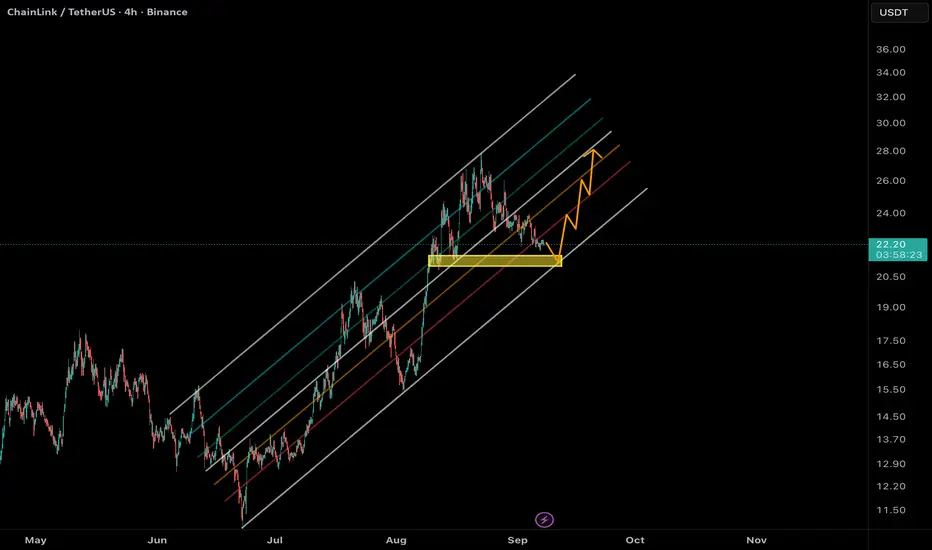
Chainlink (LINK/USDT) AnalysisLINK is currently trading around $22.2.
According to the ascending channel structure, if the price pulls back to the channel support near $21.4, we could expect a potential bullish reaction from this level.
🎯 Possible upside targets in case of a rebound:
• $23.8
• $26
• $28
⚠️ However, if the $21.4 support fails to hold, a deeper correction toward $20 may occur.
LINK/USDT - SHORTI expect this decision to be implemented in about a month or two.
(This is not an investment recommendation).

Chainlink 4H Update | LINK Testing $23.50My bias is still more upside mid-term. On the 4-hour chart, if LINK reclaims 23.50, the path opens toward 24.83 and 26.71. If it fails and drops below 22.78, the next supports are 21.92 and 21.62. The immediate battle is all about whether buyers can flip 23.50 back in their favor.

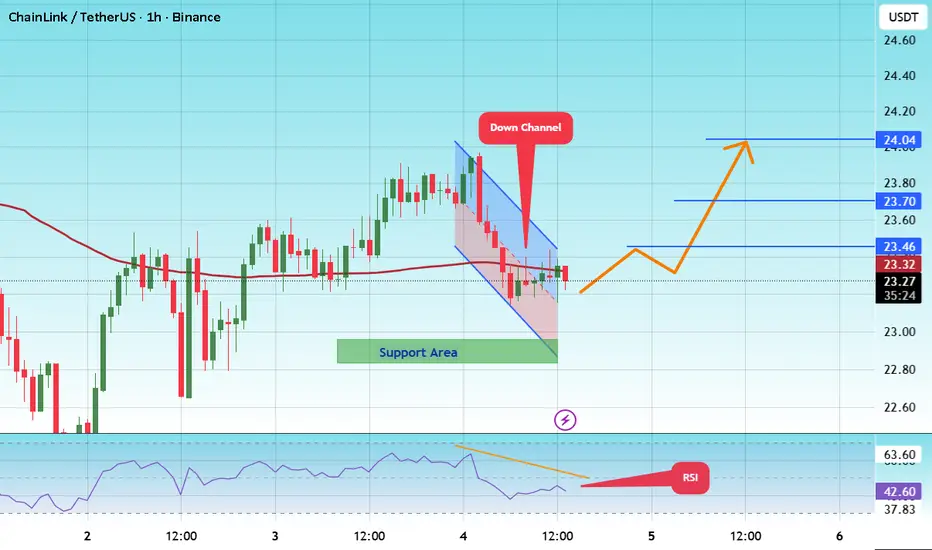
#LINK/USDT – Triangle Pattern Breakout Loading?#LINK
The price is moving within a descending channel on the 1-hour frame and is expected to break and continue upward.
We have a trend to stabilize above the 100 moving average once again.
We have a downtrend on the RSI indicator that supports the upward move with a breakout.
We have a support area at the lower boundary of the channel at 23.00, acting as strong support from which the price can rebound.
We have a major support area in green that pushed the price higher at 23.00.
Entry price: 23.26
First target: 23.46
Second target: 23.70
Third target: 24.00
To manage risk, don't forget stop loss and capital management.
When you reach the first target, save some profits and then change the stop order to an entry order.
For inquiries, please comment.
Thank you.
LINK/USDT — Golden Zone Will Decide the Next Move!?Current Price: ~23.47 USDT
Chainlink (LINK) has just completed a strong rally from the yearly low at 10.10 to the peak of 30.94. Now, the price is consolidating and retesting the Fibonacci Golden Pocket — a critical area that will decide whether the uptrend continues or a deeper pullback occurs.
---
🔎 Market Structure Analysis
Primary Trend: Strong bullish reversal since June 2025, with higher highs and higher lows forming.
Current Condition: Price is pulling back from the recent top (30.94) and consolidating around 23–25, right above the Golden Pocket (21.18–19.86).
Key Demand Zone: The yellow area (19.8–21.2), previously a strong resistance, is now acting as support (supply → demand flip). Holding this zone is crucial for the next big move.
---
🟢 Bullish Scenario
If LINK holds above 21.18–19.86, the current move is likely just a healthy retracement before continuation.
Confirmation: Daily close above 25.24–26.65 with rising volume.
Upside Targets:
🎯 Target 1: 25.24 (minor resistance)
🎯 Target 2: 26.65 (key breakout level)
🎯 Target 3: 29.20
🎯 Target 4: 30.8–31.0 (previous high)
Breaking above 30.8 could open the door for new highs in the coming months.
---
🔴 Bearish Scenario
If price fails to defend the 19.86–21.18 zone, a deeper correction may unfold.
Confirmation: Daily close below 19.8 with strong selling volume.
Downside Targets:
⚠️ Target 1: 15.63 (Fib 0.5)
⚠️ Target 2: 14.69 (Fib 0.618)
⚠️ Extreme Target: 10.10 (yearly low in case of panic sell).
---
📌 Key Technical Patterns
Bullish Flag / Consolidation: Current price action resembles a bull-flag formation after a strong impulse.
Supply-Demand Flip: The yellow zone (19.8–21.2) flipped from resistance into support — a decisive area for market structure.
Golden Pocket Fib: 0.5–0.618 retracements are historically strong levels for trend continuation.
---
🧠 Conclusion & Strategy
LINK is currently at a make-or-break golden zone.
Bullish Case: Holding above 19.8–21.2 keeps the bullish structure intact → targets at 26.6, 29.2, and 31.
Bearish Case: A breakdown below 19.8 opens risk for a correction toward 14–15 or even back to 10.1.
Trading Plan:
Accumulate near 21–23 if signs of bounce appear.
Breakout entry above 26.65 for swing targets at 29–31.
Place stop-loss below 19.8 to protect long setups.
Take partial profits at each resistance level.
---
📌 LINK is standing at a critical decision zone. Will buyers defend this golden pocket to fuel another leg up toward 30+? Or will sellers drag the price back to 15 and below?
#LINK #LINKUSDT #Chainlink #CryptoAnalysis #Altcoins #SwingTrading #TechnicalAnalysis #CryptoTA #Fibonacci #PriceAction

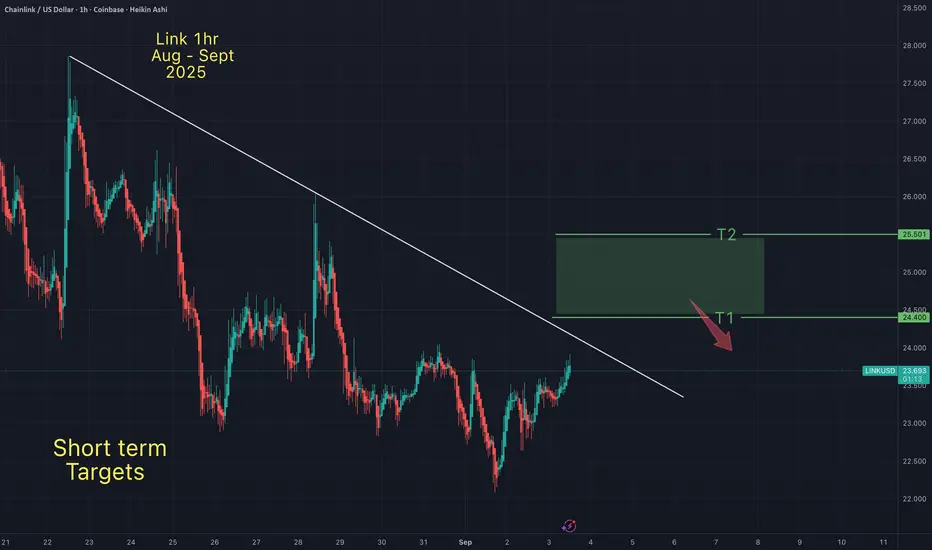
Link - Short term targetsI posted my midterm Link targets on my Aug 30th Link chart. These are my shorter term targets. I expect Link to follow Btc up to my Btc targets (see my Sept 2nd Btc chart). Then I expect both assets to retrace. At that point I will be on "lower low watch".
May the trends be with you.
Chainlink Is About To Skyrocket To A New All-Time High!I believe Chainlink will blast off here to a new all-time high. We are seeing consistent, steady volume over time. LINK has consistently been in the top 20 coins in 30-day trading volume month after month. This will lead to one of the biggest pumps, if not the biggest pump, Chainlink has ever seen in terms of percentage gain.
As always, stay profitable.
Dalin Anderson.

LINK — The $20 Pivot ZoneLINK has been in a corrective phase, dropping –21% in the past 10 days. The big question: where is the next high-probability long entry?
Looking at the liquidity, there’s a clear pocket between $21–$20 where many stop-losses are positioned. Let’s break down the confluences.
🧩 Confluence Support Zone ($21–$20)
0.618 Fib retracement of the move: $20.19 → sits right in the liquidity pocket
Yearly Open (yOpen): $20.02 → major confluence
Psychological level: $20 key support
Trend-based Fib extension 1.0: $21.04 → ideal entry zone
Anchored VWAP: ~$20.85 → additional support
55 EMA ($20.835) / 55 SMA ($20.33) (daily): strong dynamic support cluster
0.73 Fib Speed Fan: aligning with the zone
Imbalances (FVG): could be filled here
Together, these create a solid support range between $21–$20 for long positioning.
🟢 Long Trade Setup
Entry Zone: $21–$20
Stop-Loss: Below golden pocket / yearly open
Target (TP): $30.94 (key high + potential short opportunity)
Potential Move: +50%
R:R: 1:5+
🔍 Indicators used
DriftLine — Pivot Open Zones → For identifying key yearly/monthly/weekly/daily opens that act as major S/R reference points
Multi Timeframe 8x MA Support Resistance Zones → to identify support and resistance zones such as the daily 55 EMA/SMA.
➡️ Available for free. You can find it on my profile under “Scripts” and apply it directly to your charts for extra confluence when planning your trades.
_________________________________
💬 If you found this helpful, drop a like and comment!

Chainlink Rising "Mid-Air" · Long-Term Support FoundThis is perfect. Here we can see Chainlink growing in "mid-air." Can that be said?
"Mid-air" because the rise keeps on happening and the retrace finds support where there is no support; that is, LINKUSDT continues to grow straight up. This is as good as it gets.
We had only five days red and LINK turns green again. This doesn't change anything on the smaller or bigger picture, market dynamics remain the same.
If this day is red, the next day red and another 3, 5, 9 days red; it doesn't matter, we are in a bullish wave.
If this day is green, the next day green, then red, then green and so on; it doesn't matter, you are looking at market noise.
The noise will continue and at times it will even intensify. Volatility will also increase as prices continue to increase. Trading complexity will be up. Risk will be higher but, right now, it is still early because Chainlink can easily hit $100+. Knowing this, I buy and hold.
Namaste.

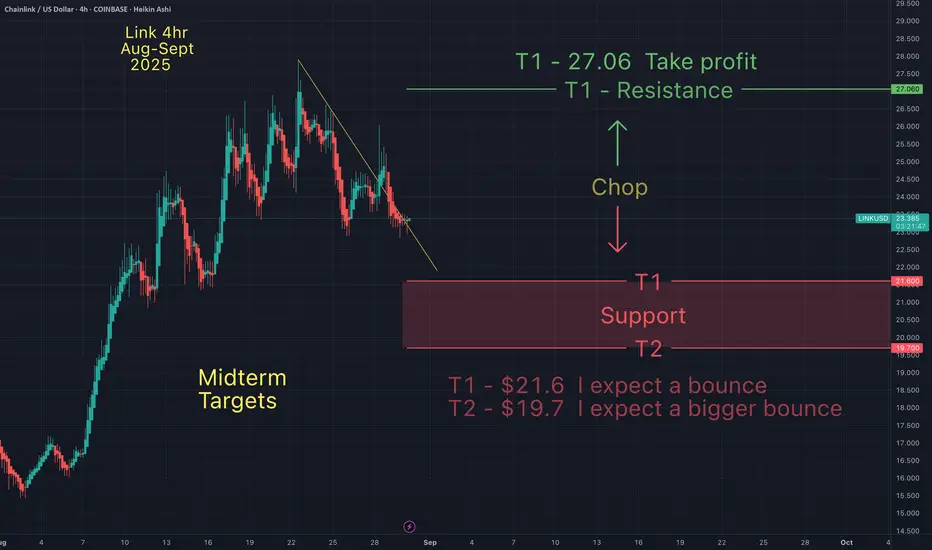
Link - Midterm support and resistance & my take profit targetsRecently, Link has been one of my favorite altcoins to trade. This chart shows my support and resistance levels & my take profits. Until the market reveals its trend duration, I anticipate chop between my support and resistance. But ultimately, these targets represent my ideal entries and exit.
May the trends be with you.
LINK CORRECTION COIMING?? We don't want to hear it, but could it be possible?
COINBASE:LINKUSD
LINK our favourite has made an automatic rally up to the 78.6 fib and is now correcting.
Do you think it is over and we go deeper or we are climbing higher?
Write your comment!

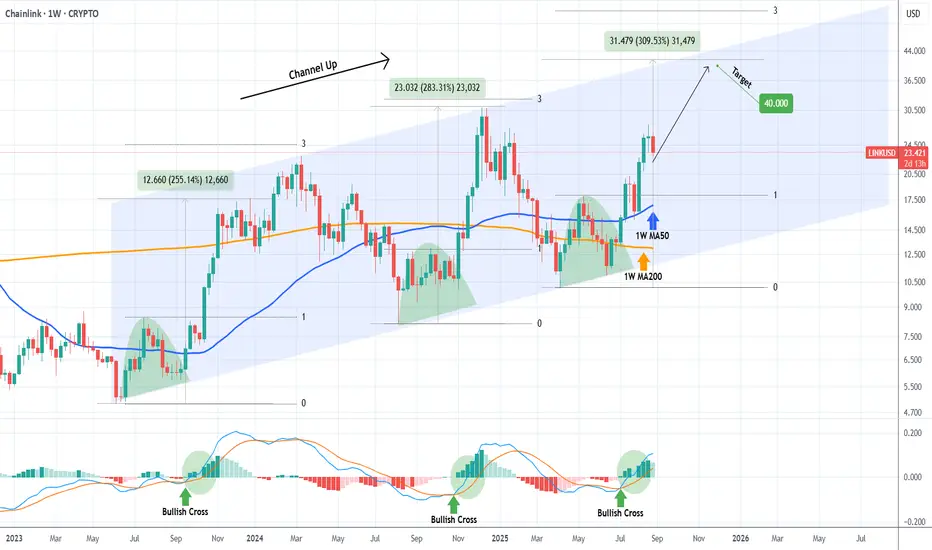
LINKUSD rally far from over, targeting $40 at least.Chainlink (LINKUSD) has been trading within a Channel Up since the June 05 2023 Low and in the past 4 months it has been unfolding the 3rd Bullish Leg of this pattern.
With the 1W MACD past a Bullish Cross (which has confirmed it), the previous Bullish Leg was about +30% stronger than the previous.
Assuming this holds for the current as well, we expect the rally to reach at least $40.00, which will be close to the pattern's top (Higher Highs trend-line) but still way below the 3.0 Fibonacci extension, a level the previous two Bullish Legs approached.
-------------------------------------------------------------------------------
** Please LIKE 👍, FOLLOW ✅, SHARE 🙌 and COMMENT ✍ if you enjoy this idea! Also share your ideas and charts in the comments section below! This is best way to keep it relevant, support us, keep the content here free and allow the idea to reach as many people as possible. **
-------------------------------------------------------------------------------
💸💸💸💸💸💸
👇 👇 👇 👇 👇 👇
$LINK Next Target $31Looks like I was right about my Chainlink call.
Go figure 🤓
CRYPTOCAP:LINK has closed the day above the 9EMA which is the first level you look to close above before the next leg up.
Notice it found support off the .618 Fib before the close.
$31 for the next target seems very likely, which was this cycle’s local high.

LINKEUR 2025/2030This is my targets :)
Chart Analysis:
There are very bullish signals and several buy signals on Chainlink's monthly chart. If the market follows the same path it did in the last cycle, these targets are conservative and very realistic.
Fundamental Analysis:
Chainlink is one of the most promising and innovative cryptocurrencies in the market today.
With its decentralized oracle technology, Chainlink is revolutionizing the way data is provided and used in smart contracts.
By 2030, Chainlink is likely to reach prices above $200, considering its growing adoption and the growing importance of decentralized oracles in the crypto ecosystem.
Furthermore, Chainlink is present in virtually every corner of the crypto ecosystem, providing secure and reliable data for smart contracts.
Chainlink has more developers working on its ecosystem than Ethereum in some specific aspects.
This is because Chainlink is the backbone of the crypto ecosystem, providing the true and reliable data needed for smart contracts to function properly.
Everyone needs true and reliable data, and Chainlink is the solution.
With its innovative technology and growing adoption, Chainlink is well-positioned to continue growing and developing in the coming years.
Be sure to do your own analysis and do not take this as financial advice; everyone is responsible for their own decisions.

TOTAL - total cap crypto "this looks bad," Not saying I've done trivial work in effort to determine the end of an Elliott wave phase peak; so, the chart looks like an Elliott wave does it not? The previously major halving did not have a similar chart where an Elliott wave 1,2,3,4,5 happened. This time it does look like that. Is it possible to have 6,7 phase inclusive to the chart albeit from the idea that Elliott wave means nothing to the new community of virtual currency digital money defi tropes meme derivative foreplay variable online meta landscape of the future? If I was betting on history repeating itself and the looks of the chart here for all cryptocurrency I would say this is not good looking for me, a guy who has made literally no money on cryptocurrency since the last halving despite trying so many times. The world is against me, the trends are fake, the people in society are all brainwashed by propaganda war machine rhetoric political asylums and the minority reports of mainstream majority peoples. Why now? Why not? I'm not looking forward to losing more money then I already have. I haven't made money. Online news doesn't help. Content creators don't help. My family does not help. These indicators which I feel I have a strong understanding of, do not help. Cryptocurrency is too volatile and unpredictable in ways that prevents mathematical decision making becoming profitable. The major players that control the phases of time are established based on the backs of working class people, and savings. We created a monster(s). Now those monsters are eating cryptocurrency for lunch. Cryptocurrency ≠ main course.

LINKI think LINKUSDT move up
in touch order block in 1H
yellow Line is risk free position (SL = Entry)

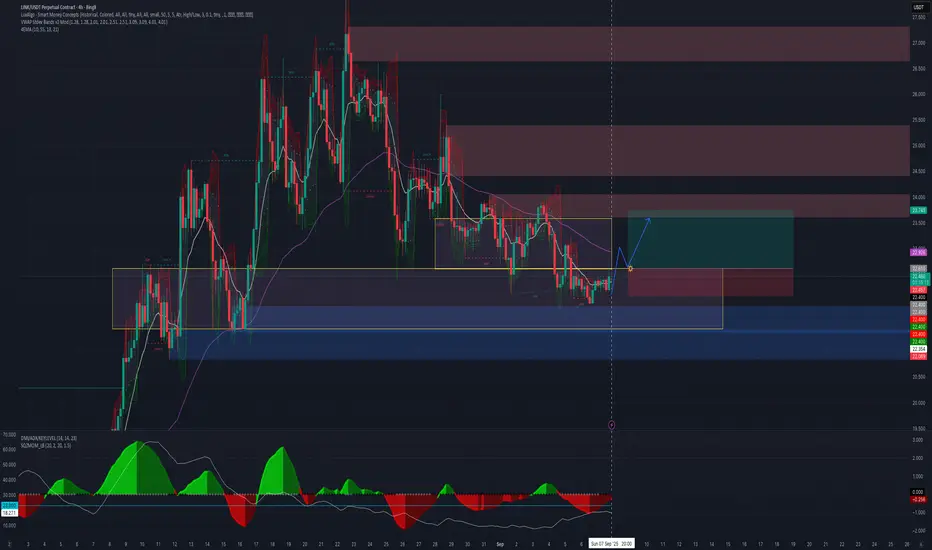
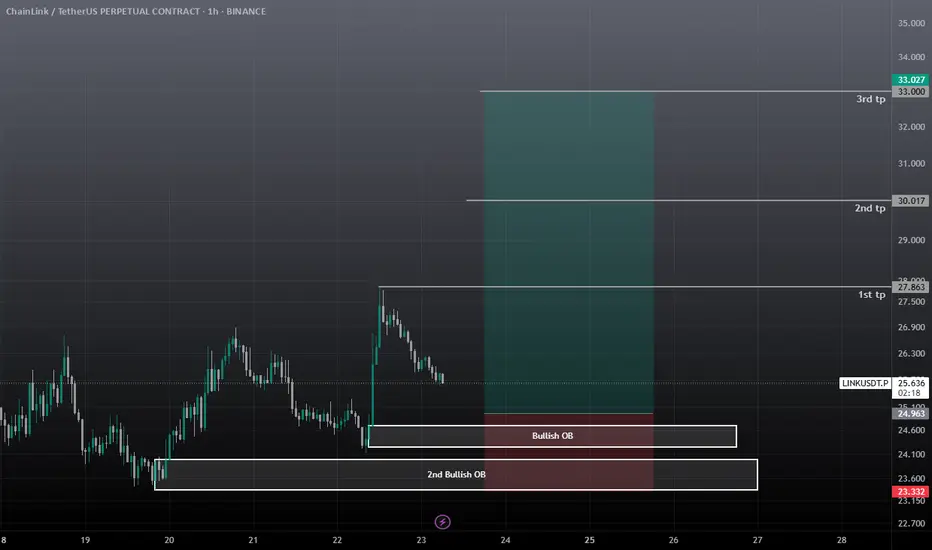
Link Long / Buy SetupLink has two Bullish OB, if first failed, 2nd OB will push the price, ETH bulish, link is also Bullish then. Use low risk as the pump was from an event so it can be a fakeout.
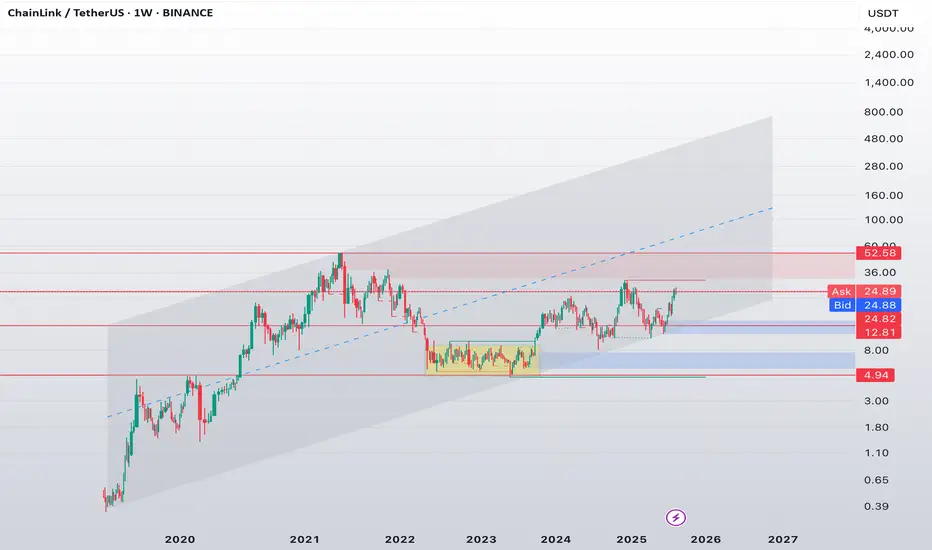
LINK Retesting Mid-Range Resistance Within a Healthy Uptrend📊 Chainlink ( BINANCE:LINKUSDT ) Retesting Mid-Range Resistance Within a Healthy Uptrend
On the weekly chart, CRYPTOCAP:LINK continues to maintain a clear higher low structure, currently retesting the critical resistance area around $25 — a level that historically capped upside in prior cycles.
🔍 Structural Highlights:
🔲The accumulation zone ($5–9) lasted over 500 days and ended with a breakout in late 2023
🔵 $12.80 held as a key higher low, validating the breakout structure
📈 Price is now approaching the $24–26 resistance — a historically significant supply zone that acted as a pivot point during 2021–2022
🧭 Scenarios I’m watching:
✅ Bullish case:
A confirmed breakout above $26 with weekly close ➝ opens the door toward $34–38 (next major supply block)
On macro strength, eventual extension toward $52 remains technically viable
❌ Bearish case:
Rejection at $25 ➝ pullback toward $18.50–$20 range for another higher low and continuation setup
🔬 Trend Dynamics:
Price is tracking inside a long-term ascending channel from the 2020 cycle
Current structure sits around the midline of the channel, which often acts as equilibrium or resistance in trend development
📌 My take:
CRYPTOCAP:LINK has completed its accumulation → expansion transition and is entering a more directional phase.
As long as we remain above $20, the macro structure stays bullish. But I’m not rushing into resistance at $25 — waiting for confirmation.
#LINK #Chainlink #CryptoAnalysis #TradingView #Altcoins #TechnicalOutlook #MacroStructure #MarketCycle
Chainlink vs Bitcoin (LINKBTC) · The Bear Market is OverRecently LINKBTC hit the lowest price since May 2019. This was the straw that broke the camels back, so to speak. Chainlink couldn't take it anymore and market conditions are starting to change. We are seeing a full breakdown of a long-term bearish structure, the end of the bearish cycle and downtrend.
Coincidentally, the same zone that worked as support now happened to be the zone that launched LINKBTC's 2019-2020 major bull market and bullish cycle. A cycle that produced total growth resulting in 16,912%. See the chart:
Here is a closer look at the weekly timeframe:
See how LINKBTC is trading above EMA55 and EMA89 recently, after the lowest prices in more than six years, making this a very strong bullish recovery signal.
A falling wedge pattern has been broken as well with its local downtrend line. If LINKBTC can stay above EMA89 we can expect extraordinary growth. Growth that will not last only a few days or weeks but growth that can last for years or in the least several months.
Look again at this chart. It doesn't say that an entire cycle has to unravel fast, emergency mode in a hurry in two months, no! It doesn't say so. The chart shows bottom prices, an early recovery and plenty of room available for long-term growth. Something similar to 2019-2020. A long-term bull market.
Namaste.

Chainlink LINK price analysis#LINK – Possible Breakout Setup?
🔹 Recent news indicates rising institutional interest in #Chainlink
🔹 The rally on OKX:LINKUSDT has been nearly correction-free
🔹 Next short-term targets: $28–31
🔹 Ideal pullback zone: $17–18, above the long-term blue trendline (since 2019)
🔹 If the trend holds, we could see a new impulse wave — possibly with ATH retest
🔍 What's your #LINKUSD target by end of 2025? 👇
______________
◆ Follow us ❤️ for daily crypto insights & updates!
🚀 Don’t miss out on important market moves
🧠 DYOR | This is not financial advice, just thinking out loud.
