Link ... the Great Falls !!!you can use any correction to sell the link as we might see 1.5 $ again
If you like my ideas don't forget to like it ... your support is appreciated
Linkchain

Chainlink is about to UNLOCK ( Huge Crypto in PLAY 7.0 Coming?)Hi friends, The printer is about to start printing on Chainlink as a Crypto in play.
I want to say thank you to all those who have been liking my ideas, I really appreciate the love so far, I have come with another good crypto in play but in return I will ask for your likes to keep growing my ministry.
without much stories, here is the pattern discovered and my trade set up.
PATTERNS DISCOVERED
1, Bullish pennant
Pennants are good continuation pattern, the patterns are characterized by a clear direction of price trend, followed by a consolidation or sideways movement or rangebound movement, which is then followed by a resumption of the trend.
2, Cup and Handle
Cup and handle is also a good continuation pattern, that usually forms in bullish markets.
Here is my trade setup
Enter: a "long" trade above the top of the cup level at 4.200
Stop loss : place a "stop" order below the handle at 3.7343
Targets: target 62% to 100% of the cup depth 7.3
Take profit points:
4.9760
5.4938
7.3171.
Thank you for liking this post idea and for following my work.

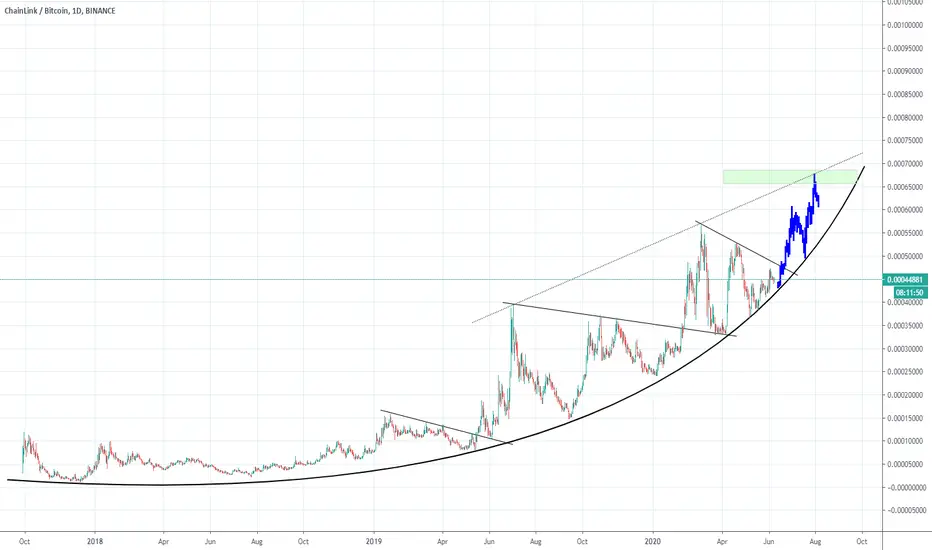
LINK/BTC (ChainLink) Next 88% Ride what you say...?LINK/BTC ChainLink TA Update:
My First @chainlink Chart looking Very Bullish.
Strongly Bounce back from Support level at 36800 Satoshi.
Every Time Pumped upto 100%+ when Hit this Support.
What we can expect this time.
I personally Expect Minimum 50% from Here.
but I am bought small amount and watching and If dip come Buy more.
Support: 36800 Sat
Resistance: 68308 Sat
Please like and follow me for latest crypto updates.
and
Dont forget to Click LIKE button.
thank you


LINK ShortShort potential
Has been testing this trend line shown by the Fibonacci spiral for a few times now, looks a bit shaky.
Short on trendline break.
Target is Fibonacci spiral.
Transition between fib levels may influence volatility.


LINK greatest investment in crypto?How often in recent times you hear this thesis?
I see some divergence between BTC price(blue line) and LINK. When bitcoin falling every shitcoin are following. So this levels are good for shorting and December 2019 at least is good target(IMO)

Taking a look at LINKLINK can be seen to have possibly formed a head and shoulders pattern on the XBT pair
LINK can be seen to be near a fib circle level, which may cause some volatility
A combination of the Fibonacci resistance and head and shoulders yields a bearish outcome

LINK is in ACCUMULATION ZONE - BULLISH Signal on chartMartyBoots here - Watch LINK very closely
LINK is in ACCUMULATION ZONE

LINK can Explode 100%Marty Boots here - Nothing to say except dont sleep on LINK
WE are in a bull mareket

#Chainlink | Continue To Climb MoreThis is just an idea, not a recommendation
Please share your opinion in the comments box and do not forget to press the like button
Add to watchlist

#LINK inverse H&S pattern#LINK is forming an inverse H&S pattern. Neck line is 31900, enter after one's breakout. Target on the chart - 35880.

Chainlink $LINK - Keep your Eyes open. Personally, I would prefer a move to $2.4-$2.34 before we move higher again, but we'll see.
The move to $2.34 happened with bullish divergence.
It's time... Are you ready?
I've placed a stop at $2.24. Reaching that level would impy that we can see bearish continuation.
Keep your eyes open!
$LINK #CRYPTO #Chainlink


LINKBTC at regression support levelWill LINK continue its long bull run? or is the beginning of a trend reversal. 0.84 regression uptrend, likely upsides.

Today`s ALT!!! LINKBTCBINANCE:LINKBTC
Exchange : Binance
Coin: LINKBTC
Buy Zone: 0.00029~0.00028
Target Point: 0.0002988/ 0.00031/ 0.0003275/ 0.00035/ 0.000388/ 0.000475/ OVER
S/L: 0.00027
Risk: HIGH
Term: Long
You should be careful in buying LINKBTC because of Bitcoin
It`s making Big Cup Handle of Cup again
It tried to break NeckLine of Cup and Cup Handle once time
But it failed to break Neckline because of Bitcoin
Inspite of Bitcoin`s movement, The Dumping stopped at Fivonacci 618
If Retracement will stop this area, it`ll previous high price and go to MOON !!
=====================================================================
Today`s ALT is that information is raised regardless of the Coin market situation
So sometimes there`s a high risk trading
Investment is your responsibility.
I'm just providing about coin`s information
=====================================================================

ChainLink : The indicators are greenSince few weeks our indicators are green on ChainLink.
ChainLink communicates little on its road map but we see a slow and massive adoption that allows this cryptocurrency to achieve annual performance that far exceeds all others.
In these conditions we can pretend to see this cryptocurrency reach 4 dollars in a few weeks (early December).
If a new partnership with a known structure comes by EOY then, ChainLink can well exceed 10 or even 15 dollars in that same timing. Because each announcement (in particular with Google & Oracle) allowed Link to increase its value (price & marketcap).
We could quite consider ChainLink in the top 10, maybe top 8.
The future will tell us, be careful.

link - distribution stagebuy now? ask yourself what are the prospects?
I consider risk more
if he grows up without me, I won’t be upset
usually such triangles fall
false breakdowns in 70% of cases


LINK bullish Continuation ?LINK price action above EMA 21,50,100,200 periods strong uptrend. Above Support trend line. Bullish Continuation up to 3$ strong resistance area.
LINK was farmed new bullish wave from 2.278$.
Volume: Confirm bullish price action.
Indicators: MACD bullish crossover above zero line. RSI above 75 points, overbought level. Bullish sign.
Pattern: Exponential growth up to 2.95$ after ABC correction to 2.1820$.
S/R: Support 2.275$. Major support 2.18$, Resistance 2.788$ psychology, Major Resistance 2.95$.
Disclaimer: THIS IS NOT FINANCIAL ADVICE. All the information shared here is for learning and entertainment purposes only.

LINK/USDT finished ABC correction LINK price action bellow 2.3$. Break EMA 21 and 50 periods. LINK achieved 2.2$ price level. LINK potential finished ABC correction. Still Hold above EMA 100,200 and green support trend line. Still don't break uptrend.
Potential rebound up to 2.52$ price level.
Volume increased and confirm bearish price action.
Indicators: MACD going to bullish crossover bellow zero line. RSI bellow 25 points oversold level. Bearish sign.
Pattern: ABC correction
S/R: Support psychology 2$. Major support 1.88$, Resistance 2.5$ psychology, Major Resistance 2.95$.
Disclaimer: THIS IS NOT FINANCIAL ADVICE. All the information shared here is for learning and entertainment purposes only.

LINK ABC correction LINK price action above 2.5$. Break down EMA 21 periods and was started ABC correction first wave rejection to 2.465$ second B rebound up to 2.788$ and finally C slowly grid down potential to 2.2$.
Pirce action above EMA 50,100,200 still uptrend. Potential retest green support trend line.
Indicators: MACD bearish crossover bellow zero line. RSI bellow 50 points. Bearish sign.
Bearish Volume decreased dont confirm bearish trend reversal, potential only corrention. Bearish volume smaller than bullish volume.
Pattern: ABC correction
S/R: Support at 2.465, Major at 2.2$, Resistance Major at 2.95$, Resistance 2.8$.
Disclaimer: THIS IS NOT FINANCIAL ADVICE. All the information shared here is for learning and entertainment purposes only.
