LINK/USDT — Descending Trendline Test: Break or Rejection?LINK/USDT on the 12H timeframe is still moving within a medium-term bearish structure, but price is currently testing a major descending trendline resistance that has capped upside movement since the previous highs. This places LINK in a critical decision zone.
---
📐 Pattern & Price Structure
Primary Pattern: Descending Trendline (Bearish Structure)
Price has been forming consistent lower highs and lower lows.
Price is now approaching a dynamic resistance (yellow trendline), which has:
Acted as strong resistance for months
Become a key validation level for either continuation or reversal
Additionally, price is consolidating in a tight accumulation range below the trendline, often a precursor to a strong breakout or breakdown.
---
🧱 Key Levels
Resistance:
13.55 – 14.70 → Minor resistance / supply zone
16.50 → Next structural resistance
18.50 – 19.90 → Extended bullish targets after a confirmed breakout
23.40 → Major resistance / previous distribution area
Support:
12.40 – 12.00 → Nearest support & demand zone
11.70 → Critical support (bullish invalidation)
11.10 → Extreme support / last defense
---
🟢 Bullish Scenario
Price breaks and closes decisively above the descending trendline on the 12H timeframe.
Ideal confirmation includes:
Strong candle body
Trendline retest holding as support
Potential upside targets:
14.70 → 16.50
Extension toward 18.50 – 19.90
A valid breakout would:
End the lower-high structure
Signal a medium-term trend reversal or bullish continuation
---
🔴 Bearish Scenario
Price fails to break the trendline and prints a clear rejection (long upper wick / bearish engulfing).
A breakdown below the current range opens downside potential toward:
12.00 retest
Extension to 11.70 – 11.10
As long as price remains below the descending trendline, the primary bias stays bearish / corrective.
---
🧠 Conclusion
LINK/USDT is trading at one of the most important technical zones in recent months.
Price reaction at the descending trendline will define the next major move:
Breakout → structure shift & bullish opportunity
Rejection → continuation of the downtrend
Patience and confirmation are key to avoiding false breakouts in this area.
---
#LINK #LINKUSDT #Chainlink #CryptoAnalysis #TechnicalAnalysis #Altcoins #Downtrend #Trendline #Breakout #CryptoTrading
LINKUSDC

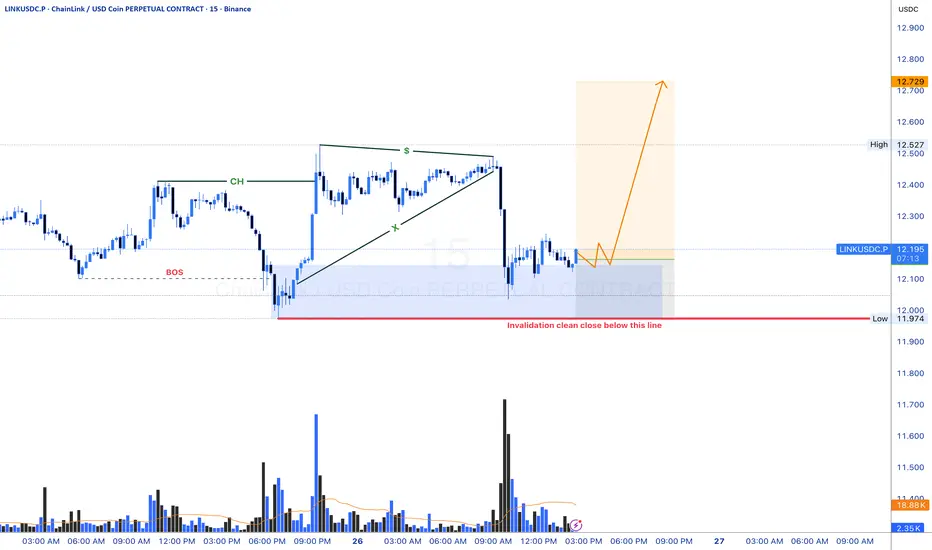
Link USD LONG IDEA. (BULLISH ORDER FLOW)Market Structure Context
Overall structure remains bullish (higher highs & higher lows).
Recent downside move is corrective, not impulsive.
No bearish break of structure on the higher timeframe → trend intact.
Key Zones (Institutional Interest)
Bullish Order Block at the origin of the last impulsive up-move.
⚠️ Disclaimer
This setup assumes normal market conditions.
Avoid trading during major news releases.
LINK/USDT — Historical Block: Bull Revival or Demand Breakdown?LINK is now approaching the most critical level of its multi-year market structure. The price has returned to the exact same demand block that triggered the major bullish expansion in previous cycles. This isn’t just support — it’s a historical liquidity zone where smart money repeatedly positioned itself before every significant rally.
And once again, the market is testing this area.
---
**✨ Market Narrative:
“Back to Where the Trend Began”**
From 2023 to 2025, every approach to the $10–$8.8 zone resulted in heavy absorption, long wicks, and strong reversals. This proves that this area acts as a primary liquidity pool for institutional accumulation.
This current revisit could become:
A bullish revival into a new multi-month uptrend,
or
A full breakdown into deeper distribution if the zone fails.
Simply put:
👉 This is LINK’s “make or break” level.
---
📈 Bullish Scenario — “Demand Awakening”
The bullish thesis activates if price:
Holds above $10–$8.8,
Forms a new higher low,
And closes strongly above $13–$14 on the 4D timeframe.
Signs of accumulation:
Long downside wicks inside the block
Increasing volume after compression
Higher timeframe candle reclaiming previous breakdown points
If confirmed, upside targets unfold naturally:
🎯 Target 1: $15–$17
🎯 Target 2: $21–$26
🎯 Target 3: Retest of the 2024 macro highs (expansion phase)
A reclaim of $17 would signal that the macro bullish trend is re-establishing itself.
---
📉 Bearish Scenario — “Demand Collapse”
The bearish thesis confirms ONLY when price:
Prints a decisive 4D close below $8.8,
Followed by continuation (not just a liquidity wick).
If the demand block breaks, the market shifts from accumulation to full distribution.
Downside targets become likely:
🎯 Target 1: $6–$5
🎯 Target 2: $4.7 (historical low & liquidity magnet)
🎯 Target 3: Full macro range retracement
This breakdown would represent a structural trend shift on the higher timeframe.
---
📊 Pattern & Market Structure Breakdown
Historical Demand Revisit: Price has returned to the core area that defined the previous rally.
Liquidity Grab Evidence: Deep wicks below the block — classic stop hunts before accumulation.
Macro Range Structure: LINK remains inside a multi-year range, hovering at its lower boundary.
Trend Context: Lower highs formed in 2025, and now price is searching for macro direction.
This isn’t ordinary price action —
this is where accumulation and distribution collide.
#LINK #Chainlink #Crypto #Altcoins #TechnicalAnalysis #DemandZone #PriceAction #MarketStructure #SmartMoney #CryptoAnalysis #SupportResistance

LINKUSD - ChainLink | Biggest Oracle In CryptoHi,
Chainlink is the biggest blockchain platform that bridges blockchain-based smart contracts and real-time external data.
This is not a trading advice.
Thanks
Gex

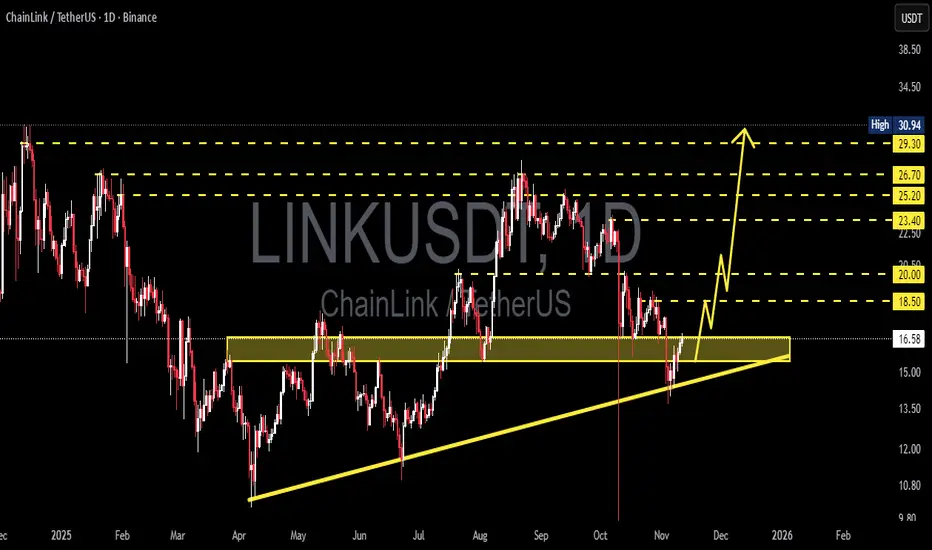
LINK/USDT - Ready to Explode? Uptrend Structure Tested?Chainlink (LINK) is now positioned at the most crucial zone in its mid-term technical structure — the 16.6–15.5 USDT area is not just a simple support, but a confluence zone between horizontal support and an ascending trendline that has been holding since April 2025.
Currently, price is reacting positively within this area, indicating that market participants are still defending the broader uptrend structure. However, if this zone fails to hold, the structure may collapse — paving the way for a deeper correction.
---
Pattern & Market Structure
Ascending Trendline Support: formed since April and still holding selling pressure.
Yellow Demand Zone (16.6–15.5): a strong accumulation area, tested multiple times this year.
Range-to-Trend Formation: price attempting to break out from sideways range into trend continuation.
Layered Resistances Above: 18.5 → 20.0 → 23.4 → 25.2 → 26.7 → 29.3 acting as step-by-step upside targets if the trend continues.
---
Bullish Scenario — Potential Reversal from a Strong Base
If price manages to hold and bounce strongly from the 16.6–15.5 zone, it opens the door for forming a new higher low that could become the foundation for the next rally.
Bullish confirmation: Daily close above 16.6 with reversal candle (hammer/bullish engulfing) and increasing volume.
Step-by-step upside targets:
18.5 → first psychological resistance.
20.0 → prior supply reaction area.
23.4–25.2 → potential breakout continuation zone.
Extended target: If momentum sustains, the ultimate target sits around 29.3–30.9, the yearly high.
Strategy:
Gradual buy within support zone with disciplined stop loss below 15.0. Additional confirmation entry if daily close >18.5.
---
Bearish Scenario — Breakdown as the Start of a Deeper Correction
However, if price breaks below 15.5 with strong volume, the bullish structure will be invalidated.
Bearish confirmation: Daily close below both trendline and 15.5.
Downside targets:
13.0 → previous horizontal support from May.
10.8 → macro base from 2024.
Additional signals: RSI breakdown, or failed retest below 16.6 after the break.
Strategy:
Wait for a failed retest around 15.5–16.0 for a short/hedge setup targeting 13.0.
---
Technical Perspective
The market is currently in a strategic neutral zone — between a potential major reversal and a confirmed breakdown. This is a decision phase, where volume and daily candle patterns will dictate the next dominant direction.
From a mid-term perspective, holding the ascending trendline means maintaining the macro uptrend structure, which could drive LINK back toward the 25–30 USD region. Conversely, losing this support may shift the structure into a new downtrend toward the long-term accumulation area below 13 USD.
---
Final Note
The 16.6–15.5 zone is more than just a number — it’s the psychological boundary between conviction and doubt.
Short-term traders look for a bounce, while long-term investors await directional confirmation.
Watch the daily close, volume, and trendline reaction closely. This is where the market decides: rebound toward 20+ or fall back to 13.
---
#Chainlink #LINKUSDT #CryptoAnalysis #TechnicalAnalysis #SupportAndResistance #Trendline #CryptoSetup #PriceAction #CryptoMarket
LINK/USDT — The Final Defense Zone: Will the Bulls Rise Again?Chainlink (LINK) has entered its final defense zone around $15.00–$17.00, a historically strong structural support area.
This zone isn’t just random — it’s the same level where the market once launched a major rally that drove LINK to $27.87.
The most recent daily candle shows a deep wick below the zone that was quickly reclaimed — a classic sign of a liquidity grab or false breakdown, hinting that the market might be accumulating before its next significant move.
Overall, the structure suggests a major retest phase: after a powerful breakout earlier this year, LINK is now retesting the origin of that move.
The key question — is this the start of re-accumulation before another leg higher, or the beginning of a market structure breakdown toward deeper lows?
---
Structure & Pattern
Yellow Zone ($15–$17) → Historical demand zone, validated by multiple previous bounces (marked by yellow arrows).
Macro Pattern → Retest of breakout zone, with the latest candle showing sweep and reclaim behavior.
Momentum → Sharp correction, but with a long lower wick and potential momentum divergence — a sign that the correction phase might be near its end.
Technical Context → Holding above this zone may form a double bottom or higher-low structure, indicating bullish strength recovery.
---
Bullish Scenario (Reversal Setup)
A daily close above $17 would confirm that buyers are defending the structure.
A sustained move above $19.99 could unlock upside targets at $21.69 → $23.30 → $25.12 → $26.82.
A strong rejection from the lower zone, combined with rising volume, may signal institutional accumulation in progress.
Market Narrative:
Bulls might be quietly preparing for Phase 2 of the rally after a classic shakeout.
As long as the $15–$17 zone holds, LINK retains the potential to resume its mid-term uptrend.
---
Bearish Scenario (Continuation Breakdown)
A daily close below $15 would signal structural failure and a loss of bullish control.
This could trigger a continuation drop toward $13.5 → $12.0 → $9.8.
A failed retest from below the zone ($16–$17 rejection) would further confirm bearish momentum.
Market Narrative:
If this support collapses, LINK may enter a distribution phase, where selling pressure strengthens and momentum fully flips bearish.
---
Conclusion & Perspective
The $15–$17 zone is the line between survival and surrender for LINK’s bullish structure.
As long as this level holds, the potential for a bullish reversal remains alive.
But once broken, the mid-term trend could shift decisively to bearish.
We are standing at a Decision Zone — the kind of area where institutions quietly position themselves and patient traders wait for confirmation before taking action.
---
LINK returns to its final defense zone at $15–$17 — the area separating a major reversal from a new downtrend.
The long wick signals a liquidity sweep, but confirmation awaits the next daily close.
Bulls are being tested — will they hold the line, or give in to market pressure?
Levels to watch:
Support: $15–$17
Resistance: $19.99 → $21.69 → $23.30 → $25.12 → $26.82 → $27.87
---
#LINK #Chainlink #LINKUSDT #CryptoAnalysis #TechnicalAnalysi #SupportAndResistance #CryptoMarket #PriceAction #Altcoins #MarketStructure #CryptoSetup #LINKPrice

LINK/USDT — Golden Zone Will Decide the Next Move!?Current Price: ~23.47 USDT
Chainlink (LINK) has just completed a strong rally from the yearly low at 10.10 to the peak of 30.94. Now, the price is consolidating and retesting the Fibonacci Golden Pocket — a critical area that will decide whether the uptrend continues or a deeper pullback occurs.
---
🔎 Market Structure Analysis
Primary Trend: Strong bullish reversal since June 2025, with higher highs and higher lows forming.
Current Condition: Price is pulling back from the recent top (30.94) and consolidating around 23–25, right above the Golden Pocket (21.18–19.86).
Key Demand Zone: The yellow area (19.8–21.2), previously a strong resistance, is now acting as support (supply → demand flip). Holding this zone is crucial for the next big move.
---
🟢 Bullish Scenario
If LINK holds above 21.18–19.86, the current move is likely just a healthy retracement before continuation.
Confirmation: Daily close above 25.24–26.65 with rising volume.
Upside Targets:
🎯 Target 1: 25.24 (minor resistance)
🎯 Target 2: 26.65 (key breakout level)
🎯 Target 3: 29.20
🎯 Target 4: 30.8–31.0 (previous high)
Breaking above 30.8 could open the door for new highs in the coming months.
---
🔴 Bearish Scenario
If price fails to defend the 19.86–21.18 zone, a deeper correction may unfold.
Confirmation: Daily close below 19.8 with strong selling volume.
Downside Targets:
⚠️ Target 1: 15.63 (Fib 0.5)
⚠️ Target 2: 14.69 (Fib 0.618)
⚠️ Extreme Target: 10.10 (yearly low in case of panic sell).
---
📌 Key Technical Patterns
Bullish Flag / Consolidation: Current price action resembles a bull-flag formation after a strong impulse.
Supply-Demand Flip: The yellow zone (19.8–21.2) flipped from resistance into support — a decisive area for market structure.
Golden Pocket Fib: 0.5–0.618 retracements are historically strong levels for trend continuation.
---
🧠 Conclusion & Strategy
LINK is currently at a make-or-break golden zone.
Bullish Case: Holding above 19.8–21.2 keeps the bullish structure intact → targets at 26.6, 29.2, and 31.
Bearish Case: A breakdown below 19.8 opens risk for a correction toward 14–15 or even back to 10.1.
Trading Plan:
Accumulate near 21–23 if signs of bounce appear.
Breakout entry above 26.65 for swing targets at 29–31.
Place stop-loss below 19.8 to protect long setups.
Take partial profits at each resistance level.
---
📌 LINK is standing at a critical decision zone. Will buyers defend this golden pocket to fuel another leg up toward 30+? Or will sellers drag the price back to 15 and below?
#LINK #LINKUSDT #Chainlink #CryptoAnalysis #Altcoins #SwingTrading #TechnicalAnalysis #CryptoTA #Fibonacci #PriceAction

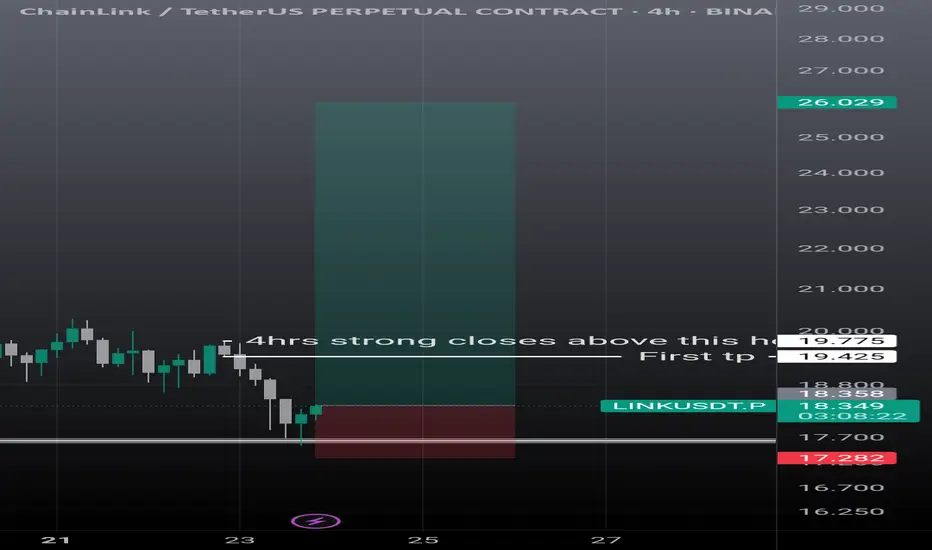
Linkusdt scalp n swing setupLink showing some strong momentum. On 4hrs it can go easily 19.30, then if it breaks strong and closes above the mentioned candle it's next stop is 26$. Must use sl as it can take further correction is it failed to break the mentioned level.
Taking a look at LINK.This chart looks very interesting and contains many little tidbits of information about potential future outcomes. I see good things coming for LINK in the future.
Good luck, and always use a stop-loss!

My current LINK charts with estimated April 'flash crash' levelsHere is my current LINK chart, which I recently went over in detail. It assumes that the bottom isn't in on the 4th wave. If the bottom is in and price is moving into the 5th wave, you can simply adjust the 4th wave bottom to the previous low accordingly.
It also includes the likely level that would be hit during the April "flash crash" around the pattern’s 3rd support level line and FVG (fair value gap), as well as the likely areas above that it will need to break through in order to reach new all-time high territory—assuming that's even possible in this cycle.
Keep in mind that the "flash crash in April" is a theory of mine and may or may not come to fruition, or could be off in timing. And while these levels may be likely, they may not actually be the levels that get hit, even if the thesis itself is correct.
Good luck, and always use a stop loss!

LINK Ready for PUMP or what ?Do you think this will happen, or do you see LINK below $10 in the future?
Give me some energy !!
✨We spend hours finding potential opportunities and writing useful ideas, we would be happy if you support us.
Best regards CobraVanguard.💚
_ _ _ _ __ _ _ _ _ _ _ _ _ _ _ _ _ _ _ _ _ _ _ _ _ _ _ _ _ _ _ _
✅Thank you, and for more ideas, hit ❤️Like❤️ and 🌟Follow🌟!
⚠️Things can change...
The markets are always changing and even with all these signals, the market changes tend to be strong and fast!!

LINK/USD "Chainlink vs US Dollar" Crypto Market Heist Plan🌟Hi! Hola! Ola! Bonjour! Hallo!🌟
Dear Money Makers & Robbers, 🤑💰🐱👤
Based on 🔥Thief Trading style technical and fundamental analysis🔥, here is our master plan to heist the LINK/USD "Chainlink vs US Dollar" Crypto market. Please adhere to the strategy I've outlined in the chart, which emphasizes long entry and short entry. 🏆💸Be wealthy and safe trade.💪🏆🎉
Entry 📈 :
"The loot's within reach! Wait for the breakout, then grab your share - whether you're a Bullish thief or a Bearish bandit!"
Buy entry - above 20.000 in Pullback
Sell Entry - can take in any price level
Stop Loss 🛑:
Thief SL placed at 18.000 (swing Trade Basis) for Bullish Trade
Thief SL placed at 20.000 (swing Trade Basis) for Bearish Trade
📌SL is based on your risk of the trade, lot size and how many multiple orders you have to take.
Target 🎯:
-Bullish Thieves TP 28.000 (or) Escape Before the Target
-Bearish Bandit TP 14.000 (or) Escape Before the Target
📰🗞️Fundamental, Macro, COT, Sentimental Outlook:
LINK/USD "Chainlink vs US Dollar" Crypto market is currently experiencing a Bearish trend in short term period (but there is a higher chance for Bullish)., driven by several key factors.
🔱 Fundamental Analysis:
The fundamentals of Chainlink (LINK) are strong, with a growing ecosystem and increasing adoption of its oracle services. This has led to an increase in demand for the token, which could drive up prices in the long term.
🔱 Macro Economics Analysis:
The current macroeconomic environment is favorable for cryptocurrencies, with low interest rates and high inflation. This could lead to an increase in demand for cryptocurrencies like LINK, driving up prices.
🔱 COT Report Analysis:
Unfortunately, I couldn't find the latest COT report for LINK/USD. However, based on historical data, commercial traders have been increasing their long positions in LINK, indicating a bullish sentiment.
🔱 Sentimental Analysis:
The market sentiment for LINK/USD is currently bullish, with 70% of investors expecting the price to increase in the next week. Social media sentiment is also bullish, with 65% of tweets and posts expressing a positive sentiment towards Chainlink.
🔱 Fear and Greed Index:
The fear and greed index for LINK/USD is currently at 60, indicating a greedy sentiment. This suggests that investors are optimistic about the future price of LINK.
🔱 Overall Outlook:
Based on the analysis, the overall outlook for LINK/USD is bullish, with a potential price increase of 10% in the next week. However, the market is subject to volatility, and investors should exercise caution when making investment decisions.
🔱 Positioning:
Institutional investors are increasing their long positions in LINK, indicating a bullish sentiment. Retail traders are also optimistic about LINK, with 75% expecting the price to increase in the next week.
🔱 Upcoming Future:
The future outlook for LINK/USD is bullish, with a potential price increase of 20% in the next month. The growing adoption of Chainlink's oracle services and the increasing demand for cryptocurrencies could drive up prices in the long term.
⚠️Trading Alert : News Releases and Position Management 📰 🗞️ 🚫🚏
As a reminder, news releases can have a significant impact on market prices and volatility. To minimize potential losses and protect your running positions,
we recommend the following:
Avoid taking new trades during news releases
Use trailing stop-loss orders to protect your running positions and lock in profits
📌Please note that this is a general analysis and not personalized investment advice. It's essential to consider your own risk tolerance and market analysis before making any investment decisions.
📌Keep in mind that these factors can change rapidly, and it's essential to stay up-to-date with market developments and adjust your analysis accordingly.
💖Supporting our robbery plan will enable us to effortlessly make and steal money 💰💵 Tell your friends, Colleagues and family to follow, like, and share. Boost the strength of our robbery team. Every day in this market make money with ease by using the Thief Trading Style.🏆💪🤝❤️🎉🚀
I'll see you soon with another heist plan, so stay tuned 🤑🐱👤🤗🤩

LINKUSDT, Did you took this amazing position ??Hello everybody
Did you bought ?? or took long position ??
According to the chart and last analysis that we publish we shown on chart that the price made 2 triangle and this become more powerful that the price wanna have some rises price to the resistance zone level and exactly this scenario was happend and now we are in the way to reach to the target that we update and shown on chart .
Dont forget observe capital manaegement and use stop loss.
Previous analysis :
If you have any question or need any help , send us messages
Good Luck
Abtin

(CHAINLINK) The market dunce with enormous potential.. Hello everyone !
Today H₿ Capital is analyzing LINK based on a « 2 Weeks » chart 📈
What we can see :
LINK has been one of the worst player during the last 12 months regarding its performance….. Worse than some Stock assets too… Very very disappointing for Hodlers (like me). By the way, LINK is one of the strongest fundamentals token in the market right now.
You cannot ignore the following : CCIP + Staking to be released this year + Eric Shmidt who joined the Chainlink foundation as an Advisor (ex CEO of Google 2001-2011).
Technically:
- LINK is progressing into a descending triangle (trend continuation pattern)
- It seems that we are actually in a « flat » ABC correction (to be confirmed soon with the 2 weeks candle ended this week , which could print on the chart a nice double bottom figure)
- Our white trend line act as a support for prices and this one must hold…
What we can expect :
- If prices failed to hold the white trend line + break the triangle support line (where prices are right now) we can expect Link to reach the 8$ area……..
- If prices manage to hold our white trend line + break the triangle with conviction, we can expect the following :
Triangle Breakout :
Target 1 = Distance between the mouth of the triangle added to te breakout
Target 2 = 100% extension of the first impulse move
Triangle Pullback :
Target 1 = Distance between the mouth of the triangle added to the pullback
Target 2 = 100% extension of the first impulse move
Trend-based Fib extension :
1.618 = 86$
2.618 = 131$
3.618 = 176$
IF YOU LIKE THIS POST, FEEL FREE TO LEAVE A LIKE AND FOLLOW ⭐ H₿ CAPITAL ⭐
MAY THE CRYPTO BE WITH YOU GUYS (D.Y.O.R)

LINK🔗 triangle breakoutIt's has been long time since I posted last Chainlink idea... 👇
But now here comes another one >> LINK 🔗 is holding well even in this weak market recently. Price seems to be ready to break up this triangle 📐 and If succesful I think there is chance for run to 30.9 and even higher. I'm already in, but one can set the BUY LIMIT order to catch the possible pullback. As usually we need BTC to stay stable (or even go up) to not spoil the party. Going with lower size as markets are shaky.
ENTRY : local high @ 26.37
STOPLOSS (TP) : local low @ 25.08
TARGET (TP) : height of the triangle projected from midpoint of the local range (BUY LIMIT - SL) @ 30.9
REWARD RISK RATIO (RRR) : 3.5
INVALIDATION : when SL level hit
Check my other stuff in related ideas.
Please like👍, comment🗣️, follow me✒️, enjoy📺!
⚠️Disclaimer: I'm not financial advisor. This is not a financial advice. Do your own due dilingence.

LINKUSDT , We should wait ...Good Evening guys
LINK is one of the most powerful project that is working on ...
(if you need any information fundamental about any coin you can send us messages in private)
According to the chart, the price after impacted to the resistance is fell down and now its in minor support zone area, if it cant support in here the price can drop more to reach lower PRZ level.
Previous analysis :
If you need any help or question , send us messages in private
Good Luck
Abtin

LINKUSD - road to 1000$. Livermore's speculative on log chartI just speculate Link road to 1000$.
Don't take me serious. This is a joke :)

Stinky Link to Break ATH?! $20 and beyond...!Link, one of the most highly regarded coins in the DeFi space is closing in on its ATH
$20 and a few cents is the ATH, on Binance
If BTC doesn't have a shake, then this should be broke soon, when I will update further targets
Expect a little pullback here due to the SR level from the previous run, then to push through
If it does, it might be the first 'well-known' coin to break it's own ATH after BTC broke that 20K level some weeks ago now

LINK in a viewChainlink is on an ascending trend. Based on this analysis it has the potential to reach $66

LINK/USD - If bounce here is going to 40$I expect Link to bounce above 10$ support, otherwise is going to 8$.
If we bounce here, I think is going to 40$.
Link fundamentals are very strong:
1. Top 100 wallets are accumulating
2. Staking is coming
3. DECO acquisition
4. Possible SWIFT announcement
5. The standard oracle network


LINK/USDT - Inverse Head and ShouldersFew reasons why I think this is bullish for Link:
- Today dump was on a huge volume.
- USDT dominance chart is forming Head and Shoulders on daily
