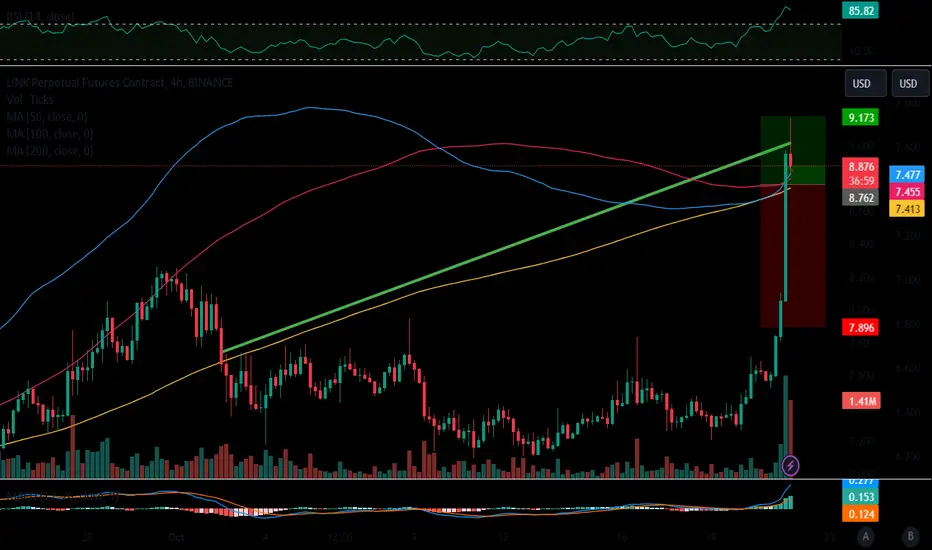
Celebrating LINK's Remarkable Breakthrough - Long LINK Our beloved LINK defied expectations and broke through its one-year trend with an incredible 13% jump! 🚀
Let's take a moment to appreciate the magnitude of this achievement. LINK has not only shattered the barriers of its previous trend but has also shown its potential for continued growth. This remarkable breakthrough is a testament to the strength and resilience of the LINK community and its long-term vision.
Now, you might be wondering, what does this mean for you as a trader? Well, my friends, it means that there's an incredible opportunity knocking at your door. The time has come to consider joining the long LINK movement and seize the potential for further gains.
Why long LINK, you ask? Here are a few compelling reasons:
1. Momentum: LINK's recent surge has demonstrated its ability to defy trends and propel itself to new heights. By long LINK, you can ride the wave of this positive momentum and potentially maximize your profits.
2. Strong Fundamentals: LINK's underlying technology and the team behind it have repeatedly proven their worth. With a solid foundation, LINK has the potential to continue its upward trajectory.
3. Diverse Use Cases: LINK's integration with smart contracts and decentralized finance (DeFi) applications has opened up a world of possibilities. As the demand for DeFi grows, LINK's value is poised to follow suit.
So, how can you get in on the action? It's simple! Take a moment to evaluate your trading strategy and consider adding a long position on LINK to your portfolio. Keep a close eye on market trends, set realistic targets, and remember to diversify your investments for a well-rounded approach.
Remember, trading is both an art and a science, and timing is everything. While the past performance of LINK is no guarantee of future results, it certainly provides us with an exciting opportunity to capitalize on its recent breakthrough.
As always, please conduct thorough research, consult trusted advisors, and make informed decisions aligning with your risk appetite and financial goals.
LINKUSDT

Chainlink closing outsideLINK 1day closing outside the resistance level 9.50 will be very bullish for LINK When this area has been negotiated its basically blue sky to 18 for LINK The rsi is very OB here so we will be expecting some volatility washout around here before moving on and upward

LINKUSDT LONG IDEALink is in its long-term trading range. Now after touching the trading range support ,it has shown engulfing ,it is likely to see the resistance of its trading range again.
entry1:market price
entry2:5.50
sl:5
tp1:8.16
tp2:8.78
tp3:9.57

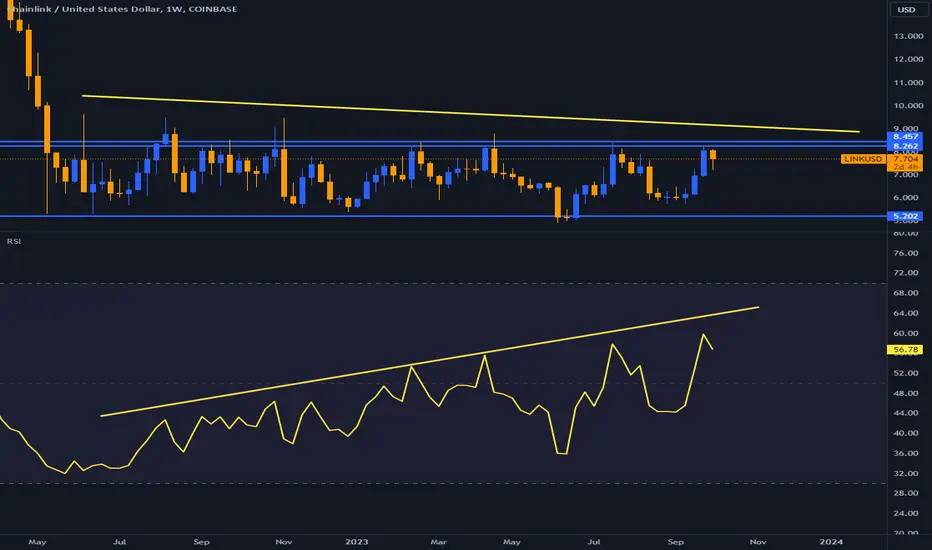
link updateChainlink is as always very strong... Depending op the movements of Bitcoin, I keep an eye at range high... 2 ways to go...
Keep in mind that 200MA is right above range high... So no fomo long there...

Link's Ongoing Struggle At $7.6 Hopes For A Breakout To $11(Link), one of the leading cryptocurrencies in the market, has been locked in a seemingly endless struggle to breach the 7.6 dollar price point for several months.
The cryptocurrency market is no stranger to volatility, but Link's stability at this particular price range has caught the attention of investors and analysts alike. In this article, we will explore the factors contributing to this prolonged struggle and examine the potential catalysts for a price breakout that could propel Link to $11.
Understanding the $7.6 Resistance
Link's performance in the cryptocurrency market has been impressive over the years. However, since , it has been unable to sustain a significant upward momentum beyond the $7.6 mark. To understand this resistance, it's essential to look at the various factors influencing Link's price.
Factors Contributing to the Prolonged Struggle
Market Sentiment: Market sentiment plays a vital role in determining the price movements of cryptocurrencies. Negative news, regulatory concerns, or general pessimism can create downward pressure on a cryptocurrency's price. Link has faced its share of setbacks and FUD (fear, uncertainty, doubt) in recent months, which has contributed to the struggle.
Resistance Levels: Technical analysis often highlights significant resistance levels that can act as barriers to price movement. The $7.6 level has been a formidable resistance point for Link, with traders and algorithms reacting to it.
Overall Market Conditions: Cryptocurrencies are also influenced by broader market conditions. A bearish market can make it challenging for any asset to rally, while a bullish market can provide tailwinds for significant gains.
The Potential Catalysts for a Breakout
Despite the challenges, there are several factors that could potentially drive a breakout for Link, with a price target of $11
Technical Analysis: A break above the $7.6 resistance level could trigger a surge in buying interest, pushing Link's price higher. Traders and algorithms often follow such breakout patterns.
Fundamentals: Chainlink's fundamentals remain strong, with its decentralized oracle network being widely used across various industries. Adoption of the technology can create sustained demand for the cryptocurrency.
Positive Developments: News and developments related to Chainlink's partnerships, integrations, and projects can significantly impact its price. Positive news can rejuvenate investor interest.
Chainlink's extended struggle at the $7.6 price point has frustrated many investors, but it's essential to understand the myriad of factors that have contributed to this situation. While breaking the resistance will not be easy, there are several potential catalysts that could pave the way for a significant breakout, with a price target of $11.
Investors should closely monitor the market sentiment, technical analysis, and the broader cryptocurrency landscape for signs of a potential turnaround. In the volatile world of cryptocurrencies, one thing is certain: surprises are always around the corner, and Link may yet surprise the market with a remarkable rally to $11.
As with all investments, it's crucial to exercise caution and conduct thorough research before making any decisions in the cryptocurrency market. check for plagiarism.
linkusdtAs expected, the link has started its upward movement, which we talked about earlier in the weekly time frame.
If the daily candle is closed in the same way, you can expect a pullback in the area of 8-8.5 dollars and the continuation of the upward trend towards the targets up to 11 dollars for the short term.
If the daily candle closes above 9.5 dollars, the possibility of a pullback in the area of 8.5 dollars will be weaker.

Link Head and ShouldersHey TW Fellows,
The rink might form a head and shoulders pattern for the short term. If this case is valid the possible target is around 10.7-11.3$ at the end of the year.
Cheers.

LINK/USDT 1DInterval Review ChartHello everyone, I invite you to review the LINK chart in pair with USDT, on a one-day time frame. First, we will use blue lines to mark the downward trend channel in which the price is moving upwards, while locally there is an upward trend line visible, along which the price is climbing. As we can see, it also managed to return to a strong upward trend after emerging higher from EMA Cross 200, which is important for the price to maintain this level now.
Going further, we can move on to marking support areas when the price returns to correction, and here we can see the support zone from $7.05 to $6.61, which also contains the previously mentioned 200 moving average, then we have the second zone from 6.17 $ to $5.53, followed by strong support at $4.74.
Looking the other way, we see that the price has bounced off the important resistance zone from $7.78 to $8.58, which it has no strength to break yet, there is still a strong resistance at $9.65, which the price must overcome and test positive before moving further upwards.
Please look at the CHOP index, which indicates that we have a lot of energy for the upcoming move, the RSI shows a return to the middle of the range, which creates room for a new upward move, while the STOCH indicator has rebounded to the lower limit and we have a visible upward movement with energy for it. I wish the price would go up a little higher.

Chainlink Roadmap ($200?)(Chart above Green Line - November 2024 , Red Line October 2025)
There are some amazing things happening right now on the Chainlink chart. It may seem like LINK is still in a boring range, but for me, it's quite the opposite. This move down to $5 was the best that could have happened for LINK.
We documented this entire move down to $5, and you can check it out below:
The bar pattern you see in front of you on the main chart above is taken from December 2018 to May 2021. Why so specific in December 2018? Well, if we zoom into the Daily timeframe, you can see a clear mirror pattern appearing. This move down to $5 confirmed to me that, in fact, Chainlink has been playing out a very similar fractal since its first and only bear market, starting from November 2022 (FTX crash).
This is an incredible find! Just look at it; it's undeniable!
The last wave from December 2018 looks pretty much the same as the one we had in June 2023; it even took the same time at the bottom and to pump back up to the range high.
The only major difference here is that in December 2018, this final wave set a higher low, but this year we set a lower low:
Now, let's talk about Fibonacci time sequences:
I forgot about this time count, in October 2022, I marked it as failed because we didn't get a reaction from it anymore, but I stumbled upon it in an old chart save, and wow, it did, in fact, mark the bottom of wave 5 and pivot up.
If Chainlink does repeat the last cycle, then this October 2023, Chainlink will have a massive run-up to an all-time high:
So, out of the last five Octobers since this chart started in 2017, Chainlink has finished the month positively every time except for the first:
Oct 2017 -55%
Oct 2019 +49%
Oct 2020 +28%
Oct 2021 +19%
Oct 2022 +2.75%
Keep in mind that this chart starts in September 2017, so this October we could see a big move up or the start of it. If Chainlink behaves like the last cycle, it rallies to all-time highs.
Remember that Chainlink broke all the high four times before Bitcoin finished its cycle top:
If Chainlink breaks the 3.618 Fibonacci level four times again, LINK would go over $1000:
I put this outcome as unlikely since it takes a lot more money to move this market cap to those numbers.
This TA assumes that Chainlink will follow more of the Bitcoin cycle, as that's what coins that run through the cycle once and significantly increase the market cap tend to do.
LINK/BTC
This time sequence started everything , put everything in motion for chainlink for me , since then its been right at predicting Chainlink events 100% of the time for years , the next date is April 2024 which happens to be the next Bitcoin halving, things are going to get really crazy around this time expect anything.

🔗Chainlink(LINK)🔗 will Go Up⏰(15_min)⏰🏃♂️ Chainlink(LINK) is moving in the 🟢 support zone($7.34-$7.13) 🟢.
🌊In terms of Elliot waves , Chainlink(LINK) has completed its 5 waves in the 15-minute time frame.
💡Also, the Regular Divergence(RD+) between two successive valleys is clearly visible.
🔔I expect the 🔗 Chainlink(LINK) 🔗 to move towards my 🎯 Target 🎯 after the downtrend line breaks.
Chainlink Analyze (LINKUSDT), 15-min time frame ⏰.
Do not forget to put Stop loss for your positions (For every position you want to open).
Please follow your strategy; this is just my Idea, and I will be glad to see your ideas in this post.
Please do not forget the ✅' like '✅ button 🙏😊 & Share it with your friends; thanks, and Trade safe.


Big resistance zone around $7.8Chart 4H TF
LINK has broken down trend line and recovering to $7.8 now
My bias is Long after price close and confirmed above $7.45
Wait for next move

Link short ideaHi everyone. As you see in chart link close to resistance area of parallel channel. Short position can give us good profit.
Entry : 6.347
Stop : 6.68
Target : 5.75

LINK ☀️ Upside In the Next 24 Hours; Bullish Forecast Cloudy ☁️, slightly bearish trading conditions will linger over the global crypto market in the next 24 hours. Sunnier ☀️ slightly bullish conditions will, however, prevail overChainlink Uniswap, and Cardano, according to ATTMO’s forecasts.
Over a one-week horizon, a mixed picture arises. The sun ☀️ will return and shine over Bitcoin, Litecoin, Cardano, and Uniswap. Other altcoins including Ether, XRP, and Binance face bearish clouds ☁️ and downside risks. Avalanche may even face stormy ⛈️ trading conditions, signaling the risk of a very bearish trend.
Follow us for more crypto weather reports!

🔗Chainlink(LINK)🔗will Go Down by Triangle⏰(1-Hour)⏰Hi, everyone👋.
🔗Today, I decided to analyze Chainlink(LINK) for you. I hope that it is useful to analyze.
📚 What Is Chainlink(LINK) ❗️❓
🔸Founded in 2017, Chainlink is a blockchain abstraction layer that enables universally connected smart contracts. Through a decentralized oracle network, Chainlink allows blockchains to securely interact with external data feeds, events, and payment methods, providing the critical off-chain information needed by complex smart contracts to become the dominant form of digital agreement.
🔸The Chainlink Network is driven by a large open-source community of data providers, node operators, smart contract developers, researchers, security auditors, and more. The company focuses on ensuring that decentralized participation is guaranteed for all node operators and users looking to contribute to the network.
🚩It seems that Chainlink(LINK) is creating a Contracting Triangle between two areas of 🟢Support🟢 and 🔴Resistance🔴 .
🔔I expect Chainlink(LINK) to move towards the 🟢 support zone($7.34-$7.13) 🟢 after breaking the lower line of the Contracting Triangle .
Chainlink Analyze (LINKUSDT), 1-hour time frame ⏰.
Do not forget to put Stop loss for your positions (For every position you want to open).
Please follow your strategy; this is just my Idea, and I will be glad to see your ideas in this post.
Please do not forget the ✅' like '✅ button 🙏😊 & Share it with your friends; thanks, and Trade safe.

Landing coming?The rise that took place was a triple correction, and we expect another strong decline to come soon, and all the data is shown on the chart.
Note: The analysis fails if the price closes above the $7.5 area
Please clarify that I am helping you with my point of view, which may be right or wrong, and see my previous analyzes of many currencies and forex in order to judge the owner of this analysis with a more accurate look
Good luck

"Chainlink's Decentralized Oracle Network**Chainlink's Bullish Surge Today: RSI, SMA, and EMA in Focus**
Chainlink (LINK) is making waves with a strong bullish trend today. The Relative Strength Index (RSI) for LINK indicates robust buying momentum, firmly above the 70 mark, signaling a potential for further gains. The Simple Moving Averages (SMA) reveal a golden cross, with the 50-day SMA crossing above the 200-day SMA, a classic bullish signal. Furthermore, the Exponential Moving Average (EMA) shows a consistent upward trajectory, emphasizing the sustained momentum. Chainlink's innovative decentralized oracle network, which plays a pivotal role in the DeFi ecosystem, coupled with strong technical indicators, positions LINK as a standout performer in the crypto market today.

Be carefulPlease, don't chill, don't to be too greedy.
Be careful with it.
There a big bearish hidden divergence in weekly.
CHAINLINK - 06/10/23LINK
It looks like #ChainLink wants to take out the $8.271 SUPPLY or at least tap it, could the cup and handle be about to play out?
This is going to depend on BTC breaking out the range it is stuck in.

LINKUSDTNice and easy short here! All the oscillators are in the red, and the price seems to be dropping. It's a good opportunity to take a calculated risk and enter a trade.

LINK/USDT SCALPHi.I hope you have good time.As you can see in the chart, I expect a decline to the range of 6.96. A Order Block on the price of 6.96 can cause an upward jump. Taking a short position at this price can be done by getting confirmation. If you like this analysis, please like and follow

Chainlink's Breakout Ballet?Unveiling a potential crescendo, Chainlink (LINK) pirouettes around a bullish narrative on the crypto stage this October 5, 2023. The meticulous choreography of a 'cup and handle' formation on the daily chart hints at a grand leap awaiting at $7.79. As LINK twirls at $7.732, marking a 4% ascent in the last 24 hours, the spotlight sharpens on the breakout threshold.
The market orchestra tunes to a bullish melody as the technical indicators harmonize with LINK's dance. The golden crossover between the 50 and 200-day Exponential Moving Averages casts a hopeful spotlight, while the Directional Movement Index (DMI) echoes a strong momentum despite a minor quiver.
In this performance, the high and low notes are marked by:
- Resistance Levels: $7.79, $10.00, $12.75
- Support Levels: $6.97, $5.85, $5.66
Amidst a chorus of mixed sentiment, with a Fear & Greed Index score of around 50, the audience holds a breath of cautious optimism. As the curtains of the market drama flutter, will LINK soar in a bullish ballet towards $12.75, or tumble to the bearish depths of $5.66? The baton trembles at $7.79, awaiting to cue LINK's next act in this market theatre, with eyes glued to the unfolding narrative and ears tuned to the market's rhythm, the breakout at $7.79 could be the opening act of a bullish symphony or a bearish dirge.

LINKUSDT - 05/10/23LINK
NOTES:
We look like we are ready to take off here from a cup handle on the 4hr, if BTC breaks out and does the move I'm in the trade for then this will break $8 today!
Targets:
Bullish: $8.80 then $9.50 are my take profits if BTC pumps or this breaks the SUPPLY at $8!
Bearish: $7.00 could be a last leg down before they push up and break if the handle I made doesn't hold I will not take this trade unless the handle breaks and tests!
