GOLD (XAUUSD) | Smart Money Buy Setup from Demand Zone 📝 Description:
Gold is showing a potential reversal structure from the lower demand zone after a liquidity grab near $3,962.
The price is now reacting bullishly from the mitigation block and aiming toward the supply zone at $3,984–$4,019.
Trade Plan:
Entry: From $3,972–$3,975 demand zone (after liquidity sweep)
Stop-Loss: Below $3,962 (structure invalidation)
Target: $4,019 (supply zone / PDH area)
Bias: Bullish – expecting continuation toward previous highs
R:R: ~1:3 setup
If price cleanly breaks above $3,984, expect further continuation to $4,029 (Previous Day High).
A failure to hold above $3,962 would invalidate this bullish setup.
Liquidity

NZDJPY — Waiting for the Sweep Before the ImpulseThe market is setting its own stage.
The green ABC correction is approaching its final C-leg — right into a cluster of confluence: trendline support, an internal order block, and a liquidity pocket resting beneath the prior lows.
I’m waiting for that final sweep into the OB/trendline area before stepping in to ride the pink impulsive C-leg toward the upper channel and buyside liquidity zone near 88.6 – 88.8 .
The plan is simple:
– Let the algorithm complete its cleanup below.
– Watch for an MSS and fair-value-gap confirmation.
– Ride the next displacement toward the liquidity resting above.
Invalidation:
If price violates the order block decisively and structure fails to shift, the setup expires.
Strengths:
– Clear multi-timeframe wave alignment (green correction → pink impulse)
– Strong OB + trendline + liquidity sweep confluence
– High reward potential once the pink C-leg activates
Weaknesses:
– Early entries before sweep risk being trapped
– Yen volatility can disrupt lower-timeframe confirmations
Summary:
Patience before precision. I’m waiting for the sweep to finish — then decoding the next wave of chaos.

EURUSD | Bias Shift & QML Zone in FocusThe previous setup has been invalidated as the market showed a clear Change of Character (ChoCh), flipping the structure and order flow to bullish.
With that shift, my bias has now turned bullish, and I’ve marked the QML (Quasimodo Level) zone as my area of interest.
I’ll be waiting for price to tap into this zone and show confirmation before considering any execution.
Adaptability is part of discipline — the market evolves, and so should the bias.
⚠️ Disclaimer: This analysis is for educational purposes only. Always manage your risk and trade responsibly.

Liquidity Sweep For NEE? For NEE (NextEra Energy), a bearish liquidity sweep occurred when price pushed above a recent swing high, triggering buy stops and drawing in breakout traders. This move was quickly rejected, with price closing back below that high — a sign that larger players used the liquidity to fill short positions. The sharp rejection shows that buy-side liquidity was absorbed, shifting momentum back to the downside. In essence, NEE’s bearish liquidity sweep signals a potential reversal lower after trapping late buyers.

XLMUSD — Bullish Continuation Valid While Red B HoldsFrom the top-down view, XLM completed a deep corrective structure that bottomed inside the previous WCL (blue box). The current sequence builds a new bullish cycle , with the red ABC wave mapping cleanly against both structural and liquidity geometry.
Price reacted strongly from the red BC demand zone , producing a local yellow ABC micro-sequence. The setup anticipates continuation toward the upper WCL region (0.38 – 0.42) .
The re-entry area sits near the mid-trend retest—confirmation required via MSS + FVG displacement.
Invalidation:
This idea remains bullish until the red B low is broken . Violation of that pivot voids the wave count and resumes the broader correction.
Strengths: – Multi-timeframe alignment (macro + micro)
– BC demand reaction with displacement
– Defined invalidation under red B (lowest-risk logical stop)
Weaknesses:
– Correlation drag if majors retrace
– Shallow pullbacks may induce premature MSS signals
Summary:
Bulls control the rhythm while red B stands. Break B — and the music stops.

EURNZD potential for the upside.Currently taking long positions upon the retest of the 1h low that formed after retesting the 4h broken structure.Use proper risk management should you decide to join me.

GOLD (XAUUSD) – Liquidity Grab Setup | Buy-Side Sweep ScenarioGold is currently consolidating between $4,044 (PDL) and $4,113 (Buy-Side Liquidity Zone).
Price recently reacted from the demand zone near $4,044–$4,058, showing signs of bullish absorption.
The plan: a short-term liquidity sweep below $4,078, followed by a potential push toward $4,097–$4,113.
Key observations:
Buy-side liquidity resting above $4,097 and $4,113.
PDL ($4,044) and discount zone acting as a strong accumulation base.
Ideal scenario: Sweep of minor lows → structure shift → long entries targeting $4,113.
Watch for reaction near $4,068–$4,078 for confirmation.
Break below $4,044 invalidates the bullish setup.
📊 Bias: Short-Term Bullish (Intraday)

EURNZD| Confirmation in Key Discounted ZoneHigher timeframes show strong bullish structure, with recent highs already broken in previous weeks. Instead of remapping completely, we’ve refined previous markings and updated key levels to reflect the current flow.
Our focus remains on continuation from the higher timeframe perspective, with mid-timeframe structure carefully mapped and refined. Price is currently interacting with the lighter orange zone, roughly at the 50% equilibrium — a pivotal area where movement could go either way.
While a breach of the lower high on lower timeframes could occur, our preference is waiting for a deeper mitigation in the darker orange zone beneath the 50% equilibrium, ideally creating a spike for clean lower-timeframe confirmation.
Once we see that mitigation, we’ll monitor lower timeframe reactions to validate bullish continuation before taking entries. Until then, we remain disciplined: monitoring, following structure, and letting smart money lead the way.
Let’s keep going. 🔥

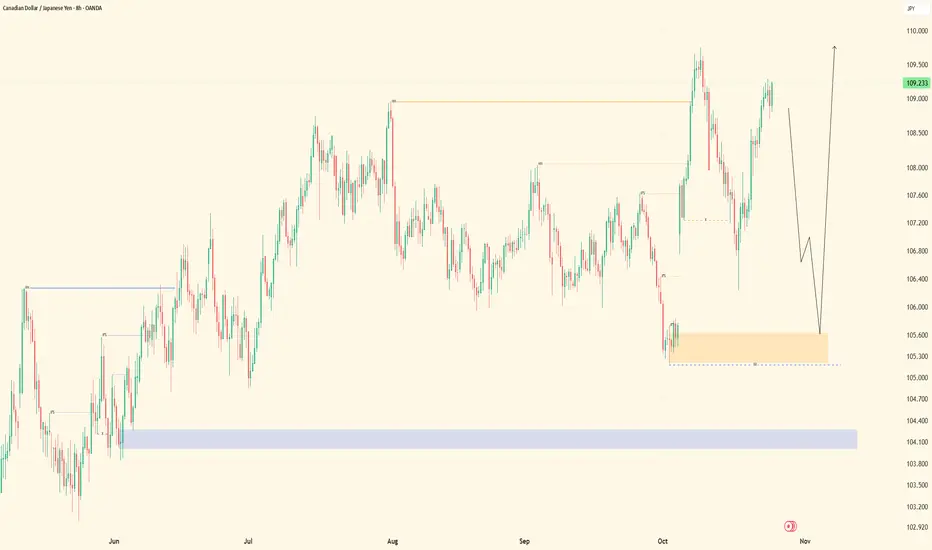
CADJPY| Bull Structure- Waiting for Deep Mitigation Higher timeframes show a strong bullish structure, refined and mapped to perfection. Our overall bias remains upward, but patience is key — we’re waiting for a deep drop into our order block zone beneath price before seeking precise entries.
On mid-timeframes, we’ve refined structure and order blocks, confirming where continuation opportunities may appear. Currently, price is dancing around premium areas, showing signs of consolidation and energy build-up.
If price decides to break significant highs to the left, we’ll follow price and monitor fresh liquidity generation, aiming to capitalize on the next leg higher. Until then, we take it step by step, letting price do its work without forcing predictions.
💡 Remember: Our job is not to predict the market, but to follow smart money and structure, letting price lead the direction.
Patience, discipline, and precision — that’s how we play the game.
Let’s go. 🔥
GBPAUD| Waiting for Deeper Mitigation Before Next Leg UpHigher timeframes show a strong bullish structure, and we’ve had some significant price spikes in the past — nothing to worry about. Our current focus is far right price action, where structure and order flow are aligning for continuation.
From the higher timeframe blue order block zone, we observed a sell-side liquidity sweep. Price respected structure, leaving no violations, confirming the presence of smart money activity.
Dropping into mid-timeframes, we caught a structural switch, breaking the prior lower high and signaling bullish intent. We are now waiting for a higher-low print within our order block — deeper mitigation is the next step before execution.
Patience is key: we’re letting price lead the way, following structure, and waiting for the proper alignment before taking entries. Smart money dictates the move, and we respect it.
Until then, we monitor, stay ready, and let the setup unfold naturally.
Let’s go. 💪🏽

EURGBP| Waiting on that One Proper Sweep Before the PushHigher timeframes continue to maintain a clean bullish structure, keeping the overall narrative to the upside. EURGBP remains one of my favorite pairs due to its precise reactions and consistent structure.
On the mid-timeframes, price delivered the continuation we were tracking — tapping into the first orange order block and holding that area with intent. Dropping down to lower timeframes, we confirmed a CHoCH and saw bullish momentum build, taking out prior highs before forming a new internal range.
Toward the far right of structure, price printed a minor internal lower high break, setting up the stage for a sell-side liquidity sweep. That sweep is currently in play, and we’ve already seen a weak mitigation from the prior order block area.
Right now, we’re waiting for a proper, deeper sweep of sell-side liquidity followed by confirmation — that’s when we’ll engage new buy points targeting fresh highs. Until then, patience is key: we continue to follow price, monitor behavior, and let smart money show intent.
Everything’s aligning — just waiting on delivery.
Let’s go. 🔥

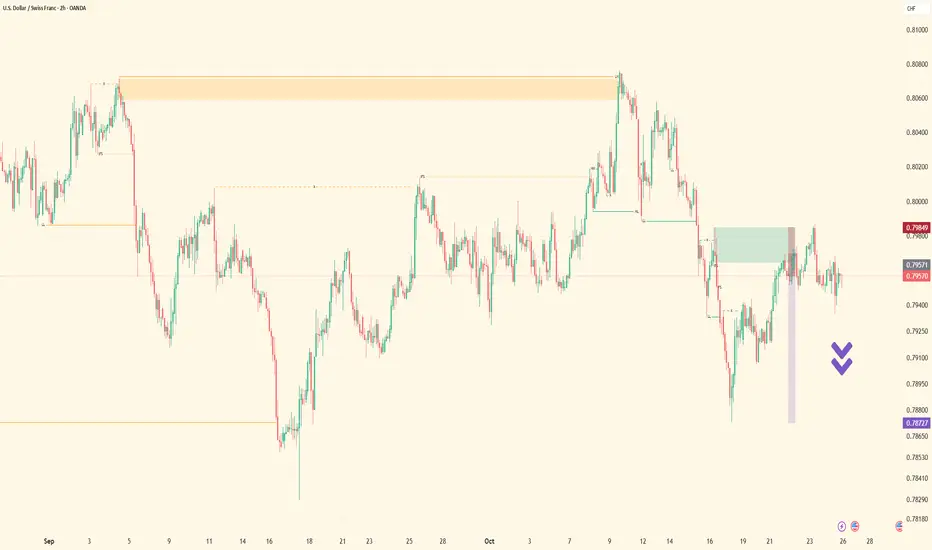
USDCHF| Supply in Control-Watching for Continuation to DownsideOn higher timeframes, price maintained a bullish formation, showing steady continuation for several weeks. As we approached mid-timeframe premium levels, price reacted cleanly to a supply zone, creating the first signs of exhaustion within the bullish leg.
From that reaction, I began closely monitoring structure. As price tapped into the mid-timeframe order block, we refined the view on lower timeframes and caught a clear CHoCH — a break of the prior higher low. That structural break confirmed a shift in momentum, and price responded with a strong drop.
After taking buy-side liquidity, price mitigated our lower-timeframe order block, setting the stage for another potential leg down once markets open. I’m not expecting an extreme or volatile selloff, but rather a controlled, gradual move to the downside.
The main focus now is to see 5-minute lows breached, which would reset structure and open continuation opportunities toward 30-minute and higher-timeframe lows.
Until then, we remain patient — simply watching and monitoring for clean confirmation before engaging again.
Let’s stay locked in and let smart money show its hand. ⚡️
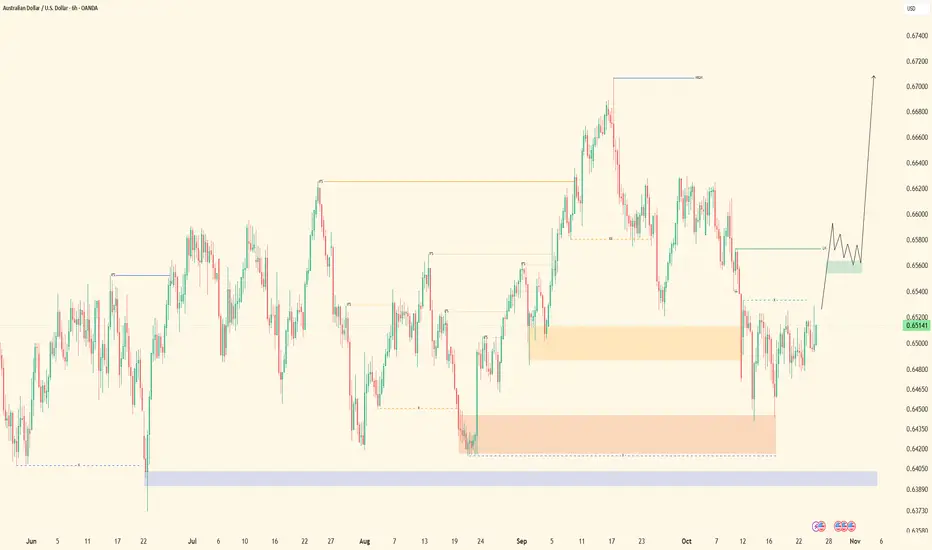
AUDUSD| Bullish Range Intact-Refining Structure for Continuation
Price remains in a bullish uptrend, continuing to respect higher timeframe structure from previous weeks. The market is still operating within its higher timeframe range, and current momentum shows intent for continuation to the upside.
Dropping into mid and lower timeframes, we’ve refined structure and identified order blocks within discounted areas. Both the lighter and darker orange zones represent key mitigation areas where price has already shown reaction and respect.
From those zones, we’re now seeking lower timeframe confirmations to align with bullish continuation. On the chart, price is currently climbing toward a lower high, which serves as our next short-term target.
Once that lower high is taken, we’ll anticipate a pullback into the discounted range for deeper mitigation opportunities — that’s where we’ll be looking for our next long entries within the bullish leg.
Until then, it’s all about alignment and patience — following price, following smart money, and letting the structure unfold. Execution will come once delivery confirms it.
Let’s go. 🔥
EURJPY| Bullish Structure Holding - Waiting on Discounted SyncHigher timeframes continue to show strong bullish structure, with steady momentum driving price upward.
At the moment, we’re seeing clean directional flow to the upside, and as long as higher timeframe structure remains intact, our bias stays bullish.
Personally, I’m waiting for price to drop into discounted areas to seek proper mitigation before any continuation plays.
If price decides to break recent highs first, we’ll adapt — monitoring closely for new projection levels and following market delivery in real time.
What we need next are proper inducement and liquidity sweeps, ideally forming a courtyard-style setup before re-entry. Until then, it’s patience, observation, and precision — doing my job as a trader by letting the market lead.
Whether we get that deeper mitigation or a clean high breach, we’ll be ready to act accordingly.
Until then, we sit tight and follow structure. Let’s go. 💪🏽

GBPUSD| Deep Mitigation Complete - Now Awaiting Bullish DeliveryPrice continues to respect higher timeframe structure, maintaining the bullish narrative from previous weeks.
Our blue zone represents the core higher timeframe order block, and price has consistently responded with precision — showing smart money’s hand clearly in play.
From that foundation, we dropped into lower timeframes to confirm alignment and validate bullish continuation. Price delivered a clear CHoCH, followed by a mitigation into our lighter orange zone, which produced multiple refined setups and ultimately led to a new high.
As the new week began, price dipped deeper into the darker orange zone — the next layer of premium mitigation. From there, we’ve observed a fresh structural switch confirming buyers are regaining control.
We are now long and patiently awaiting delivery toward higher objectives. Until the market completes delivery, we remain disciplined — no forcing, no anticipation beyond confirmation.
We follow price, let structure speak, and move in sync with smart money.
Market open is near. Let’s execute with patience and precision.
Let’s go. ⚡️

EURUSD| Maintaing Structure & Awaiting Final DeliveryHigher-timeframe structure continues to hold firm, keeping our bullish narrative intact.
Last week, price mitigated key 4H levels and confirmed continuation through mid-timeframe order flow — giving the precision entry we were anticipating.
From entry, price has respected every structural checkpoint and is now approaching the final 5-minute high that must be breached for full delivery. This zone represents the last liquidity pocket before completion of our projected target range.
At this stage, it’s not about forcing new positions — it’s about letting structure deliver.
All confirmations remain aligned: higher-timeframe momentum supports continuation, and lower-timeframe reactions are maintaining bullish flow without displacement violations.
We’ll continue to monitor the 5-minute range for any final mitigation before the push through that high. Once breached, we’ll evaluate potential exhaustion or continuation into premium territory.
Patience and precision — execution is already done, now it’s about trusting the system and waiting for delivery.
Let’s finish strong. ⚡️

GBPJPY| Deep Mitigation Before Bullish ContinuationHigher timeframe structure remains bullish, still respecting last week’s flow.
We’ve seen mid-timeframe mitigation, and from that zone, price continues showing bullish intent in alignment with higher timeframe order flow.
Currently, we’re monitoring price for deeper mitigation into discounted areas — watching how it interacts with those two key green levels.
Once price reaches mitigation within our lower timeframe range, we’ll drop down for confirmation entries to target 5M and 30M highs, depending on market delivery.
Until then, patience and precision. Let the deeper mitigation come to us.
Let’s go.

Analysis of gold movement on the 4-hour time frameHi traders
Gold has not been able to close a candle above the equilibrium range (4114) for the 4-hour time frame for now, but it can have an upward movement to the resistance areas, pick up the rising liquidity, and then return to close a candle below the 4-hour equilibrium range (it can stabilize below 4067, in which case it will pullback to 4067 and 4090 and towards the sell).
For the resistances in question, 4171 - 4193 and 4208 - 4231 are two one-hour equilibrium resistances that the market has not yet pulled back to these numbers, and the 4-hour candle after the pullback should stabilize below these areas to confirm the continuation of the decline to low liquidity and sellers' TPs

How Smart Money Moves Gold (XAUUSD)🟡 Gold never moves randomly — it moves with intention.
Every spike, every fake breakout, every sharp reversal… it’s all part of a bigger plan by smart money (institutions) to trap emotional traders and collect liquidity.
Let’s break it down 👇
⚡ 1️⃣ Liquidity Grab (The Trap Phase)
Before any real move, gold sweeps stop-losses above highs or below lows.
Retail traders think it’s a breakout — but it’s actually a liquidity hunt.
Smart money fills large positions here while emotions run high.
⚡ 2️⃣ Market Structure Shift (The Clue)
After collecting liquidity, watch for a BOS (Break of Structure) or CHoCH (Change of Character) — these reveal when the real move is starting.
⚡ 3️⃣ Smart Money Entry (The Real Move)
Once the trap is set, gold often makes a strong impulsive push.
This is where institutions enter — and where smart traders follow with confirmation, not emotion.
⚡ 4️⃣ Emotional Traders Lose, Logical Traders Win
The market doesn’t hate you — it simply feeds on emotional reactions.
Be patient, wait for liquidity sweep ➜ structure shift ➜ confirmation entry.
🧭 Pro Tip:
👉 Stop chasing candles.
👉 Study liquidity and market structure.
👉 Let the chart show who’s trapped — and then trade against them.
💬 Remember:
“The market rewards patience, not panic.”
💎 Gold (XAUUSD) moves on liquidity — not luck.
#TradeSmart #ThinkLikeInstitutions #XAUUSD

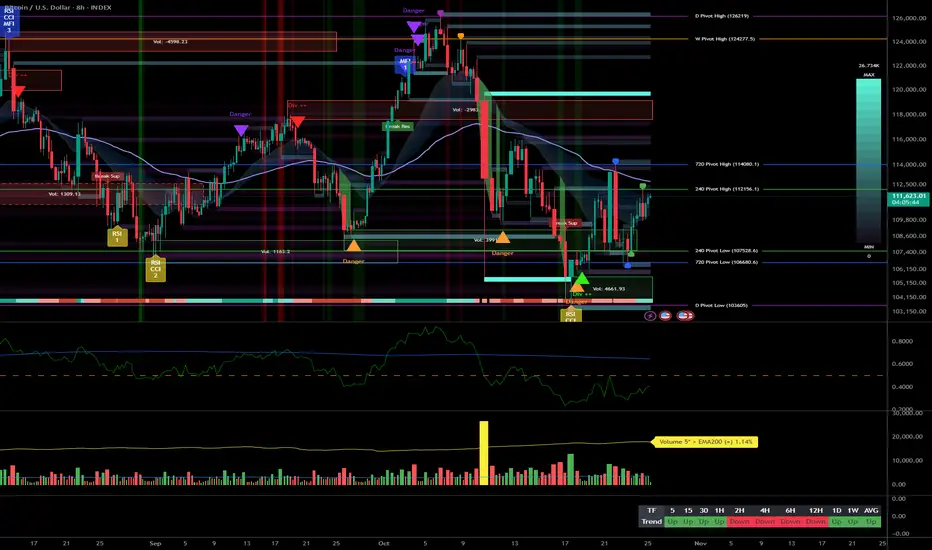
BTC: Range below 114k — breakout soon or fresh rejection?__________________________________________________________________________________
Market Overview
__________________________________________________________________________________
BTC is range-bound below 112,600–114,000, with improving intraday momentum but a firm HTF supply shelf overhead. The broader backdrop stays constructive while supports hold, pending a liquidity catalyst.
Momentum: Range with a bullish skew 📈 if 112,600 breaks and holds.
Key levels:
- Resistances (12H–1D): 112,600–114,000, then 116,000.
- Supports (2H–1D): 111,000–110,300, then 108,600.
Volumes: Normal to moderate (1H–4H), acting as an amplifier on rejections/breakouts.
Multi-timeframe signals: 1D Up, while 12H/6H/4H remain Down; intraday (2H/1H/30m/15m) Up but capped under 112,600–114,000.
Risk On / Risk Off Indicator: Mixed read (NEUTRAL SELL vs NEUTRAL BUY) → overall neutral stance, waiting for flow confirmation; this aligns with a range rather than a trend.
__________________________________________________________________________________
Trading Playbook
__________________________________________________________________________________
Strategically, the dominant trend is neutral below 112,600–114,000; stay opportunistic: buy a clean breakout or tactically sell a clear rejection.
Global bias: Neutral with buy-on-breakout skew above 112,600; key invalidation if 1D closes below 108,600.
Opportunities:
- Breakout long: Close + retest above 112,600 targeting 114,000 then 116,000.
- Buy the dip: 111,000–110,300 (or 108,600) on a bullish 2H–1D rejection.
- Tactical short: Rejection at 112,600–114,000 aiming 111,000 then 110,300.
Risk zones / invalidations:
- Below 108,600 on a 1D close: HTF structure weakens → risk of acceleration toward 106,800.
- Above 114,000 on 4H/1D: invalidates range shorts and opens 116,000.
Macro catalysts (Twitter, Perplexity, news):
- FOMC and liquidity tone (potential QT end) as key driver.
- US equities at ATHs: supportive risk backdrop while it lasts.
- BTC spot ETF flows mixed: uneven tailwind, needs confirmation.
Action plan:
- Entry: 112,650–112,900 (clean break/retest on 1H–4H).
- Stop: below 111,900 (breakout play) or below 110,300 (dip play).
- TP1: 114,000; TP2: 116,000; TP3: 118,500 (if extension).
- Approx R/R: 1.8R to 2.5R depending on stop and scaling.
__________________________________________________________________________________
Multi-Timeframe Insights
__________________________________________________________________________________
Overall, HTFs stay rangey under a stacked resistance shelf, while LTFs press into the 112,600 pivot.
1D: Uptrend but capped beneath 112,600–114,000; a clean reclaim/hold would unlock 116,000.
12H/6H/4H: Down/corrective; countertrend bounces likely capped at 112,600–114,000 absent confirmed closes.
2H/1H/30m/15m: Rising structure with higher lows; continuation on break & hold of 112,600, otherwise rotation risk toward 111,000–110,300.
Major divergences: Mixed 1D Up vs 12H Down; raises the bar for confirmation (retest + volume) on any breakout.
__________________________________________________________________________________
Macro & On-Chain Drivers
__________________________________________________________________________________
Macro/on-chain is mixed: potential risk-on via liquidity, but demand signals remain cautious below resistance.
Macro events: Fed QT reportedly nearing an end (near-term), risk supportive; US indices at ATHs; FOMC next → primary liquidity tone driver.
Bitcoin analysis: Pinned between the 200D (~108.5k) and STH cost basis (~113.1k); a daily close above ~113.1–116.0k unlocks higher; loss of ~108.5k risks 100–101k.
On-chain data: Below STH cost basis, demand fatigue; elevated LTH distribution; cautious options → need flow impulse to validate a breakout.
Expected impact: Constructive technical bias contingent on a confirmed break; without liquidity impulse, the range can persist.
__________________________________________________________________________________
Key Takeaways
__________________________________________________________________________________
Range beneath 112,600–114,000 with improving intraday but HTF supply still in control.
- Trend: Neutral, bullish if a clean break above 112,600; key supports at 111,000–110,300 and 108,600.
- Setup: Break & retest > 112,600 toward 114,000/116,000; alternative is disciplined dip-buys on bullish wicks at 110,300–108,600.
- Macro: FOMC + liquidity tone (potential QT end) is the main trigger.
Stay patient: wait for confirmation (close + retest + volume) and let flows lead risk. ⚠️
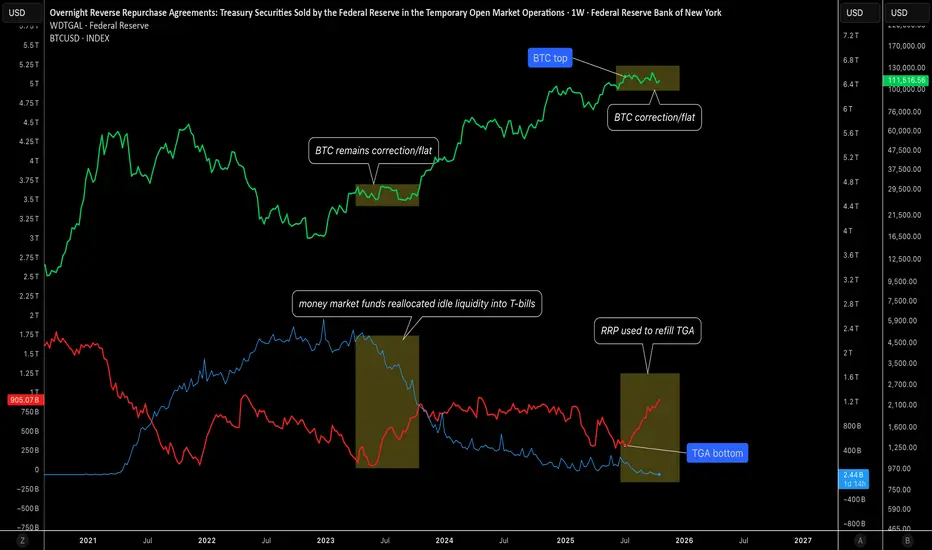
RRP Exhaustion and TGA Rebuild Signal a Tightening Cycle1. Overview
Liquidity conditions across the U.S. financial system have entered a tightening phase once again.
The U.S. Treasury General Account (TGA) has surged from its June low of around $200 billion to roughly $905 billion today, while the Federal Reserve’s Reverse Repo Facility (RRP) has collapsed to just $2 billion, effectively empty.
This shift marks the end of the liquidity buffer that had supported markets over the past year, and the consequences are now visible across risk assets, particularly Bitcoin, which has been trending lower since the TGA bottomed in June.
2. Liquidity Mechanics
The interaction between the TGA and RRP is central to understanding current market dynamics.
- When the Treasury rebuilds its TGA, it issues short-term bills and absorbs cash from the financial system.
- During 2023 and early 2024, this liquidity drain was largely offset by reductions in the RRP balance, as money market funds reallocated idle liquidity into T-bills.
- That mechanism kept overall market liquidity relatively stable — the RRP served as a shock absorber.
Today, that buffer is gone. With RRP nearly depleted, any additional TGA build now draws directly from the banking system’s reserves, tightening liquidity conditions beneath the surface.
3. Liquidity Inflection and Market Correlation
The TGA bottomed in June at around $200 billion, a point that coincided almost perfectly with the Bitcoin top near its recent cycle highs.
This correlation is not coincidental, it reflects the direct relationship between system liquidity and speculative risk demand.
As Treasury began rebuilding its cash balance, liquidity was redirected away from markets and into government accounts.
That liquidity drain aligns with the ongoing weakness in high-beta assets such as crypto and small caps, despite relatively stable macro data and policy expectations.
4. Current Liquidity Regime: Neutral in Level, Tight in Flow
At the aggregate level, liquidity may appear neutral — the increase in TGA has been offset by the decline in RRP, keeping the total size of Fed liabilities roughly unchanged.
However, the composition of that liquidity has deteriorated.
- The RRP is now empty, meaning the system no longer has an easy liquidity source to fund further Treasury accumulation.
- TGA is high and rising, effectively absorbing capital that could have supported credit or speculative flows.
- The bank reserve base is beginning to feel the pressure, tightening funding conditions quietly but steadily.
The result is a liquidity regime that is not collapsing but no longer expanding, which explains why risk assets are stagnant. There is no incremental liquidity flowing down the risk curve.
5. Fiscal and Structural Headwinds
The current U.S. government shutdown further complicates the outlook.
It restricts Treasury operations, delays issuance flexibility, and slows the recycling of liquidity back into the private sector. This prevents the RRP from being refilled and reinforces the liquidity stasis across markets.
In other words, the system is locked:
- The TGA is high and still rising.
- The RRP is empty.
- Reserves are now the adjustment variable, meaning further tightening could emerge if the Treasury continues to absorb cash.
6. Market Implications
- Liquidity exhaustion is becoming visible in market behavior.
- The TGA rebuild represents a clear liquidity drain as it is no longer offset by RRP balances.
- BTC’s reversal from its June peak reinforces the correlation between Treasury liquidity cycles and speculative risk performance.
The neutral aggregate liquidity masks an underlying structural tightening, there is no new money reaching markets.
Until the TGA begins to decline again, releasing liquidity back into the system, the bias for risk assets remains constrained. Markets are likely to remain choppy, with limited upside momentum due to the absence of fresh liquidity inflows.
7. Conclusion
Liquidity conditions are neutral in total but tight in structure. The RRP’s depletion removes the last line of defense against Treasury-driven liquidity absorption.
With the TGA near $905 billion and still rising, risk assets are operating in an environment where no new liquidity is entering the system, only being recycled internally.
The correlation between June’s TGA low and Bitcoin’s top highlights just how sensitive speculative assets are to liquidity cycles.
Until Treasury spending or Federal Reserve policy shifts inject new reserves into the system, market liquidity will remain capped and so will risk appetite.
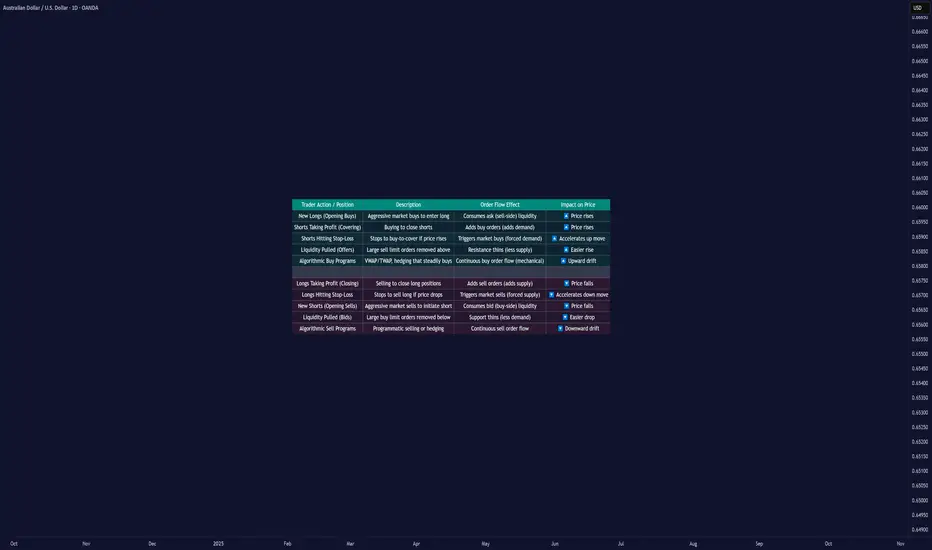
Why Prices Move Up or Down: Order Flow and Liquidity█ Why Prices Move Up or Down: Understanding Order Flow and Liquidity
Most traders are told that prices rise because “there are more buyers than sellers,” and that prices fall because “there are more sellers than buyers.” But that’s not how markets actually work. In every transaction, there’s always one buyer and one seller; what really matters is which side is more aggressive and how liquidity responds to that aggression.
Price movement is the result of order flow interacting with liquidity. When buyers use market orders and aggressively lift the available sell orders (the ask), the price moves up. When sellers hit the bid with market orders, the price moves down.
In short, price moves in the direction of the side that consumes liquidity.
█ The Engine Behind Price Movement
When buyers and sellers agree on price, the market ranges, there’s a balance. When one side becomes more aggressive, an imbalance occurs, and the price must adjust until new liquidity appears.
Imagine the market like a ladder made of buy and sell orders. Each rung shows where traders are waiting, buyers below the current price, and sellers above it. These waiting orders are what we call liquidity.
When a trader sends a market buy order, they’re not waiting; they want to buy immediately. That order takes the best available sell price (the ask). If more traders keep doing this — buying aggressively — those sell orders get used up faster than new ones appear. As a result, the next available sell price is higher, and the price moves up until new sellers fill the gap.
The same logic applies in reverse: when aggressive market sell orders hit the bids, they consume the buy-side liquidity. Once those bids are gone, the next available buyer is lower, and the price moves down.
This continuous back-and-forth, liquidity being consumed, replaced, or withdrawn, is the real engine of every price movement.
█ Why Prices Move Up
1. Aggressive Buying (New Longs)
When new participants enter with market buys, they lift the offers, consuming sell-side liquidity. If this continues, the price climbs until enough new sellers appear to absorb demand. This is the cleanest form of demand-driven uptrend, with new buyers initiating positions.
2. Short Covering
The price moves higher as short sellers buy back positions. This can happen when stops are triggered after a price rise or when shorts take profits after a decline. In both cases, their buying adds upward pressure. When many cover at once, the move can accelerate into a short squeeze — higher prices trigger stops, which trigger even more buy orders, creating a self-reinforcing rally.
Profit Taking Phase
Short Squeeze Phase
3. Stop-Loss Triggers
Clusters of stop-loss orders above previous highs act as “fuel.” When price breaks those levels, automatic buy orders fire off. These aren’t new investors; they’re forced buyers closing shorts. The result is a fast, often exaggerated upward burst.
4. Thin Liquidity and Pulled Offers
Sometimes, price surges not because of huge buying, but because there’s nobody selling. If the sell side of the order book is thin, or if large resting orders get canceled, even small buys can sweep multiple levels. This creates those “air pockets” where price jumps several ticks in seconds.
5. Algorithmic and Institutional Flows
Institutions use automated execution algorithms like VWAP or TWAP to buy steadily throughout the day. These constant flows absorb liquidity over time, creating a slow upward bias. Similarly, option dealers who are short gamma must buy as prices rise to stay hedged, adding even more mechanical buying pressure.
█ Why Prices Move Down
1. Aggressive Selling (New Shorts)
When traders use market sells, they consume buy-side liquidity. If this persists, the price naturally ticks lower as bids disappear, and the next buyer will be willing only at a cheaper level.
2. Long Profit-Taking
At some point, long traders sell to realize profits. These sales add supply, which can cap or reverse an uptrend. It’s not bearish conviction; it’s simply existing longs exiting their positions.
3. Long Stop-Loss Cascades
If prices fall to where many long traders placed stops, those automatic sell orders trigger, creating a chain reaction of forced selling. This is the mirror image of a short squeeze — a long liquidation cascade.
4. Thin Bid Liquidity or Pulled Bids
When buy orders disappear, the market has no floor. Even modest selling pressure can make the price fall through several levels until new bids emerge. This is how “flash drops” occur during low-liquidity periods.
5. Algorithmic and Mechanical Selling
Negative news or risk events can activate automated sell programs, from funds rebalancing to dealers hedging short options exposure. These trades can intensify selling, even without new bearish sentiment.
█ New Positions vs. Exits — The Hidden Difference
Not every up-move means new buyers are coming in, and not every down-move means new shorts.
Some moves happen because existing positions are being closed, not opened. and that distinction matters.
New Positions (Initiative Flow): Create real trends, since they bring new demand or supply.
Position Exits (Reactive Flow): Often short-lived, they relieve pressure rather than add it.
One way to tell the difference is through open interest (in futures or options):
Price up + Open Interest up → new longs entering (sustainable).
Price up + Open Interest down → short covering (temporary).
Price down + Open Interest down → long liquidation (often near exhaustion).
Price down + Open Interest up → new shorts entering (trend formation).
█ The Real Takeaway
Price doesn’t rise because “buyers beat sellers.” It rises because buyers were more aggressive, consuming available sell orders faster than they were replaced. It falls when sellers become more aggressive, taking out the bids.
Both entries and exits can push the price the same way:
New longs and shorts covering both create buy pressure.
New shorts and longs taking profit both create sell pressure.
To truly understand a move, traders must ask:
Who initiated it, new positions or forced exits?
Was liquidity added or withdrawn?
Did open interest confirm new participation or show a squeeze?
Once you start thinking in these terms, price becomes more than a random chart line; it becomes a story of liquidity and intent unfolding in real time.
█ Multiple Forces in Motion
While each example above highlights a single mechanism in isolation, the market rarely moves for one reason alone. In real trading, several of these forces often act simultaneously, new longs entering, shorts covering, stops triggering, algorithms executing, and liquidity thinning.
When multiple flows align in the same direction, the result is acceleration, price moves rapidly as liquidity vanishes, and reactions compound. When opposing forces meet, price can stall, consolidate, or violently whip as both sides compete for control.
In essence, market movement is the sum of overlapping liquidity events, not isolated causes. Understanding how these factors interact in real time is key to reading true intent behind every move.
█ In summary:
Markets move not because of “more buyers” or “more sellers,” but because one side becomes impatient, consumes liquidity, and forces repricing until balance returns.
Understanding who’s moving the market and why — new positioning, forced exits, or vanished liquidity — is the foundation of reading true market intent.
-----------------
Disclaimer
The content provided in my scripts, indicators, ideas, algorithms, and systems is for educational and informational purposes only. It does not constitute financial advice, investment recommendations, or a solicitation to buy or sell any financial instruments. I will not accept liability for any loss or damage, including without limitation any loss of profit, which may arise directly or indirectly from the use of or reliance on such information.
All investments involve risk, and the past performance of a security, industry, sector, market, financial product, trading strategy, backtest, or individual's trading does not guarantee future results or returns. Investors are fully responsible for any investment decisions they make. Such decisions should be based solely on an evaluation of their financial circumstances, investment objectives, risk tolerance, and liquidity needs.
GBPJPY — Eyeing Reaction from 204.00Price swept buy-side liquidity and shifted structure, leaving a refined 15M order block nested inside a 1H breaker and aligned with the 4H bearish flow.
I’m watching that zone for lower-timeframe confirmation to join the next move down.
If the zone holds, it’s a continuation setup. If it breaks, I step aside — no bias, just structure and probability.
Liquidity feeds the patient.
