AUD/USD| Bullish Continuation SetupBias: Bullish
HTF Overview (4H):
Price remains bullish on the higher timeframe, respecting the overarching structure. Momentum is aligned with smart money intent, and buyers are maintaining control within the 4H range.
MTF Overview (30M):
On the mid-term chart, inducement play has been executed, with sell-side liquidity cleared. Price initially fell into lighter orange order blocks, then swept deeper into the darker discounted level, where it respected the zone. This indicates potential for continuation of bullish activity.
LTF Confirmation (5M):
Lower timeframe break of structure occurred, taking out prior minor lower highs. Price interacted with minor sell-side liquidity and tested recent order blocks, confirming interest. Entry executed once lower timeframe confirmation aligned with the deeper PD zone.
Execution Plan:
Stops below the minor 5M structure. Targets: 5M highs → 30M highs → aligning with 4H highs, depending on market delivery and momentum. Entry only taken once structure confirms and price shows follow-through.
Trade Management:
Partial exit at first 5M high, second scale at 30M high. Trail stops below last 5M structural low. If momentum persists, hold for potential 4H swing continuation. Reassess if price hits stop-loss and plot PD grid for next valid entry.
Mindset Note:
Accept losses gracefully — structure guides the plan. Smart money dictates direction; patience ensures precision.
Progress Hook:
Each mitigation and sweep reinforces discipline — staying calm under pressure allows me to spot higher-probability setups.
Tags:
#SMC #SmartMoneyConcepts #Liquidity #Inducement #OrderBlock #AUDUSD #Forex #InducementKing
Liquidity

USD/JPY| Bullish Continuation SetupBias: Bullish
HTF Overview (4H):
Strong bullish momentum is climbing steadily, leaving clear volume and momentum signals at the upside. Price currently sits at highs, showing sustained buyer control and high timeframe bullish intent.
MTF Overview (30M):
We’ve mapped and refined structure, identifying inducement and waiting for sell-side liquidity to be taken. Price is expected to drop into the 30M order block below (orange zone) before presenting a proper setup. Smart money activity is guiding this movement — patience is key.
LTF Confirmation (5M):
Waiting for a lower timeframe CHoCH to form: break of lower highs followed by micro-high creation. This will allow a clean entry off the fresh OB and capture the inducement sweep.
Execution Plan:
Stops placed below the 5M structure. Targets scaled from 5M highs → 30M highs → 4H highs, depending on momentum and market delivery. Entry executed only once lower timeframe structure confirms.
Trade Management:
Partial exit at 5M high, second scale at 30M high, trail stop below last 5M low. Full swing extension considered if momentum sustains toward 4H highs.
Mindset Note:
Patience before execution — smart money sets the stage, I follow only when structure confirms.
Progress Hook:
Mapping HTF to LTF with patience ensures precision entries — each setup reinforces disciplined observation.
Tags:
#SMC #SmartMoneyConcepts #Liquidity #Inducement #OrderBlock #USDJPY #Forex #InducementKing

GBP/USD| Bullish Continuation SetupBias: Bullish
4H Overview (Higher Timeframe):
Structure has broken significant highs, showing clear bullish intent. After taking out inducement and sweeping sell-side liquidity, price fell into our 4H order block and reacted strongly — printing a clean bullish wick and confirming high timeframe interest.
30M (Mid-Term Context):
Price has efficiently cleared sell-side liquidity and tapped into the refined mid-term zone. We’ve seen a healthy drop into the orange zone, which aligns with our discounted range. From here, I’m watching for price to hold this territory and present a lower timeframe break of structure — ideally a 5M LH break and pullback to confirm the bullish continuation leg toward higher targets.
Execution Plan (5M Entry Framework):
Stops remain below structure. I’ll be looking to execute once a valid 5M CHoCH + pullback forms within this zone, targeting 5M, 30M, and 4H highs depending on delivery and momentum. If price re-enters the zone once the market opens, I’ll be closely monitoring for that shift confirmation.
Mindset Note:
Patience pays — we let smart money reveal its hand before reacting. The setup is already built; we just wait for structure and timing to align.

EUR/USD- Bullish- Maintaining 4H Control🧩 Pair & Bias
EUR/USD – Bullish
Momentum continues to favor buyers as price remains within a strong 4H bullish range.
⸻
⏳ HTF Overview (4H Context)
Higher timeframe structure maintains strong upside momentum showing clear bullish intent for the week.
Price continues to respect the existing 4H range, holding the same structural formation that’s guided price since previous sessions.
Smart money still appears active within the bullish leg — control remains with buyers.
⸻
🧠 Mid-Term (30M Perspective / Inducement Play)
30-minute structure shows sell-side liquidity being taken.
The weak inducement pulled price into a cluster of mid-term OBs below, all of which have been mitigated.
From there, price shifted upward, breaking major LTF lower highs and revealing fresh bullish interest.
Last week’s early long entries were closed during minor retracements; current focus is waiting for new accumulation and confirmation inside this same 4H territory.
⸻
🎯 LTF Execution (5M Details)
• Looking for price to create a new 5M order block within current pullback structure.
• Will re-enter once that fresh 5M OB forms and confirms via CHoCH.
• Stops: always below the most recent 5M structural low.
• Targets: 5M highs → 30M highs → potential 4H continuation if momentum and volume sustain.
⸻
💰 Trade Management
Will allow price to develop naturally. Execution only after confirmation.
Holding time depends on momentum + volume readings and overall delivery behavior.
⸻
💭 Mindset Note
“Patience defines precision. Smart money already knows its path — my job is to wait for the new CHoCH to confirm I’m aligned with it.”
⸻
📈 Progress Hook
“Starting the week refining my 4H-30M-5M mapping and trusting the process. Letting structure, not emotion, guide execution.”
⸻
🔖 Tags
#SmartMoneyConcepts #SMC #InducementKing #MarketStructure #OrderBlocks #LiquiditySweep #Forex #PriceAction #EURUSD

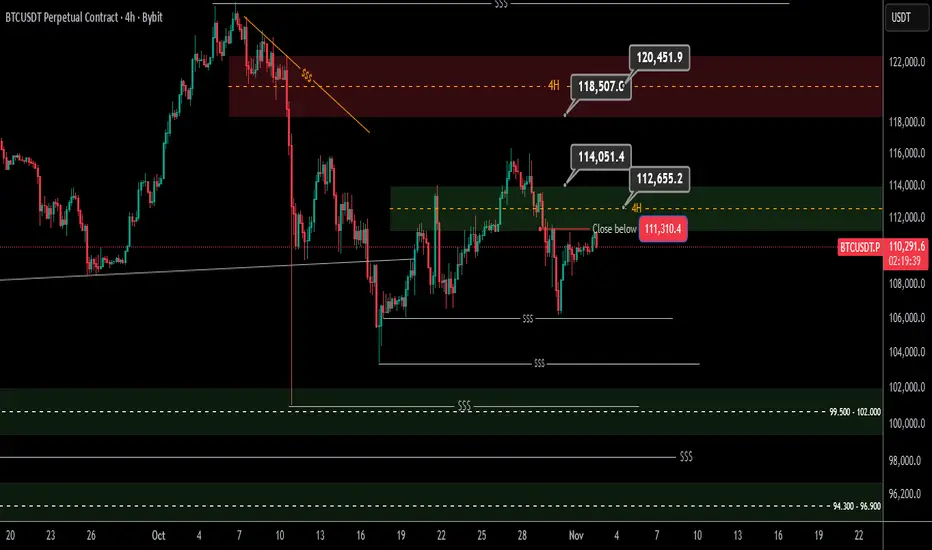
Bitcoin Trend Analysis Time Frame 4 Hours
Hello Traders
Update of Bitcoin 4-hour analysis, which I will post below
According to the description of the relevant post, in 4 hours the price was able to stabilize below 111,000 and its first pullback reached this level and made a significant profit, and in the second time it is pulling back to the same level of 111,000, and the resistance of 112,000 is also important. I expect the correction to continue to low liquidity areas.
Link to previous post:
Gold Trend Analysis 4-Hour Time Frame
Hi Traders
The analysis for this week is ideal for me according to this flash move.
Since the daily candlestick closed as a doji and indecisive, we mark the high and low range of this daily candlestick and refer to the 15-minute time frame. Depending on whether the high or low breaks or breaks out, we enter the trade.
Considering the liquidity of 4050 and the remaining orders, the balance of 15 minutes, one hour and 4 hours, which are important numbers 4062, 4075 and 4090, the upward movement can be considered initially to hunt liquidity and attract orders in these ranges, and then continue the price correction until we have liquidities at the bottom of the price, including 3915 and 3886 ... Good luck

EURCAD | Liquidity Draw Toward HTF Order BlockPrice remains inside a higher-time-frame bullish structure and is now retracing into the 1.60–1.61 breaker block / BC correction zone — a logical refuel area before continuation.
Above, there’s an unmitigated HTF order block at 1.68–1.70 , likely the next draw on liquidity.
That zone should be mitigated before any true macro bearish shift.
Plan
Bias: short-term bullish continuation into 1.68–1.70
Entry: confirmation from the breaker around 1.60–1.61
Stop: below 1.576 (macro invalidation)
Target: 1.68–1.70 (HTF mitigation zone)
– After mitigation, watching for bearish structure to form
The correction still has business above — the HTF OB remains unmitigated.
Let’s see if EURCAD completes the move.

METISUSDT | Fractal BC–WCL ConfluencePrice is correcting into the 9.0–9.1 zone, where the yellow BC , pink WCL , and a clean breaker block all line up — strong confluence.
I’m expecting liquidity to sweep under the early reaction at the order block before reversing from the breaker.
Watching for confirmation inside that zone.
Stop : 8.745 (just below yellow B at 8.761 — structural invalidation)
Target : 10.10–10.40 (yellow C projection)
If price dips deeper first, it’s fine — that sweep would only strengthen the setup.
Below 8.761 , the whole idea’s off the table.

$btc idea for weekend big range to play ! BTC has big range bounce off at 0.78 fib level
1- bullish : if we can take one level of higher low around 111.7K and change this structure there is change we move higher from here likely sunday pump
2-bearish: if we have slow price action over weekend with slow bleed get below 108.4K we might sweep low of range or touch 0.786 level once again
what you think happen first ?

A high probability market structure scenario on EUR/USDBased on the Swing and Internal market structure I've identified some meaningful levels that:
1- play off the available liquidity above and below the last few days price action.
2- align with market structure principles and current demand zones (order block)
3- are easily measured based on the swing and internal structure.

GBPJPY – Targeting the Green WCL After BC RetracementPrice completed a clean green impulse and started a corrective red sequence.
The plan: wait for a retracement into the red BC zone, which overlaps a bearish order block. If price reacts from that region, I’ll ride the next leg down toward the red C target and the green wave’s Whole Correction Level (WCL).
However, note the developing bullish flag pattern — if price breaks above red B, that flag activates and the bearish setup becomes invalid. A breakout there could extend the larger bullish trend.
Strengths:
– BC retracement aligns with a strong order block.
– WCL and C-target overlap, creating a high-probability draw on liquidity.
– Clear invalidation above red B protects the setup.
Weaknesses:
– GBPJPY volatility could trigger premature sweeps.
– A confirmed flag breakout would fully invalidate this setup.
Narrative:
Trading the correction inside a possible flag — shorting structure, not emotion. If the flag fires, I’ll flip bias with it.

Bitcoin - Liquidity grab signals further downside!Bitcoin (BTC) is currently in a crucial phase within a broader consolidation structure. After a strong upward move, the price has encountered significant resistance and is showing signs of weakening buying pressure. On the daily chart, it is clear that the price has re-entered the triangle structure after a brief breakout above resistance.
Liquidity Grab
Around $116,000, a clear liquidity sweep can be observed. Above this level, many stop orders and short-position liquidity were clustered. After this liquidity was taken, the price reversed sharply downward — indicating that large market players likely used this move to take profits or open short positions.
Fake-Out from the Triangle Pattern
The breakout above the triangle structure turned out to be a fake-out. Instead of holding above the trendline for confirmation, the price quickly fell back within the formation. This indicates buyer weakness and strengthens the bearish scenario. A fake-out above a consolidation pattern often leads to a move in the opposite direction — toward the lower boundary of the structure.
Daily FVG
The current candle is positioned within an important daily Fair Value Gap (FVG). If the daily close remains as it is, this bullish FVG will convert into a bearish FVG, meaning the area will now act as resistance. This suggests that bears are taking control and further downward price action is likely.
Target
After an upward fake-out that collects liquidity, price often moves to the opposite side of the pattern. In this case, that would be the lower side of the triangle. A drop toward $103,000–$104,000 is therefore the most likely scenario. This zone aligns with previous structural support and can serve as a logical target area.
Conclusion
Bitcoin is showing clear signs of exhaustion near the top of the range. The liquidity grab and fake-out from the triangle reinforce the bearish outlook. With the daily FVG flipping bearish and bullish momentum fading, a move down toward the $103,000–$104,000 zone appears to be the most probable next step — unless BTC unexpectedly manages to close above the FVG.
-------------------------
Thanks for your support. If you enjoyed this analysis, make sure to follow me so you don't miss the next one. And if you found it helpful, feel free to drop a like 👍 and leave a comment 💬, I’d love to hear your thoughts!

GOLD (XAUUSD) | Smart Money Buy Setup from Demand Zone 📝 Description:
Gold is showing a potential reversal structure from the lower demand zone after a liquidity grab near $3,962.
The price is now reacting bullishly from the mitigation block and aiming toward the supply zone at $3,984–$4,019.
Trade Plan:
Entry: From $3,972–$3,975 demand zone (after liquidity sweep)
Stop-Loss: Below $3,962 (structure invalidation)
Target: $4,019 (supply zone / PDH area)
Bias: Bullish – expecting continuation toward previous highs
R:R: ~1:3 setup
If price cleanly breaks above $3,984, expect further continuation to $4,029 (Previous Day High).
A failure to hold above $3,962 would invalidate this bullish setup.

NZDJPY — Waiting for the Sweep Before the ImpulseThe market is setting its own stage.
The green ABC correction is approaching its final C-leg — right into a cluster of confluence: trendline support, an internal order block, and a liquidity pocket resting beneath the prior lows.
I’m waiting for that final sweep into the OB/trendline area before stepping in to ride the pink impulsive C-leg toward the upper channel and buyside liquidity zone near 88.6 – 88.8 .
The plan is simple:
– Let the algorithm complete its cleanup below.
– Watch for an MSS and fair-value-gap confirmation.
– Ride the next displacement toward the liquidity resting above.
Invalidation:
If price violates the order block decisively and structure fails to shift, the setup expires.
Strengths:
– Clear multi-timeframe wave alignment (green correction → pink impulse)
– Strong OB + trendline + liquidity sweep confluence
– High reward potential once the pink C-leg activates
Weaknesses:
– Early entries before sweep risk being trapped
– Yen volatility can disrupt lower-timeframe confirmations
Summary:
Patience before precision. I’m waiting for the sweep to finish — then decoding the next wave of chaos.

EURUSD | Bias Shift & QML Zone in FocusThe previous setup has been invalidated as the market showed a clear Change of Character (ChoCh), flipping the structure and order flow to bullish.
With that shift, my bias has now turned bullish, and I’ve marked the QML (Quasimodo Level) zone as my area of interest.
I’ll be waiting for price to tap into this zone and show confirmation before considering any execution.
Adaptability is part of discipline — the market evolves, and so should the bias.
⚠️ Disclaimer: This analysis is for educational purposes only. Always manage your risk and trade responsibly.

Liquidity Sweep For NEE? For NEE (NextEra Energy), a bearish liquidity sweep occurred when price pushed above a recent swing high, triggering buy stops and drawing in breakout traders. This move was quickly rejected, with price closing back below that high — a sign that larger players used the liquidity to fill short positions. The sharp rejection shows that buy-side liquidity was absorbed, shifting momentum back to the downside. In essence, NEE’s bearish liquidity sweep signals a potential reversal lower after trapping late buyers.

XLMUSD — Bullish Continuation Valid While Red B HoldsFrom the top-down view, XLM completed a deep corrective structure that bottomed inside the previous WCL (blue box). The current sequence builds a new bullish cycle , with the red ABC wave mapping cleanly against both structural and liquidity geometry.
Price reacted strongly from the red BC demand zone , producing a local yellow ABC micro-sequence. The setup anticipates continuation toward the upper WCL region (0.38 – 0.42) .
The re-entry area sits near the mid-trend retest—confirmation required via MSS + FVG displacement.
Invalidation:
This idea remains bullish until the red B low is broken . Violation of that pivot voids the wave count and resumes the broader correction.
Strengths: – Multi-timeframe alignment (macro + micro)
– BC demand reaction with displacement
– Defined invalidation under red B (lowest-risk logical stop)
Weaknesses:
– Correlation drag if majors retrace
– Shallow pullbacks may induce premature MSS signals
Summary:
Bulls control the rhythm while red B stands. Break B — and the music stops.

EURNZD potential for the upside.Currently taking long positions upon the retest of the 1h low that formed after retesting the 4h broken structure.Use proper risk management should you decide to join me.

GOLD (XAUUSD) – Liquidity Grab Setup | Buy-Side Sweep ScenarioGold is currently consolidating between $4,044 (PDL) and $4,113 (Buy-Side Liquidity Zone).
Price recently reacted from the demand zone near $4,044–$4,058, showing signs of bullish absorption.
The plan: a short-term liquidity sweep below $4,078, followed by a potential push toward $4,097–$4,113.
Key observations:
Buy-side liquidity resting above $4,097 and $4,113.
PDL ($4,044) and discount zone acting as a strong accumulation base.
Ideal scenario: Sweep of minor lows → structure shift → long entries targeting $4,113.
Watch for reaction near $4,068–$4,078 for confirmation.
Break below $4,044 invalidates the bullish setup.
📊 Bias: Short-Term Bullish (Intraday)

EURNZD| Confirmation in Key Discounted ZoneHigher timeframes show strong bullish structure, with recent highs already broken in previous weeks. Instead of remapping completely, we’ve refined previous markings and updated key levels to reflect the current flow.
Our focus remains on continuation from the higher timeframe perspective, with mid-timeframe structure carefully mapped and refined. Price is currently interacting with the lighter orange zone, roughly at the 50% equilibrium — a pivotal area where movement could go either way.
While a breach of the lower high on lower timeframes could occur, our preference is waiting for a deeper mitigation in the darker orange zone beneath the 50% equilibrium, ideally creating a spike for clean lower-timeframe confirmation.
Once we see that mitigation, we’ll monitor lower timeframe reactions to validate bullish continuation before taking entries. Until then, we remain disciplined: monitoring, following structure, and letting smart money lead the way.
Let’s keep going. 🔥

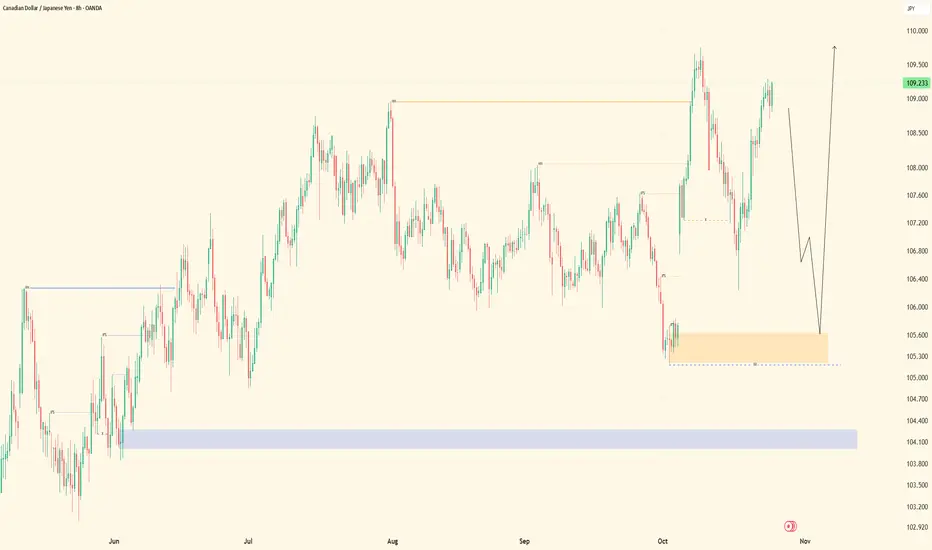
CADJPY| Bull Structure- Waiting for Deep Mitigation Higher timeframes show a strong bullish structure, refined and mapped to perfection. Our overall bias remains upward, but patience is key — we’re waiting for a deep drop into our order block zone beneath price before seeking precise entries.
On mid-timeframes, we’ve refined structure and order blocks, confirming where continuation opportunities may appear. Currently, price is dancing around premium areas, showing signs of consolidation and energy build-up.
If price decides to break significant highs to the left, we’ll follow price and monitor fresh liquidity generation, aiming to capitalize on the next leg higher. Until then, we take it step by step, letting price do its work without forcing predictions.
💡 Remember: Our job is not to predict the market, but to follow smart money and structure, letting price lead the direction.
Patience, discipline, and precision — that’s how we play the game.
Let’s go. 🔥
GBPAUD| Waiting for Deeper Mitigation Before Next Leg UpHigher timeframes show a strong bullish structure, and we’ve had some significant price spikes in the past — nothing to worry about. Our current focus is far right price action, where structure and order flow are aligning for continuation.
From the higher timeframe blue order block zone, we observed a sell-side liquidity sweep. Price respected structure, leaving no violations, confirming the presence of smart money activity.
Dropping into mid-timeframes, we caught a structural switch, breaking the prior lower high and signaling bullish intent. We are now waiting for a higher-low print within our order block — deeper mitigation is the next step before execution.
Patience is key: we’re letting price lead the way, following structure, and waiting for the proper alignment before taking entries. Smart money dictates the move, and we respect it.
Until then, we monitor, stay ready, and let the setup unfold naturally.
Let’s go. 💪🏽

EURGBP| Waiting on that One Proper Sweep Before the PushHigher timeframes continue to maintain a clean bullish structure, keeping the overall narrative to the upside. EURGBP remains one of my favorite pairs due to its precise reactions and consistent structure.
On the mid-timeframes, price delivered the continuation we were tracking — tapping into the first orange order block and holding that area with intent. Dropping down to lower timeframes, we confirmed a CHoCH and saw bullish momentum build, taking out prior highs before forming a new internal range.
Toward the far right of structure, price printed a minor internal lower high break, setting up the stage for a sell-side liquidity sweep. That sweep is currently in play, and we’ve already seen a weak mitigation from the prior order block area.
Right now, we’re waiting for a proper, deeper sweep of sell-side liquidity followed by confirmation — that’s when we’ll engage new buy points targeting fresh highs. Until then, patience is key: we continue to follow price, monitor behavior, and let smart money show intent.
Everything’s aligning — just waiting on delivery.
Let’s go. 🔥
