XAUUSD - Bullish Reversal Zone Forming Near 3945 | SMCGold (XAUUSD) is showing potential bullish signs after reacting from the previous day’s low at 3945.
Price tapped into the Fibonacci 0.5–0.618 retracement zone, aligning perfectly with demand imbalance on the 15-min timeframe.
Key Insights:
📉 Previous Day Low: 3945 acts as liquidity grab zone
🟨 Fib Confluence: 0.5–0.618 golden pocket
🔄 Expectation: Possible pullback → higher low → push toward 3990–4020
📈 Bullish confirmation above 3980
🚫 Invalid below 3940 (clean break of structure)
This setup aligns with Smart Money Concepts (SMC) — expecting a liquidity sweep + market structure shift before continuation.
Liquidity

Nzd/Usd - Bullish Reversal After Liquidity SweepLiquidity Sweep observed below the recent weak low, indicating a potential stop-hunt and smart money accumulation.
Break of Structure (BOS) and multiple Change of Character (CHoCH) signals suggest a shift from bearish to bullish market structure.
Price has shown a bullish CHoCH after the liquidity sweep, aligning with a potential trend reversal.
Entry:
Entry Zone: ~0.57462 (Marked with blue arrow)
Price has just broken above the minor range high, confirming bullish intent.
Targets:
TP1: ~0.57790 – Aligns with the nearest resistance zone.
TP2: ~0.58090 – Retest of a strong high and major resistance zone.
Stop Loss Suggestion:
Below the swept liquidity low, ideally under 0.57300 (weak low), to protect against a deeper pullback.
Key Concepts Highlighted:
CHoCH (Change of Character) – Shift from bearish to bullish trend.
BOS (Break of Structure) – Confirmation of direction change.
Liquidity Sweep – Possible smart money move to trap sellers.
Resistance Zones – Marked areas for potential profit-taking.
Bullish Bias Justification:
Price action has swept liquidity, formed a higher low, and broken previous lower highs.
CHoCH confirms shift in momentum; likely targets are previous supply zones (TP1 & TP2).
Favoring long setups while structure remains bullish above weak low.

Result - Using Order Blocks to Predict Bitcoins MovementHere is the result from our first practical demonstration of the effectiveness of using order blocks (stop loss orders) and liquidity analysis to predict price movement on BTC.
Both the upwards movement and downward moment was able to be predicted with absolute accuracy.
I hope this result serves as proof for my thesis:
What moves Bitcoin is Stop Loss and Liquidation orders, which can be analyzed by looking back at open candles and length of consolidation to predict speed.
And
There is no market manipulation other than price being CONTROLLED to attract positions to be opened and consequently stop loss orders. Fast, sudden movements are a natural phenomenon caused by traders stop losses triggering into one another. Traders manipulate themselves.
I have applied this to two more examples on the higher time frames. And as those complete they will be reviewed.
PLEASE SEE ORIGINAL IDEA LINKED BELOW AS WELL AS OTHER PLANS AND IDEAS RELATED.
Any questions please comment below.
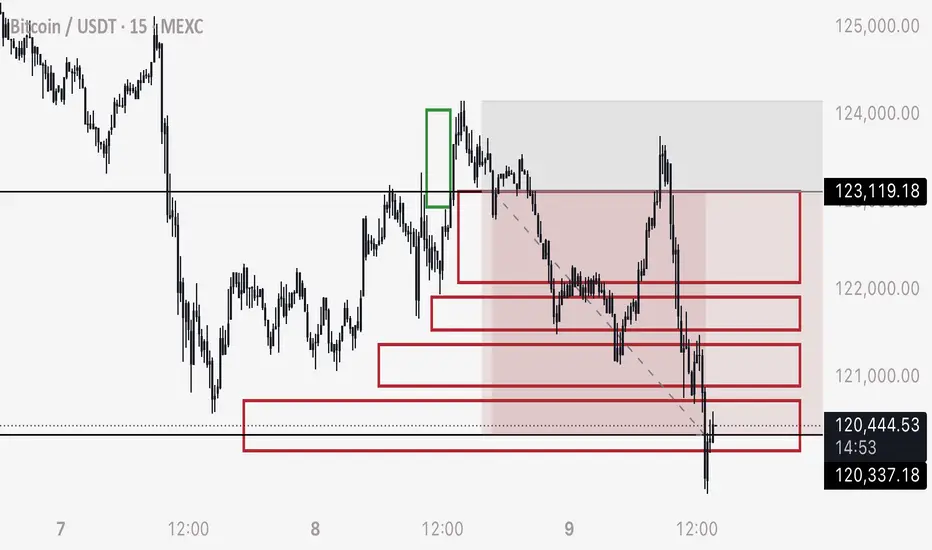
BTC Upside target move possible for monday closeLook for a buy position in BTCUSD from 0.5 level or 122565 level after 3 PM EST New York time
TP-1 123,780
TP-2 124,589
TP-3 126 208
THIS IS NOT A TRADE ADVISE. JUST FOR LEARNING PURPOSES
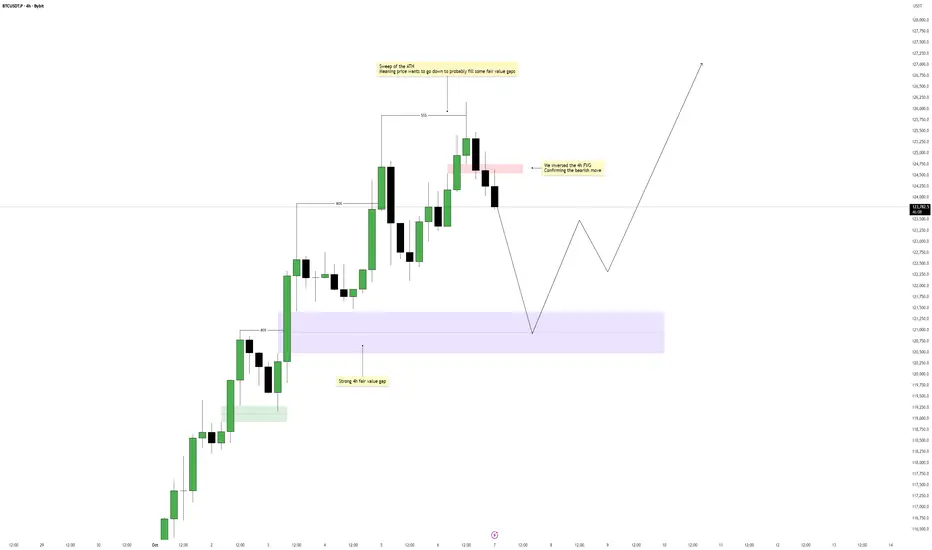
Bitcoin – Short-Term Weakness, Long-Term StrengthBitcoin has recently swept the all-time high, triggering a short-term reaction from liquidity resting above that level. This move often signals that the market has completed its buy-side run and is now seeking to rebalance inefficiencies created during the aggressive push upward. The current structure indicates that price is shifting momentum in the short term, preparing for a deeper retracement before resuming its bullish trajectory.
Imbalance and Structure Shift
Following the liquidity sweep, a clear 4-hour imbalance (IFVG) has formed, acting as the first sign of bearish pressure entering the market. This inefficiency shows that the prior move lacked sufficient counter-orders, meaning price may need to return there to restore balance. The bearish move was further confirmed as price inverted a smaller 4-hour FVG, signaling a potential continuation to the downside in the short term.
Bearish Scenario
If the market continues to respect the newly formed IFVG, we could see a sustained bearish retracement develop. Price may use this imbalance as a draw, seeking to fill deeper inefficiencies left behind during the prior expansion. This corrective phase is not necessarily a trend reversal but rather a short-term redistribution phase before buyers potentially step back in from lower levels.
Bullish Scenario
Once the 4-hour fair value gap below is filled, the market could begin forming a base for a new bullish leg. The liquidity collected from the downside move and the rebalancing of inefficiencies would give price enough fuel for a strong continuation higher. Traders should look for a clean market structure shift or displacement from that demand area as the signal of renewed bullish intent.
Expectations and Outlook
In summary, Bitcoin appears to be in a healthy retracement phase after sweeping liquidity at the highs. The 4-hour imbalance provides a clear short-term target for price to seek, and once filled, the bullish structure could resume. This setup favors patience, waiting for confirmation that the downside rebalancing is complete before anticipating another impulsive rally.
Conclusion
Overall, Bitcoin’s structure suggests a temporary bearish move to fill the 4-hour FVG, followed by a potential bullish continuation once that inefficiency is resolved. Watching how price reacts upon entering that zone will be key in determining whether the next expansion phase begins.
___________________________________
Thanks for your support!
If you found this idea helpful or learned something new, drop a like 👍 and leave a comment, I’d love to hear your thoughts! 🚀
BTC Will Flash Crash to 35,000 / 8,000 - This is the Theory I’ve been seeing a lot of comments on my posts about this, discreting the idea, or claiming there’s no reasoning behind it. Here I will dive deeper into the WHY by presenting this on the weekly time frame.
In recent times, we have witnessed many times on a small scale what happens after we see a slow, downwards consolidation and price movement.
On the way days as shorts are accumulated, they leave a trail above the price that contains buy orders that don’t automatically fill if price is below. These buy orders are short stop loss orders and short liquidation orders.
As Bitcoin moves down, the price will then slowly begin to rise. Sooner or later, there is a high volume candle on the minute time frame pushing price up - into the series of short position buy orders.
What follows is a very fast upwards candle as these buy orders are filled and the shorts are stopped out, liquidated, and traders enter longs.
Think of this as a replacement of positions. The market makers use the traders own decisions, to get themselves into the positions they want to be in. They cannot make those choices, but they can manipulate and entice traders to make the wrong decision.
Market makers who allow traders liquidity to take leveraged positions, they want their money back and to an extreme lesser degree, don’t want you taking profit in a winning trade. Hence, we see these very fast moves occur, which were once known as “stop hunts”.
These stop hunt candles, extreme, fast price movements that liquidate and stop out trades by nature, can be understood by chart analysis.
If you read disclaimers for the heat map platforms (IE Coinglass), you’ll see that these are only predictions, and not based on real data. The only accurate way of understanding where these hidden orders are, is by chart analysis.
On my chart are red boxes. These red boxes are drawn from the upwards consolidation zones, where price never came down to reclaim the liquidity from. These zones are filled with long position sell orders that don’t automatically fill when price is above.
You can imagine a ladder of sell orders, one after the next, all the way down through the boxes.
Now you may think, how can Bitcoin lose all that value if we drop to 8,000 when there’s ETF’s, Strategy, Holders, etc?
The answer is - the majority of Bitcoins market cap, including companies like Strategy who leverage, is all liquidity used for leveraging and trading derivatives.
It is liquidity supplied by market makers and exchanges, and has no bias towards price going up or down. It’s liquidity that’s fluid, moves in and out, and while you may think that bitcoin would “lose” all the value if it drops to 8,000 momentarily - you must think of it another way.
Bitcoin is a balloon of dollars. The dollars doesn’t affect the function of what Bitcoin does. People from all over use their money to inflate that balloon, and a liquidation event such as a stop loss, then deflates that balloon and transfers the wealth into very few pockets.
The balloon is then quickly re-inflated by the liquidity that’s first deflated, and becomes inflated again by the long orders placed and the shorts stopped out or liquidated.
It’s highly likely the “floor price” of bitcoin is $8,000 - the amount of bitcoin held in stable sources divided by the dispersed amount of bitcoin on the market.
The rest is leveraging liquidity, that is simply a function of inflating and deflating, moving in and out and accommodating orders of both directions - or in other words, the “ gambling industry” within Bitcoin.
Now, TECHNICALLY SPEAKING
We have 2 key trendlines to show.
The first is an ascending channel, that starts at the 8,000 zone. Price consolidated around it all throughout the chart.
Duplicating this trendline we can find a channel, and I show that as the lower red ascending line. This is the main support and resistance we have to understand.
The second trendline is shown in grey. This is again a bearish trend that Bitcoin has been consolidating around since its bottom.
This trendline breakdown takes Bitcoin to 35,000.
If price drops from current level to 35,000 - we can measure the downwards movement, place that measurement from 8,000 - and see that we would form a bear pennant type pattern, rise back up to the RETEST OF THE BOTTOM RED CHANNEL LINE, and then fulfill the measurement of the downwards move all the way to 8,000.
Technically speaking, we can use pattern prediction and support resistance levels to serve as confluence for the liquidity levels and the mechanics of this drop.
So there we have the MECHANICS and TECHNICALS
Additionally about the mechanics or the HOW… the more times Bitcoin doesn’t drop down, moves up - the more of those sell orders are accumulated.
The more TIME Bitcoin spends doing this, and the more AMOUNT of times Bitcoin wicks up like this - this means the FASTER and MORE POWERFUL the drop will be as a consequence.
This is very simply because of the amount of sell orders accumulated in the chart. The more sell orders there are, and the greater the quantity of Bitcoin ordered to be sold, the faster price will drop down.
So in theory, these drops will be the fastest movements we’ve ever seen in bitcoins history.
It’s quite literally a chart filled with rocket fuel and propellant, and all it takes is a fuse to be lit.
Thank you

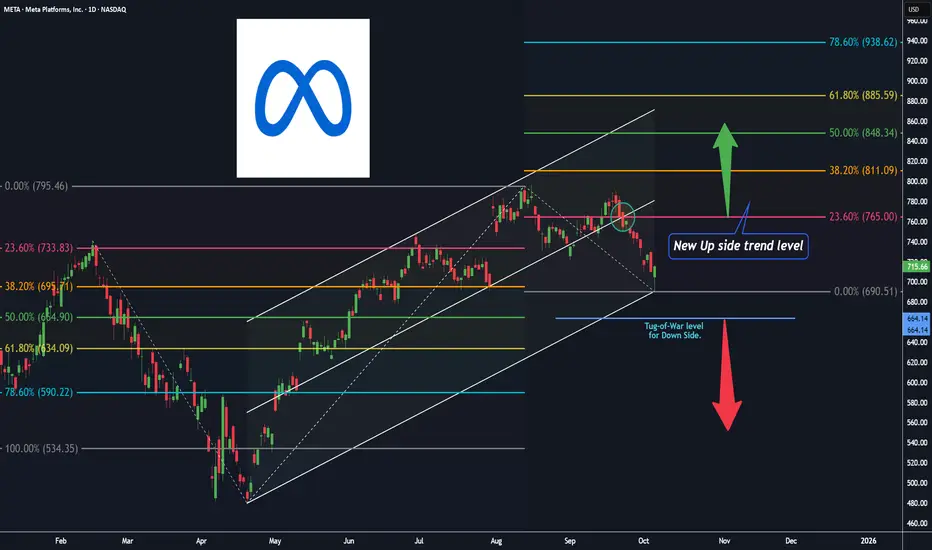
Meta platforms, D ( Channel + 2 Fibonacci Extensions up & down )Hey Traders and Investors, I hope you all are doing well in your life.
market is nature's response and Price is the God .
Let's check the market with the help of natural levels tool : Trend Based Fibonacci Extension in addition with Trend Channel .
After forming almost a ' Head and Shoulders ' pattern on Daily chart, Meta platforms has given a pull-back ( base for Fib-Extension UP level tool on the right side , $690.51 ).
The Pull-back trend expect to continue till the retest level of 23.6% ( $765 ) of Fib-Extension UP level tool on the right side .
The most near level for the re-test is the 50% level ( $664.14 ) of Fib-Extension Down level tool on the left side , for a new UP trend Entry ( investors ).
Note: The marked Circle ⭕ enclosed candle is the important level candle, Up Trend channel's 50% trend line is intersecting with 23.6% of Fib-Extension UP level tool on the right side .
Keep on checking this Level for your future trading decisions.
" Buy 🟢 "above $731 with the stop loss🔻of $690 for the
🎯 Target 1: $765
🎯 Target 2: $811
🎯 Target 3: open.
" Sell 🔴 " below $664 with the stop loss🔺of $690 for the
🎯 Target 1: $634
🎯 Target 2: $590
🎯 Target 3: open.
Smart Levels is Smart Trading 👨🎓
⚠ RISK DISCLAIMER :
All content provided by "TradeWithKeshhav" is for information & educational purposes only.
It does not constitute any financial advice or a solicitation to buy or sell any securities of any type. All investments / trading involve risks. Past performance does not guarantee future results / returns.
Always do your own analysis before taking any trade.
Regards :
Team @TradeWithKeshhav
Happy Trading and Investing!
GBPCHF Bullish
HTF: Still showing bearish structure overall, but price is climbing toward major supply zones.
MTF: Watching bullish movements pushing into that higher supply. Price has mitigated a bullish order block and cleared out courtyard liquidity that had been building up — showing intent from smart money footprints.
LTF: Now waiting for multiple confirmations on lower scales to validate continuation upward. Until then, we stay patient and follow the flow. 🧭

CADJPY | BullishHTF: Strong bullish momentum continues, with price maintaining higher highs and clear upside intent. Looking to catch the continuation ride, so focus shifts to mid timeframes to see if key areas hold.
MTF: Price swept sell-side liquidity and delivered a deep mitigation into a key OB zone. Another layer of confirmation is needed for the zone to solidify — once that happens, attention shifts to the LTF for precise confirmation.
LTF: When price taps the point of interest, I’ll wait for the final LH flip followed by a pullback into discounted areas to take long positions along the bullish leg — targeting 5M, 30M, and potentially 2H or 4H highs depending on market delivery. 📦
Patience until alignment — precision entries only when the story completes. ⚔️

AUDJPY | BullishHTF: Major highs have been broken, showing strong bullish momentum and confirming overall continuation intent.
MTF: Price continues within bullish flow. After taking sell-side liquidity and mitigating an order block, I’m now watching for MTF CHoCH alignment. Once internal draw-on-liquidity (IDM) is cleared and a deeper reaction forms, I’ll shift focus to LTF for precision confirmation.
LTF: When price taps the OB and drops toward lower intervals, I’ll look for a lower-high break and pullback to identify buy points within the bullish leg. Until then, we stay patient and follow smart money. 🧭

AUDJPY | BullishHTF: Price remains bullish, consistently breaking previous highs. After taking out sell-side liquidity (SSL), price retraced into a major order block, showing intent for continuation to the upside.
MTF: A clear CHoCH formed after price took out the major lower high (LH), followed by another SSL sweep before mitigating the mid-level OB — confirming higher-timeframe alignment.
LTF: Execution phase in play. All timeframes have now confirmed top-down structure, with price reacting from refined OB zones. Preparing for a bullish strike toward internal and external highs.

NZDJPY | BullishHTF: Strong bullish momentum with significant highs broken, confirming clear continuation intent.
MTF: Waiting for price to mitigate a key order block after the liquidity sweep. A confirmed CHoCH here is 🔑 — it will validate continuation from the higher timeframe.
LTF: Once mitigation occurs within the higher-timeframe OB, I’ll wait for another CHoCH on tap to finalize entry execution.
Patience is key — timing the confirmation is what separates precision from impulse. ⚔️

AUDCAD | BullishHTF: Price showing clear bullish intent, breaking significant highs and maintaining structure to the upside.
MTF: Currently seeking sell-side liquidity to be taken before the next leg. Once that liquidity sweep completes and internal structure is mitigated, attention shifts to lower timeframes for refined confirmations and entries.
Until then, patience — this is my money lead direction. 🧭

USDCHF| Bearish
HTF: Major lows have been broken, confirming strong bearish intent and signaling continuation within the downtrend.
MTF: Waiting for price to pull back into an order block in alignment with overall order flow. Once mitigation occurs, I drop lower to further confirm the reaction zone.
LTF: After price breaks a higher low (HL) and corrects into premium pricing, I execute short positions within the bearish leg, targeting continuation toward new lows.
Patience during confirmation sharpens precision on execution.”

EURGBP |BullishHTF: Bullish structure printed beautifully across all major timeframes — clean, refined, and aligned for continuation.
MTF: Price has gone through multiple confirmation stages, syncing perfectly with higher-timeframe intent. Now waiting for the final touch — once price taps into the 30M OB, I’ll drop lower to confirm on LTF before executing.
Until then, staying in patience mode — precision only comes when every layer aligns. ⚔️

GBP/JPY - Bullish 2H OB Play | 5M CHoch Reaction Setup
Pair: GBP/JPY
Bias: Bullish
Timeframes: 2H → 5M
⸻
HTF Overview
Higher timeframe broke previous major highs, showing clear bullish intent and continuation flow.
Smart money has confirmed direction to the upside — now we’re aligned with the institutional leg. ⚙️
⸻
MTF Structure
Refined structure mapped out with precision.
Spotted the courtyard buildup forming before the drop into my 2H order block — a clean delivery confirming controlled mitigation.
Momentum aligns perfectly with higher timeframe intent.
⸻
LTF Execution
On lower timeframes, we’ve already printed a clean CHoCH, signaling early reversal confirmation.
Now I’m patiently watching for a sell-side liquidity sweep (SSL) to mitigate the bullish block, opening long positions within that bullish leg.
Execution will depend on reaction strength and order block respect. 🎯
⸻
Mindset Note:
Don’t rush the entry. The deeper the sweep, the stronger the move.
Precision + patience = premium entry. 📦

EUR/USD - Bullish 2H OB Reaction | 5M continuation SetupPair: EUR/USD
Bias: Bullish
Timeframes: 2H → 5M
⸻
HTF Overview
Higher-timeframe structure remains bullish, with major highs recently broken — confirming continuation flow.
Price has now mitigated our 2H order block, aligning with overall bullish intent. From here, I’m looking for further upside continuation toward next liquidity highs.
⸻
MTF Perspective
On the mid-timeframes, price tapped directly into our OB zone and instantly showed strong bullish momentum, signaling institutional interest.
Now it’s about staying patient and letting price dictate whether we’ll get a clean retest or a deeper mitigation before expansion.
⸻
LTF Execution Plan
On the lower timeframe, recent internal structure has already been mitigated — price may look to retest that same level or sweep slightly lower before taking off.
Either scenario, I’m focused on targeting 5M highs and 2H continuation zones depending on market delivery.
⸻
Mindset Note:
Don’t overthink the pullbacks — once HTF alignment and mitigation are confirmed, trust the process and execute smoothly. Reaction confirms direction; mitigation defines precision.

$BTC Bearish Divergence Signals Possible Correction Toward 118KBitcoin on the 4-hour chart is flashing a clear bearish divergence — while price is forming a higher high, RSI is slipping into a lower high. 📉
This setup often hints at an upcoming correction phase. Based on the current market structure, 118K appears to be a strong liquidity gap area where a short-term bounce or lower high could form.
However, if BTC loses its footing below 107K, that’s where the real bearish confirmation kicks in. Until then, the 107K support remains the key battleground for bulls to defend. ⚔️
Volume analysis also supports the correction narrative — buying pressure is fading while selling momentum is picking up. Stay alert for a possible test near 118K before the next major move.
#Bitcoin #BTCAnalysis

Cable$FibreIn the past few days we've seen a bearish momentum on cable and fibre. This is my opinion will continue to be the case in he coming weeks. This week however, the market is retracing, to take out those who're currently profitable. The first week of the month is relatively unpredictable so I'd advice you to sit back and relax, unless you know what you're doing. From next week, I expect to see price resume its bearish stance.

BTC — Sunday Liquidity TrapAfter hitting the BIG resistance at $117,896 (0.618 Fib retracement), BTC rejected as anticipated and started its current downtrend. The anchored VWAP from the $117.9K high has been an excellent guide, acting as resistance → most recently at $113,800, where it provided a clean short entry.
Over the weekend, BTC has traded sideways. We just saw a small pump to clear the range highs and take out buy-side liquidity, a common setup before markets rotate lower to sweep sell-side liquidity.
Key Confluence Zone
The next level of interest sits around $108,250, where multiple factors align:
Monthly Open: $108,246.36
Daily Level: $108,246.35
0.618 Fib Retracement: $108,236.67
Liquidity cluster with many stop-losses residing here
If this zone fails to hold, the next downside interest lies at:
Key Low: $107,255 → possible SFP area
0.666 Fib Retracement: $106,975.52 → additional support
🟢 Long Trade Setup
Entry: Long around $108,250 (mOpen confluence zone)
Stop-Loss: Below 0.666 Fib retracement (~$106,975)
Take Profit: TP1 → $111K, if volume expands → trail stop for higher targets
R:R: ~1:2
Market Insight
Sunday pumps are notoriously unreliable, often designed to trap traders into late longs before a pullback wipes them out. This setup reflects exactly that dynamic.
Indicators used
DriftLine — Pivot Open Zones → For identifying key yearly/monthly/weekly/daily opens that act as major S/R reference points
➡️ Available for free. You can find it on my profile under “Scripts” and apply it directly to your charts for extra confluence when planning your trades.
_________________________________
💬 If you found this helpful, drop a like and comment!

US30 -Bullish Bias🔹 Pair: US30
🔹 HTF Overview: Structure bullish; market momentum favors the upside.
🔹 MTF Outlook: Waiting for a deep sweep of stop-losses (SSL) to refine continuation setup.
🔹 LTF Setup: Once SSL is taken, drop to lower timeframe for CHoCH confirmation and precise entries.
🔹 Targets: Mid- to long-term highs, aligned with bullish structure and liquidity zones.
🔹 Mindset Note: Patience is key—let smart money lead before committing.

EURJPY - Bullish Bias🔹 Pair: EURJPY
🔹 HTF Overview: Price structure bullish, though prints not perfectly clean. Monitoring carefully.
🔹 MTF Outlook: Waiting for sweep of stop-losses (SSL) into the midterm OB area to refine continuation setup.
🔹 LTF Setup: Once MTF sweep occurs, will drop to lower timeframe for proper alignment and entries.
🔹 Targets: Midterm liquidity pools and highs above recent structure.
🔹 Mindset Note: Patience is critical—wait for smart money confirmation before committing.

GBPJPY - Bullish Bias🔹 Pair: GBPJPY
🔹 HTF Overview: Price has been respecting structure cleanly across all timeframes. Bullish bias intact.
🔹 MTF Outlook: Continuation plays forming toward midterm highs. Momentum aligned with HTF structure.
🔹 LTF Setup: Watching for lower-timeframe alignment to refine entries in line with continuation moves.
🔹 Targets: Midterm highs and liquidity above recent structure.
🔹 Mindset Note: Let structure and smart money lead—patience ensures optimal entries.
