XAUUSD Bearish Setup! OB Rejection + FVG + 61.8% Fib PremiumGold (XAUUSD) | 4H Chart – High-Probability Bearish Setup
XAUUSD is setting up for a bearish move as price taps into a premium zone confluence, including an Order Block (OB), Fair Value Gap (FVG), and a 61.8% Fibonacci retracement. Smart Money Concepts (SMC) traders will recognize this setup as a textbook scenario for a bearish continuation toward a Weak Low target.
🔍 SMC Breakdown:
Market Structure:
The market has shifted bearish after breaking the previous low and forming a lower high. The internal structure confirms bearish order flow, giving us confidence in continuation to the downside.
Liquidity & Inefficiency Play:
Recent sweep of buy-side liquidity above minor highs.
Rejection at premium pricing indicates Smart Money has triggered sell programs.
Internal liquidity pools were engineered and swept, confirming manipulation.
Entry Confluence Zone (Kill Zone):
🔴 Order Block (OB):
3,372 – 3,380 — bearish OB formed before strong impulse move.
🟣 Fair Value Gap (FVG):
Perfect overlap with the OB, leaving a gap that price has now rebalanced into.
📐 Fibonacci Levels from Swing Low to High:
61.8% = 3,373
70.5% = 3,377
79% = 3,380
This entire zone aligns with institutional premium pricing — the high-probability reversal range.
📉 Bearish Projection:
Expecting price to reject from OB/FVG zone and move toward the discount zone, targeting unmitigated lows and imbalance fills.
Key Downside Targets:
50% = 3,368
Full Extension = 3,333 (Aligned with Weak Low)
This level also sits near the 0.00% Fib level — a clean liquidity magnet.
🧠 Chart Ninja Entry Plan:
🔹 Entry: 3,373 – 3,380 (OB + FVG + Fib Premium)
🔻 Stop Loss: Above 3,381 (invalidate OB)
📉 Take Profit: 3,333 (Weak Low + Fib Completion)
⚖ RRR: ~1:4+ — high-confluence sniper setup
💬 Ninja Wisdom:
You're not trading random candles — you're trading intentional liquidity shifts.
This setup screams Smart Money footprint: OB rejection + inefficiency fill + premium pricing.
Be the sniper — not the trigger-happy retail trader. 🥷🎯
📍 Save this setup before it plays out — backtest and learn from it!
🔁 Drop your analysis below – agree or see it differently?
👣 Follow @ChartNinjas88 for daily institutional-grade setups on Gold & more!
Liquiditysweep

USDJPY Pullback? Watch OB + Fib Confluence for the Next Buy WaveUSDJPY | 30-Min Chart – Smart Money Buy Setup in Progress
After a sharp bullish rally, USDJPY is setting up for a classic retracement buy scenario. We're now watching a key confluence zone between Fibonacci levels, a bullish order block, and internal trend structure — all lining up for a high-probability long setup.
🔍 Trade Breakdown:
📉 Pullback Expected Before Next Rally:
Price rejected near short-term resistance and is retracing from local highs.
Retracement aligns with key OB + 61.8–79% Fib zone = institutional entry zone.
🟣 Order Block (OB) Demand Zone: 143.086 – 142.828
Last bullish candle before explosive rally = demand OB.
OB sits within premium Fib retracement = Smart Money buy zone.
📐 Fibonacci Levels (Swing Low to High):
61.8% ≈ 143.200
70.5% ≈ 143.000
79% ≈ 142.828
This is the kill zone for institutional longs — where Smart Money typically enters before expansion.
🔵 Projected Play:
Retracement to OB/Fib confluence.
Bullish rejection from OB zone.
Impulse move targeting previous highs and beyond.
💡 Target Level: 144.396 (sits just above prior high and aligns with -27% Fib extension)
📉 Current Bias:
Short-term retracement ➝ Mid-term bullish continuation
Expecting price to dip into OB then launch.
🧠 Chart Ninja Entry Plan:
🔹 Entry Zone: 143.086 – 142.828
🔻 SL Below: 142.650 (below OB/Fib + structure wick)
📈 Target: 144.396
⚖️ RRR: 1:3+ — high confluence risk-managed buy
🔍 Technical Confluence Checklist:
✅ OB demand zone
✅ 61.8–79% retracement
✅ Bullish market structure
✅ Internal channel support
✅ Momentum slow before entry
📍 Save this chart — don’t chase, let price come to you
💬 Comment if you're watching this OB too
👣 Follow @ChartNinjas88 for precision-based setups daily

GBPUSD Buy Setup! BoS + OB + 61.8–79% Fib + Trend Channel ComboGBPUSD | 30-Min Chart – High Probability Long Setup Identified
GBPUSD is showing bullish intent after a clear Break of Structure (BoS) and now offers a high-confluence buy opportunity. This setup combines Smart Money Concepts with classical technical analysis for a sniper-grade entry.
🔍 Trade Breakdown:
📈 Break of Structure (BoS):
Price broke previous highs with strong bullish momentum.
Confirmed market intent shift from ranging to bullish.
📐 Fibonacci Confluence:
Price retraced perfectly into the 61.8% – 79% Fib zone from the latest bullish impulse.
These golden ratio levels align with an institutional Order Block (OB) and ascending trendline — high confluence entry.
🟣 Order Block Zone (OB): 1.35285 – 1.35406
The last bearish candle before bullish BoS — a clean demand zone.
OB sits within the Fib retracement zone and overlaps a mid-trendline tap.
📐 Fibonacci Levels (Swing Low to High):
61.8% = 1.35285
70.5% = ~1.35190
79% = ~1.35075
This is the institutional kill zone — OB + 61.8–79% retracement = precision buy levels.
🟡 Liquidity Sweep + Reaction:
Price swept liquidity below short-term lows and tapped the OB with a sharp bullish reaction.
Candle confirmation + lower wick shows strong rejection from Smart Money.
🧭 Projected Move:
Targeting a move toward the -27% Fib extension at 1.36018
Trendline and internal structure support bullish continuation
🔵 Projected Path:
Sweep ➝ OB/Fib confluence tap ➝ strong bullish continuation into premium territory
🧠 Chart Ninja Entry Plan:
🔹 Entry Zone: 1.35285 – 1.35406 (OB + 61.8–70.5% Fib)
🔻 SL Below: 1.35000 (beneath OB & key structure low)
📈 Target: 1.36018 (-27% Fib extension)
⚖️ RRR: 1:3+ — sniper entry with institutional precision
💬 Ninja Wisdom:
Smart Money isn’t buying breakouts — they buy retracements into OB zones with precision.
Combine OB + Fib + channel = institutional roadmap.
Let price come to you. Let retail chase. 🥷💸
📍 Save this GBPUSD setup before it hits the next impulse wave
🗣️ Drop your thoughts – are you buying this OB too?
👣 Follow @ChartNinjas88 for more institutional-grade setups daily
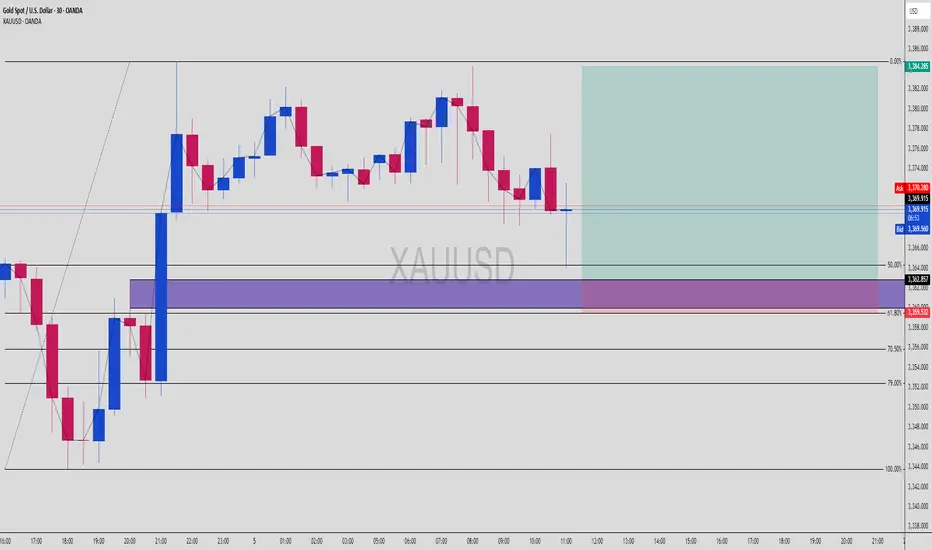
XAUUSD Reversal Zone Hit? OB + 61.8% Fib Tap In Progress!Gold (XAUUSD) | 30-Min Buy Setup – Smart Money Discount Reversal in Motion
We’ve got price doing exactly what Smart Money traders expect:
Impulse up → Pullback → Tap into OB inside discount → Launch 🚀
🔍 Breakdown:
Market Context:
Strong bullish impulse leg broke previous highs — a confirmed market structure shift
Pullback is targeting the refined Order Block + multiple fib confluences
Eyeing continuation toward 3,384.285 as main target
Key Confluences:
✅ OB Zone (purple): ~3,362.857
✅ Fib Levels:
50% = 3,364.000
61.8% = 3,359.532
70.5% = 3,356.000
79% = 3,352.000
✅ Perfect Entry Reaction: Price is starting to show a wick & stall around OB top edge (3,362)
Smart Money Entry Logic:
Price dropped from a recent high into a clean imbalance + OB area
Liquidity sweep below recent lows is setting up the reversal
Discount levels = ideal entry zone for institutional re-accumulation
Execution Plan:
Watch for M5–M15 confirmation:
Bullish engulfing or BOS inside the OB zone
Entry: Limit in OB or aggressive confirmation candle
SL: Below 3,352 (beneath 79% + OB bottom)
TP: 3,384 = last swing high
✅ RRR = 1:3+ — sniper-approved 😎
🎯 Game Plan Summary:
🔹 Entry Area 3,362.857 (OB top) → 3,356.000 (deep fib)
🔻 SL Zone Below 3,352
📈 Target 3,384.285 (premium high)
🧠 RRR Potential 1:3+ with structure & fib backing it up
💬 Pro Tip:
Let the market tap liquidity + react. No entry? No FOMO.
You don’t chase — you snipe from the OB treehouse. 🥷🎯
✅ Drop “Gold Ninja Setup” in the comments if you’re planning to catch this
📥 Save this chart — entries like this don’t show up every day
🚨 Follow @ChartNinjas88 for daily Smart Money sniper plays on XAUUSD & FX pairs
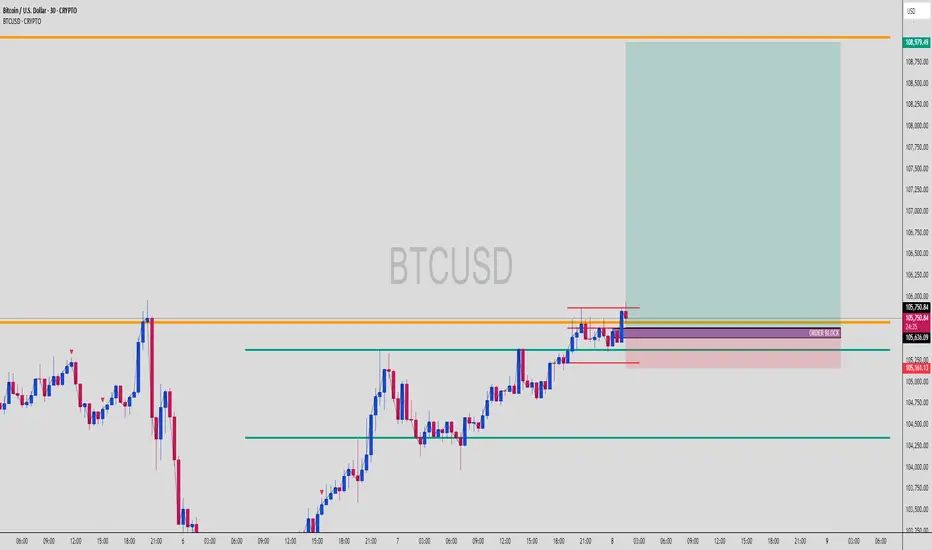
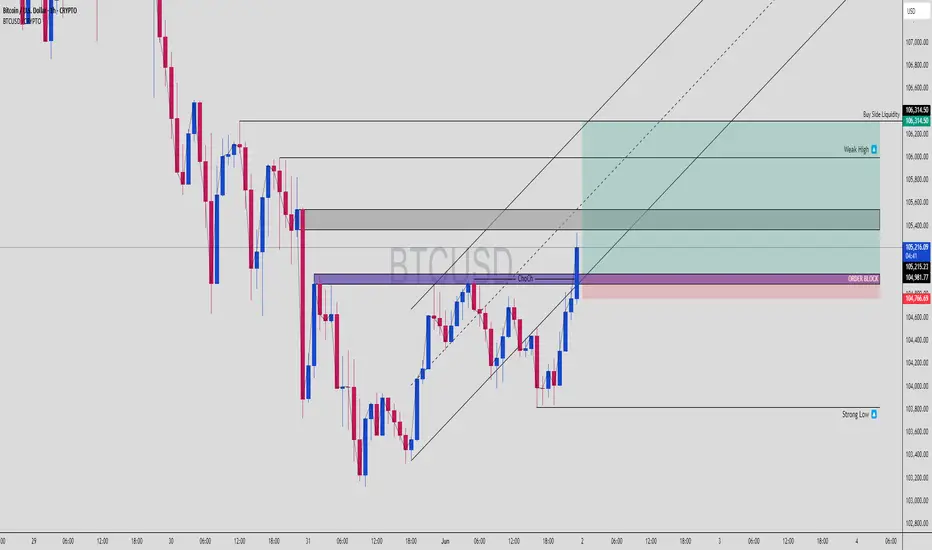
BTC Long Triggered from OB, Smart Money Played This Perfectly!BTCUSD | 30-Min Chart – Long Setup Execution
Bitcoin has just activated a clean long entry from a well-defined bullish Order Block at a key structural level. This move follows textbook Smart Money Concepts (SMC) — the kind of play institutional traders thrive on.
🔍 Setup Breakdown:
🔹 Order Block (OB):
Identified near 105,636 — aligned with previous support
Precise reaction zone after consolidation, showing institutional interest
OB respected after fakeout below short-term liquidity
🔸 Liquidity Sweep:
Quick wick below 105,250 acted as a stop hunt for early shorts
Price reclaimed the OB immediately after → classic Smart Money trap
🟩 Entry Zone (OB Zone):
105,636–105,250 range
Confluence with minor bullish imbalance and structure support
Price barely tapped the zone before launching higher
📈 Upside Target:
TP marked at 108,979 — prior liquidity pocket and untested highs
Large green zone shows ideal RR (approx. 1:6)
First obstacle: minor resistance at 106,750, but momentum looks strong
🟥 SL Placement:
Safely below OB at ~105,161
Below liquidity sweep zone = strong invalidation
🧠 Why This Setup Works:
✔ Price moved impulsively into the OB
✔ OB lines up with previous structure support
✔ Rejection + strong bullish candle = confirmation
✔ No significant resistance until higher liquidity zones (108K+)
This is classic SMC execution: trap, sweep, OB tap, and send. Let retail panic — we follow footprints.
💬 Ninja Wisdom:
"Smart Money doesn’t chase price — it traps and collects."
This was a clean confirmation of a bullish continuation after reclaiming control from liquidity grabs.
📍 Save this chart – this setup could explode into a full bullish swing
💬 Drop your thoughts: Are we headed to 109K or pausing at resistance?
👣 Follow @ChartNinjas88 for more sniper-level BTC/ETH/Gold plays
BTCUSD Rejection Brewing? OB + 79% Fib Tap Could Trigger Short!Bitcoin (BTCUSD) | 30-Min Sell Setup – Order Block + Deep Fib Confluence
This is a classic Smart Money short setup. Price swept lows, rebounded into premium pricing, and is now approaching a high-probability rejection zone — just the way institutional traders like it. 🧠💰
🔍 Breakdown:
Market Structure:
Recent move formed a lower low ➝ market structure is bearish
Current retracement is corrective, moving toward premium sell-side levels
Key Confluences:
🔴 Order Block (purple zone): ~105,200–105,300
🔴 Fib Confluence:
61.8% = 105,178
70.5% = 105,298
79% = 105,388
🔴 Price is tapping OB + 70.5–79% fib zone = sniper territory for shorts
Liquidity Perspective:
Earlier liquidity grab below 104,500 triggered this move
Now climbing back into premium pricing — potential trap before drop
Above the OB: resting liquidity + stop hunts expected
Execution Strategy:
✅ Entry confirmation: Look for M5–M15 bearish engulfing / BOS in OB zone
🎯 Entry area: 105,280–105,388 (limit or confirmation-based)
🛡 SL above 105,400 (above OB & 79%)
💰 TP zone: 104,500 (liquidity pool + fib 0%)
⚠️ Risk-to-Reward Ratio: 1:3+ potential — ideal for scalpers and intraday traders alike
🧠 Chart Ninja Notes:
You’re not chasing highs — you’re stalking where Smart Money sells to the crowd. This is premium pricing in a bearish leg, and BTC is approaching the kill zone. Patience = profit. 😤💸
📈 Game Plan Summary:
🔹 Entry Zone 105,280 – 105,388 (OB + 70.5–79% fib)
🔻 SL Zone Above 105,400
📉 Target 104,488 zone (fib 0%, equal lows)
🎯 RRR Potential 1:3+
💬 Pro Tip:
Wait for price to enter OB and stall before pulling the trigger.
The best trades happen after liquidity is swept — not before.
You’re not a retail trader. You’re a sniper. 🥷💥
📥 Save this setup & review it post-trade
🔁 Share your entry plan in the comments
⚡️ Follow @ChartNinjas88 for daily Smart Money BTC plays

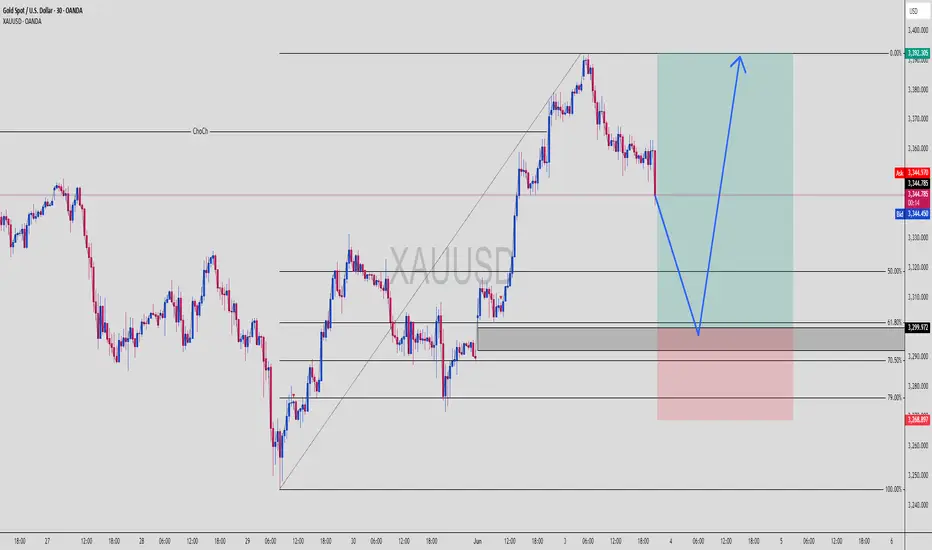
XAUUSD Golden Bounce? Discount OB Loading for LongXAUUSD | 30m Smart Money Buy Setup – Liquidity Sweep + Discount OB Combo
Gold’s about to act like… gold. 🤝
Price has pumped hard, and now we’re watching for a pullback into a premium discount zone — to trap sellers and give institutions their perfect entry.
Let’s break down this textbook Smart Money Concept setup:
📌 1. HTF Context:
Massive bullish impulse breaking old structure highs
Change of Character (ChoCh) confirmed — buyers are in control
Market is now retracing to rebalance inefficiencies + mitigate previous demand
📊 2. Key Levels:
🔻 Entry Zone (OB): Around 3,299.972
🔻 Deeper Discount (Fib 70.5–79%): 3,280.000 – 3,268.897
📈 TP1: Recent high – 3,392.305
🛡️ Stop Below: 3,268.897
🎯 RR Potential: 1:3+ – clean sniper shot
🧠 3. Smart Money Logic:
Price is pulling back into a refined OB zone inside discount territory
This zone overlaps with a clean FVG + 70.5% fib level
Price likely to tap into this zone, fake out sellers, then launch with momentum
🔁 4. Execution Plan:
✅ Wait for:
M5–M15 bullish BOS or engulfing candle inside the OB
Strong rejection wick off the refined OB/FVG
Entry confirmation = go long with tight SL
TP = HTF resistance / liquidity highs
Remember: Let price come to you. Don’t chase the setup. Be a sniper, not a machine gunner. 🎯
💡 5. Why This Long is Gold (Literally):
✅ Perfect structure flip (ChoCh)
✅ OB inside a clean discount zone
✅ Liquidity resting below = magnet before reversal
✅ Risk:Reward is beautiful
This isn’t just a bounce — this is a smart money rebalance play, and gold loves to respect these zones with explosive moves 💥
💬 Drop “XAU Bounce 🔥” in the comments if you’re watching this unfold
📥 Save this for future entries
📈 Follow @ChartNinjas88 for the sharpest Smart Money setups on Gold & Majors
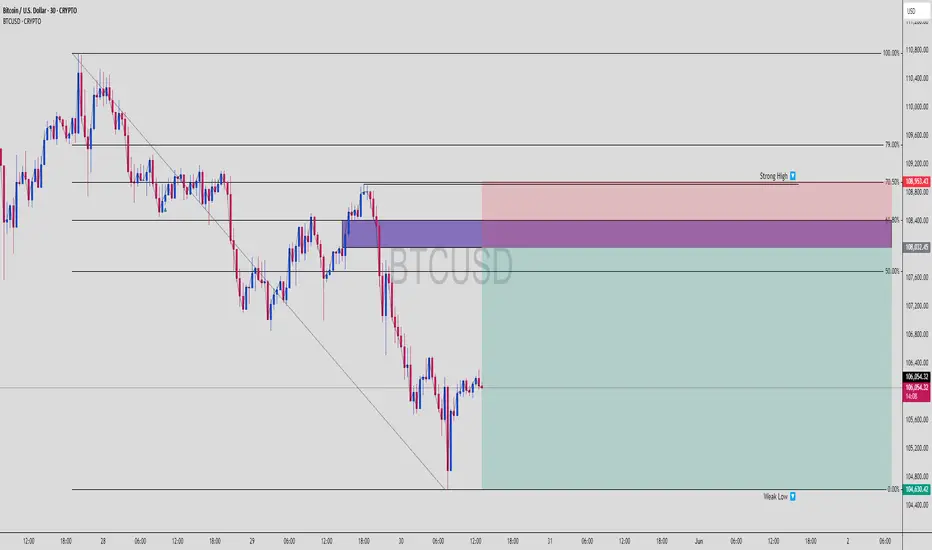
BTCUSD Bear Trap Loading – Premium OB Sell Setup ActivatedBTCUSD | 1H Smart Money Rejection Play – Premium Repricing Before Breakdown
The king of crypto is looking shaky. Smart money isn’t buying the pump. Here’s why BTCUSD might be gearing up for a steep dump from a premium order block reaction 🩸👇
📌 1. Market Context:
After a clean bearish leg, BTCUSD is now retracing into a premium zone — above the 70.5% Fib
Price is climbing into a high-probability reversal OB (highlighted in purple/red)
This area aligns with the 70.5%–79% golden retracement zone — where institutions love to load shorts 🧠📉
💎 2. Key Levels to Watch:
🔺 Premium OB Zone (Sell Zone): 108,378.95 – 109,276.15
🟣 Golden Rejection Zone: Fib 70.5% – 79%
🔽 Target Weak Low: 103,121.59
⛔ Invalidation/SL Above: 109,276.15
🎯 RR Potential: 1:4+ sniper-grade
Price is expected to tap this premium zone, sweep liquidity, and collapse into the weak low for a full market cycle completion 🔁
🧠 3. Smart Money Flow:
This move smells like a liquidity grab trap – taking out late longs before a drop
No bullish BOS from HTF – market structure still bearish
OB overlaps with inefficiency (FVG), making it ripe for rejection
Strong high is intact — unbroken = more confluence for downside
🎯 4. Execution Strategy (Entry Tips):
⚔ Wait for:
M5–M15 shift in structure (BOS) from bullish to bearish inside the OB
Sharp rejection wick or engulfing candle for confirmation
Ideal entry = wick entry near 109.2 with tight SL just above OB
Target = weak low for full mitigation and profit harvesting
This is surgical precision territory. The sniper must be patient before pulling the trigger 🥷
🔥 5. Why This Short is GOLD:
✅ OB + Fib + FVG confluence = high-odds reversal zone
✅ Price is in premium – not discount = perfect for shorts
✅ Weak low = magnet
✅ No bullish confirmation = no reason to long
This is not a guess — this is the blueprint for institutional execution 📐
📉 Drop “BTC Dump Mode 🚨” in the comments if you’re watching this setup too
🔁 Save this setup for your playbook
⚔ Follow @ChartNinjas88 for more institutional-level trade ideas like this one

BTCUSD Mind Mapping Analysis (MMC) + Structure Mapping + Target🕵️♂️ Introduction
Welcome traders! In today’s BTCUSD analysis, we dive deep into the Mind Mapping Concept (MMC) with curve-based support, smart money structure shifts, and mapped liquidity levels. This chart reveals how institutional players moved price through liquidity traps, accumulation zones, and major breakout points, culminating in a reversal zone.
This breakdown is ideal for traders using:
Smart money concepts (SMC)
Curve theory
Liquidity sweeps
Structure mapping
🔍 Detailed Breakdown of the Chart:
🔹 1. Ellipse Zone – Liquidity Trap Phase
The blue ellipse on the left shows a clear area of price compression and indecision.
This is where retail traders often enter prematurely, expecting reversal.
Smart money exploits these zones to collect liquidity — this is not yet a trend shift, but a trap.
You can observe multiple wicks and fakeouts, signaling manipulation and preparation for expansion.
🔹 2. Expanding Channel – Volatility Phase
Following the trap, price enters an expanding pattern (also known as a megaphone).
These structures indicate uncertain market behavior, often manipulated to clear both highs and lows.
Smart money uses this to exhaust both buyers and sellers before deciding the real trend direction.
🔹 3. Previous Target & SR Flip Zone
Price reaches the previous downside target, completing a downward liquidity move.
From here, the market forms a support-resistance flip (SR-Interchange) — a textbook zone for institutional entries.
Once this zone holds, it confirms that buyers are absorbing sell orders.
The curve starts forming, indicating deeper market structure realignment.
🔹 4. Black Curve – Mind Mapping Curve Support
One of the most important elements of MMC — the curve — acts as a psychological and algorithmic support line.
The curve captures the accumulation structure in a flowing manner.
Repeated touches and rejections confirm its strength.
As long as price respects the curve, the bullish momentum remains intact.
🔹 5. Breakout Confirmation
Price breaks through mid-range consolidation and hits Target 1.
This move confirms a shift in market sentiment from indecision to bullish control.
The breakout is supported by volume, structure alignment, and curve acceleration.
🔹 6. Major Breakout Zone
A major resistance line is broken — this marks a shift in macro structure.
At this point, we label the zone as “Major Breakout” — any retest of this can offer a high-RR entry.
🔹 7. Next Reversal Zone (Supply Zone)
Price is now inside the Next Reversal Zone, which is a potential supply area or liquidity magnet.
Institutional traders may use this zone for profit-taking or to initiate a deeper retracement.
Watch for rejection signs, such as long wicks, engulfing patterns, or volume divergence.
If this zone is absorbed (i.e., broken cleanly), expect another leg higher.
💡 MMC Summary (Flow Recap):
Trap → Expansion → Liquidity Target → SR Flip → Curve Accumulation → Breakout → Target Hit → Reversal Zone
Each stage reflects smart money behavior and follows the natural cycle of manipulation → accumulation → distribution.
📊 What to Watch Next?
Confirmation Rejection in Reversal Zone? Short entries could be valid with curve re-entries.
Bullish Continuation? A clean break above reversal zone = new weekly highs likely.
Retest of Curve? If price pulls back, watch for rejections on the curve for safer long positions.
🚨 Trade Tips Based on This Setup:
✅ Use multi-timeframe confluence (M30 + H1 or H4)
✅ Always mark out previous liquidity zones
✅ Place SL below the curve or zone rejections
✅ Avoid entering trades inside expanding zones – wait for structure confirmation
🔖 Conclusion
This BTCUSD setup showcases a masterclass in smart money behavior using the Mind Mapping Concept (MMC). From trap to breakout, every move is cleanly mapped, providing a strong edge to traders who understand institutional footprints.
Whether you're a scalper, day trader, or swing trader, incorporating MMC curve support and liquidity logic can take your trading precision to the next level.

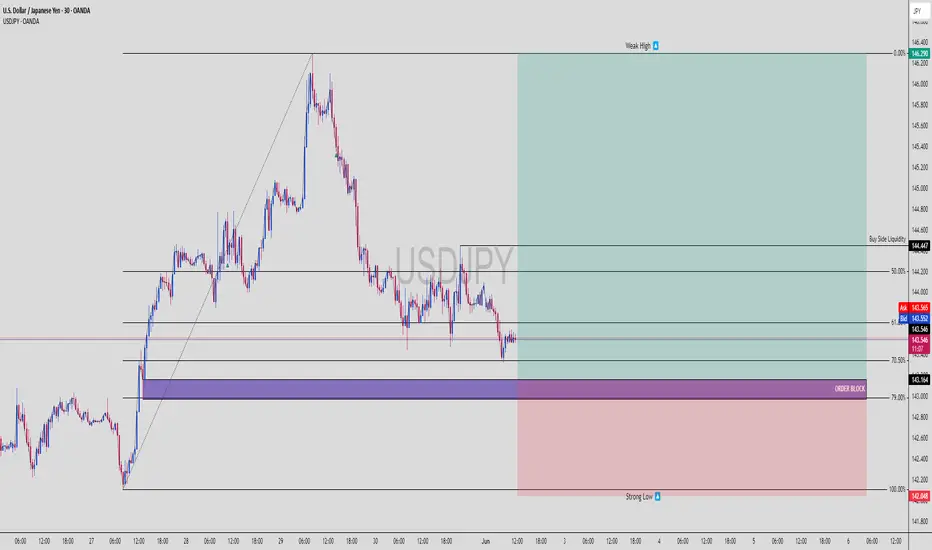
USDJPY Ready to Bounce – Sniper Long from Smart Money OBUSDJPY | 30-Min Bullish Setup – Premium to Discount + Order Block Reaction
USDJPY looks primed for a bullish reversal from a smart money perspective. Let’s walk through why this setup could be the cleanest long of the week 📈🧠
📌 1. Current Market Narrative:
Price retraced deep into discount levels (beyond 70.5%) after a strong bullish leg
Tapped into a refined bullish Order Block (OB) sitting just above a strong low
Multiple liquidity grabs have already occurred, leaving internal structure vulnerable to a reversal
Smart money has likely accumulated below recent lows… ready to pump toward Buy Side Liquidity 🧲
🧠 2. Key Technical Levels:
✅ Order Block Zone (Entry): 143.164
🔻 Strong Low: 142.048 (protected)
🟢 Buy Side Liquidity Target: 144.447
🔼 Weak High (Magnet): 146.290
Entry Point: Within OB (143.1–143.2)
TP Zones: 144.447 (main), 146.290 (stretch target)
SL: Below OB – around 142.048
RR: ~1:4+ — sniper grade 🥷
📊 3. Smart Money Flow:
OB aligned with 70.5–79% Fibonacci discount zone (deep retrace = strong reaction)
Structure shows signs of exhaustion on the sell side
Price may now reverse with displacement toward upside inefficiencies
Buyers likely stepping in aggressively from this level
🚀 4. Execution Plan (LTF Confirmation Entry):
✅ Wait for:
M5–M15 BOS (bullish break of structure)
FVG or mitigation entry confirmation
Maintain tight SL below OB (2–3 pips buffer)
Bonus: If price holds above 143.2 with strong M5 bullish candle close, that’s go-time for smart money longs.
🧨 5. Why This Setup is 🔥:
High probability bounce zone (OB + deep fib retrace)
Clean RR structure with solid target at buy side liquidity
Market structure shift likely as lower highs start breaking
Liquidity swept under recent lows = trap complete
This is the kind of setup that institutional algos are coded to exploit 🤖
💬 Type “USDJPY Long Sniper 🥷💴” in the comments if you’re in this setup too
🔁 Save this for trade journaling or future backtest
📊 Follow @ChartNinjas88 for smart money plays every day!
BTCUSD Hits Premium FVG – Liquidity Raid Incoming?BTCUSD | 4H Chart Breakdown – FVG, Order Block, and Smart Money Confluence
Here’s a killer SMC-based short opportunity forming on BTCUSD. Let’s decode this clean setup:
⚙️ 1. Market Structure Snapshot
Change of Character (ChoCH) confirmed on lower timeframe
Price aggressively retraced into a premium zone
Now tapping a combo zone:
✅ Fair Value Gap
✅ Order Block
✅ Sell-side OB mitigation
✅ Sitting right below Buy-Side Liquidity
We’re in prime territory for a liquidity raid followed by a sharp rejection.
📊 2. Key Price Zones
📈 Current Price: ~105,257
🟪 OB + FVG Zone: 104,766 – 105,257
🟦 Weak High (Target for Raid): ~106,200
🔻 Sell Setup Activation: If price shows rejection at OB zone
📉 Sell Target: 103,800 (Strong Low + liquidity pocket)
This is textbook bearish structure after a sweep of weak highs — time to watch the market respond.
🧠 3. SMC Logic Breakdown
ChoCH marks the first sign of bullish intent
But price is now entering a premium zone above equilibrium
Liquidity lies just above the weak high
We expect:
Raid of the weak high / buy-side liquidity
Rejection at the OB + FVG
Sharp drop to take out the strong low
This pattern = a high-probability SMC trap short.
📉 4. Risk-Reward Plan
🛑 Stop Loss: Just above 106,314.50
🎯 Take Profit: Near 103,800 (Strong Low)
🔁 RR: ~1:3 to 1:4 if you enter after a M5 rejection
🧼 Partial TP: Midway at 104,200 to reduce exposure
🧩 5. Entry Strategy
Monitor M5–M15 around OB + FVG zone
Wait for bearish engulfing / BOS
Refine entry with tighter SL
Let it play toward sell-side liquidity
⚔️ 6. Trader Notes:
Don't short early. Wait for reaction and structure shift
This is liquidity engineering – smart money lures in longs before nuking
Pair this chart with volume divergence confirmation if available
💣 Type "Liquidity Trap 💀" in the comments if this setup matches your bias
🔁 Save this if you scalp or swing SMC-based setups
🔔 Follow @ChartNinjas88 for clean smart money plays
BTCUSD SMC Short Play | Fair Value Gap Rejection Ahead?Bitcoin (BTCUSD) Smart Money Sell Opportunity | Liquidity Sweep Setup
Here’s a surgical-level BTCUSD bearish setup unfolding on the 30-minute chart, giving pro traders and learners a textbook SMC opportunity. Let’s break it down:
🔍 1. Trade Idea Summary
This move is a retracement into a premium zone, reacting off a:
✅ Fair Value Gap (FVG) between ~104,300 and 104,600
✅ Strong High at ~105,100 acting as liquidity
✅ Perfect Sell-Side Liquidity Target at ~102,200
Expecting a short retracement play with a clean 1:4+ RRR.
📊 2. Key Zones Marked on Chart:
FVG Zone: 104,259 – 104,600
Strong High (Liquidity Trap): 105,104
Entry Zone: Watch rejection inside FVG or after sweep of Strong High
TP Zone (Sell Side Liquidity): 102,200
SL: Above 105,200
🧩 3. Smart Money Logic Behind This Setup:
Price is in distribution phase, moving within a descending channel
Impulse down created imbalance (FVG) ➝ market now retracing to fill it
Expecting:
Liquidity grab above recent highs
Rejection from FVG zone
Strong push down toward sell side liquidity
⚙️ 4. Trade Execution Plan
Wait for price to enter FVG
Look for:
M5/M15 CHoCH (Change of Character)
Bearish OB or breaker block for sniper entry
Target liquidity zone marked on chart
Trail SL once price breaks below 103,000
📉 5. Market Bias + Risk Tip
HTF Bias: Bearish
Mid-Term Target: 101,800–102,200
❌ Don’t jump early — wait for structure break or FVG reaction
📍 Drop a “🔥” if you’re learning
🧠 Comment “SMC ENTRY” if you caught this setup
📲 Save for later & follow @ChartNinjas88 for daily breakdowns

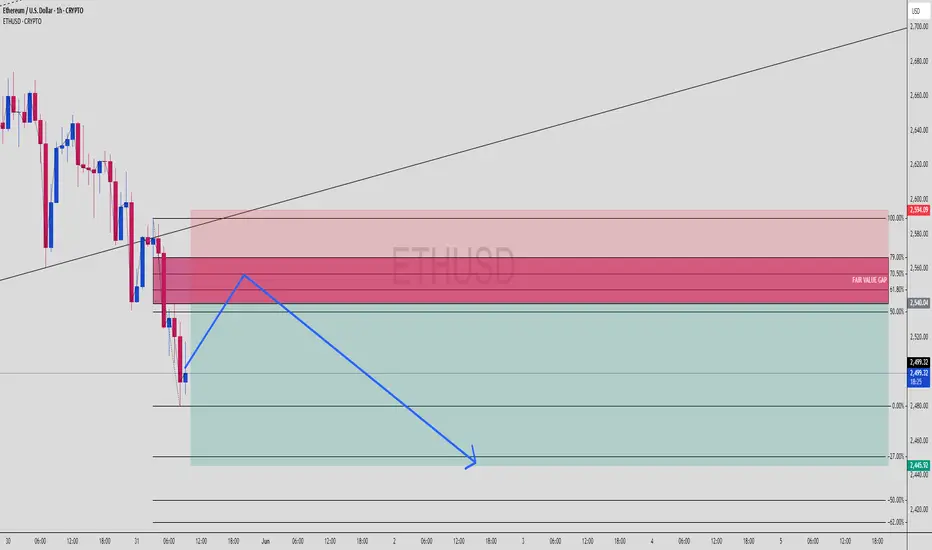
ETHUSD Bearish FVG Play | Premium Rejection Loading?Ethereum (ETHUSD) 1H Smart Money Bearish Setup | FVG + Fib Confluence
Textbook short scenario lining up on ETHUSD as it retraces into a premium zone filled with imbalance. Let’s unpack the key ingredients of this setup for the squad.
🔍 1. Trade Idea Summary
Price dumped sharply, leaving a clean Fair Value Gap
Retracement into premium (Fib 61.8%–79%) zone
Confluence of:
✅ FVG Supply
✅ Fib retracement zone
✅ Internal structure breaker
Targeting sell-side liquidity near 2,445 for a smooth RR 1:3+ setup.
📊 2. Key Zones on Chart
Entry Zone: 2,540 – 2,590 (FVG + 61.8%–79% Fib)
Strong High for Sweep (if needed): 2,594
TP Zone (Sell Side Liquidity): 2,445
SL: Above 2,600
🧩 3. Smart Money Concept Breakdown
Market made a lower low ➝ bias shifts bearish
Now retracing into the last up candle before the dump (FVG zone)
Expecting:
Premium rejection
Lower time frame CHoCH
Push to sell-side liquidity
⚙️ 4. Execution Plan
Let price enter FVG zone
Wait for M5 or M15 bearish break of structure
Confirm with:
OB rejection
Entry confirmation candle
Ride it down to TP or trail SL at midpoint
💡 5. Trader Tips:
Watch volume drop as price enters FVG — sign of weak buyers
Don’t force entry — let structure confirm
⚔️ Comment "ETH Breakdown 🔪" if you're eyeing this short
📈 Save this setup & follow @ChartNinjas88 for real-time sniper breakdowns
🎯 DM “TRADE” for access to my sniper SMC playbook
BTCUSD Trendline Trap? Smart Money Short at FVG
🔍 1. Trade Idea Summary
Trendline gets violated ➝ retail panic
Price retests Fair Value Gap at a premium level
Confluence:
✅ Trendline break liquidity
✅ FVG mitigation
✅ Bearish order block zone
✅ Lower high structure formation
Targeting the weak low sweep around $100,773.
📊 2. Key Chart Levels
Entry Zone: $104,800 – $105,200 (FVG)
Stop Loss: Above $105,209
Take Profit: $100,773 (Weak Low / Sell-side liquidity)
RR: ~1:3+, textbook sniper setup
🧩 3. Smart Money Concept Breakdown
Trendline Break = Liquidity Grab
Price taps into a premium zone FVG + OB
Expecting:
Rejection candle formation
Lower time frame BOS
Sell-side liquidity target @ weak low
This is a setup you can replay again and again — pure institutional footprint.
⚙️ 4. Execution Plan
Monitor retest reaction near FVG zone
Look for M5 or M15 bearish BOS/CHoCH
Refine entry on confirmation
Lock partials near midpoint, TP at weak low sweep
⚔️ 5. Pro Tips:
Trendline breaks are often traps — always check where the liquidity hides
FVGs act like magnets — price often returns to fill the imbalance before real moves
Volume dying into FVG = 🔥 clue for rejection
📉 Comment "BTC Trap Sniper 🎯" if you saw this setup too
🔁 Save this chart for future reference
⚔️ Follow @ChartNinjas88 for more SMC breakdowns & fib-paired traps

EURJPY Weekly Analysis – Major Structural Breakout & Target🧱 1. Consolidation Zone: The Dual Directional Area
From around August 2024 to May 2025, EURJPY traded inside a well-defined consolidation range, marked between approximately 155.00 to 165.00. This phase can be categorized as a Dual Directional Zone, meaning both buyers and sellers had tactical entries, but the market was in accumulation/distribution mode.
This phase often traps breakout traders and builds liquidity on both sides.
Price repeatedly swept highs and lows inside this zone but lacked any commitment, signaling that larger players were building positions.
The flat structure over months hinted that a major move was imminent.
⚠️ 2. Major CHoCH (Change of Character)
The first clue of shifting momentum was the CHoCH, which signaled a change in direction and flow of control.
The lower highs and lower lows began to shift into higher lows, showing buying strength beneath the surface.
This change didn’t immediately lead to breakout, but it marked the early intention of bullish dominance.
🚀 3. Major BOS (Break of Structure): Confirming the Bullish Bias
The clean break above the range high was the confirmation of a major bullish BOS.
This wasn’t just a minor pop — it was an aggressive breakout, validating that institutional liquidity had been accumulated and was now being deployed.
The price ran swiftly toward the Bullish Target Zone (~177.50–180.00) with very little pullback, suggesting urgency from buyers or short-covering from trapped sellers.
🎯 4. Bullish Target Reached – What's Next?
Price has hit the projected Bullish Target Area — a region of prior imbalance and psychological round numbers.
Traders who caught the breakout now face a critical decision point: Will price continue higher into price discovery mode, or is this the exhaustion phase?
If price holds above the BOS level (~165.00), there’s still room for continuation. But signs of rejection or slowing momentum here could lead to a correction.
🔻 5. Bearish Alternative: Trap and Reversal Scenario
The bearish path is not out of play — in fact, this move upward could potentially be a liquidity sweep.
If price fails to stay above the BOS and rapidly closes back into the consolidation range, it would suggest a bull trap.
This would confirm a deviation, which often leads to violent reversals.
The projected Bearish Target Zone (~145.00–147.50) aligns with prior unmitigated zones and imbalance that may attract price if sentiment flips.
🧭 6. Trading Strategy & Risk Planning
For Bulls: Watch for consolidation above 165.00. Breakout + Retest entries toward 180.00 or beyond offer high R/R.
For Bears : Look for exhaustion or fakeout patterns (like a Quasimodo or supply engulfing) near current highs. A breakdown and close below 165.00 signals short entries targeting 150s and potentially 147s.
💬 Final Thoughts:
This chart is a prime example of how patience during a range and reaction after breakout pays off. Smart traders don’t chase — they prepare.
A bullish continuation may still be in play.
However, if this move was only a liquidity purge, the reversal could be deep and fast.
Stay alert, mark your key levels, and trade what you see — not what you feel.

EURUSD Weekly Analysis (MMC) – Bearish Path to Target Zone📈 Market Narrative – Understanding EURUSD's Path with MMC
The EURUSD pair is currently navigating a critical phase in its macro price structure, aligning closely with the Mind Market Concept (MMC) methodology — a trading framework rooted in institutional price behavior, psychological arcs, and structured market mapping.
This chart reveals a story of accumulation, expansion, manipulation, and rebalancing — classic smart money behavior playing out on the higher timeframe. The current move is not just price action — it's a strategic delivery of price toward imbalance, guided by volume vacuums, liquidity zones, and engineered traps.
🧩 Phase-by-Phase Technical Analysis
🔷 1. Arc Accumulation Zone – The Beginning of Institutional Positioning
In the latter half of 2024, EURUSD entered a rounded arc formation, which marks a textbook accumulation phase.
This "bowl-like" curve represents gradual absorption of sell-side liquidity by institutions.
The lows became progressively higher, indicating demand stepping in while supply weakened.
Volume during this time was suppressed — another smart money tactic to accumulate without causing price spikes.
📌 Why This Matters: Arcs often precede explosive breakouts, particularly when aligned with time-based liquidity cycles (quarterly/yearly rebalancing). This zone gave birth to the breakout that followed.
🔷 2. The Central Zone – Consolidation Before Expansion
Once the arc base was complete, price broke out impulsively, then pulled back into what is labeled the Central Zone.
This zone acts as a mid-range liquidity pocket — where orders are stacked and reaccumulation occurs.
It also became the launchpad for the final markup wave that tapped the previous target around 1.1250.
🔍 This move was the realignment phase, where smart money took price above key highs to:
Hit their internal targets.
Trap breakout traders.
Induce euphoria before distribution.
🔷 3. Major BOS – Break of Macro Structure
The breakout through 1.1150–1.1200 confirmed a Major Break of Structure (BOS).
This BOS acted as a signal for:
Trend reversal confirmation for many retail traders.
A "green light" to buy — which was anticipated and exploited by institutions.
But here’s the twist:
Price rejected the SR Interchange Zone (support turned resistance), signaling that the breakout was engineered to trap liquidity.
🔷 4. Distribution & Manipulation – The Trap Layer
The chart clearly shows two critical supply areas:
Minor Resistance (around 1.1400s)
Major Resistance (around 1.1550–1.1600s)
Price briefly approached these zones but failed to hold, forming a complex distribution range.
This is where:
Smart money distributed their long positions.
Retail buyers got trapped.
Volume increased during sell-side preparation.
📌 The rejection from these zones sent price into a clean markdown, forming lower highs and confirming the bearish structure mapping.
🔷 5. Structural Mapping – Downtrend Control
Price action is now clearly in a bearish delivery phase, as shown by:
Lower highs & lower lows
Repeated rejections from minor resistance
Large red candles with little retracement (showing momentum)
This phase is often misunderstood by retail traders. But within MMC, it’s identified as the delivery to imbalance — a controlled descent into unmitigated demand.
🔷 6. Target + Reversal Zone – Where the Real Opportunity Begins
We are approaching the most important area on the chart:
🟡 Target + Reversal Zone (around 1.0950–1.1000)
This zone is not randomly drawn:
It's the origin of the arc breakout, a high-volume node.
It's a discounted price level where institutions may re-engage.
It’s untapped demand from the earlier accumulation — meaning no major reaction has occurred here yet.
If price slows down here, forms a liquidity sweep, or gives a bullish engulfing on the lower timeframe — this could be the reversal point.
But:
If price slices through with strong momentum, it may signal macro weakness, opening room to test the 1.0800 region.
🧭 Trade Plan & Execution Guide
Setup Type Actionable Guidance
📉 Bearish Pullback Entry Short entries near 1.1300–1.1350 with stop above minor resistance
🟡 Demand Reversal Watch Wait for reaction in 1.0950–1.1000, assess volume & candle response
📊 Structure Confirmation Use lower timeframe BOS for entry alignment
🛡️ Risk Management Keep risk below 1% per trade, avoid chasing mid-zone prices
💬 Key Takeaways
EURUSD has completed its accumulation → expansion → manipulation cycle.
We are now entering the rebalancing phase, where the market returns to fair value (demand).
Smart money flow is visible — from engineered highs to controlled selloffs.
The Target + Reversal Zone will likely dictate the next macro direction.

BTCUSD SMC Short | 70.5% Fib + OB Rejection Incoming?BTCUSD | High Risk-Reward Setup at Key Supply Zone 🔥
This Bitcoin setup is setting up for a potential clean short opportunity, right from a key Order Block zone confluenced with 61.8–70.5% Fib retracement and a Strong High liquidity magnet above.
🧠 1. Why This Trade Setup is 🔥
This BTCUSD chart shows Smart Money preparing a trap:
🔺 Impulse down ➝ forming market structure shift
📉 Retracement back to a refined OB (purple zone)
📍 Aligned perfectly with:
✅ 61.8–70.5% Fib retracement zone
✅ Strong High = liquidity trap
✅ Bearish engulfing rejection from supply zone
This is textbook SMC confluence. Price could sweep the high one more time, then tank hard.
📌 2. Zone Breakdown
OB Entry Zone (purple): ~108,000 to 108,400
SL Above Strong High: ~109,000
TP at Weak Low: ~104,600
✅ Entry around 108,000
✅ RRR: ~1:5 👑
📈 3. Market Structure
HTF Bias: Bearish
LTF Structure: Retracing to premium zone
Expecting BOS downward if rejection confirms
⚙️ 4. Trade Plan
Wait for price to tap 61.8–70.5% zone
Look for M5/M15 bearish structure break
Enter on pullback to M15 OB
SL = Above the High
TP = Weak Low (104,630)
🛑 5. Risk Management Tips
Never enter blindly at 61.8%
Always wait for confirmation on LTF (M5/M15)
If price blows past 70.5%, let it go — don’t chase 🧘
🧠 Save this trade plan
📈 Comment “BTC SMC ENTRY” if you caught this
👀 Follow for more Smart Money chart breakdowns
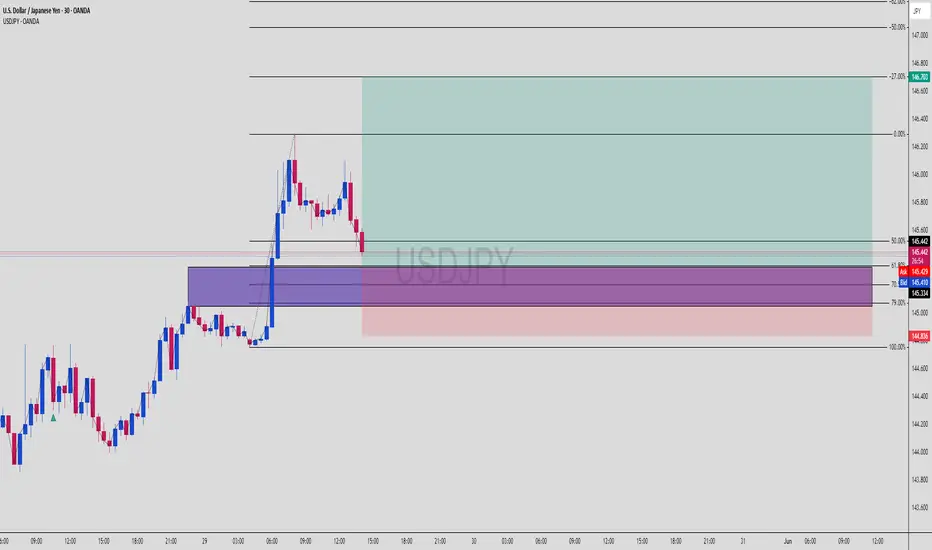
USDJPY SMC Play | Order Block + Fibo 61.8 = Precision EntryUSDJPY | Confluence Entry in Motion 🚀
A beautifully aligned setup using Smart Money Concepts, with a clear entry mapped out at the OB + Fib 61.8% retracement zone. Price just tapped into the purple zone — now it’s all eyes on bullish momentum confirmation.
📊 1. Market Overview
USDJPY has been trending bullish, with a strong impulsive move followed by a retracement — price is now sitting at a key decision zone.
The zone is a refined bullish Order Block (purple) aligning perfectly with:
✅ 61.8% Fibonacci retracement
✅ 70.5% golden zone
✅ Strong imbalance below
We’re seeing a beautiful reaction candle off this area as price hunts liquidity.
🧠 2. Why This Trade Makes Sense (SMC Breakdown)
Here’s the logic:
Price broke structure to the upside
Pullback into OB + discounted pricing
Clean liquidity sweep just beneath the short-term low
Room for continuation toward higher timeframe POI (top green zone)
This is a textbook SMC + Fibonacci sniper setup.
🎯 3. Entry Zone (Purple Box)
📍 OB Zone: 145.200 – 145.334
🧮 Fib Levels:
— 50%: 145.595
— 61.8%: 145.334
— 70.5%: ~145.200
— 100% (SL): 144.836
Your entry's beautifully layered with confluences = 🔥 Risk/Reward.
🚀 4. Target Zones
🟢 TP1: 146.000
🟢 TP2: 146.703
(TOP of the Fibonacci extension, completing the full bullish leg)
⚖️ 5. Risk-Reward Setup
✅ SL: 144.836
✅ Entry: around 145.334
✅ TP: 146.703
👉 RRR: Over 1:4 — institutional grade 🔥
🛡️ 6. Trade Management Tips
✅ Wait for bullish engulfing or LTF break of structure for confirmation
🕰️ Drop to M15 for precise sniper confirmation entry
🔄 If it taps again with more imbalance left = re-entry possible
📌 Save this if you love high confluence entries
🔥 Drop “SMC Sniper” in the comments if you're watching this pair
👀 Follow for daily setups just like this — clean, confident, and calculated
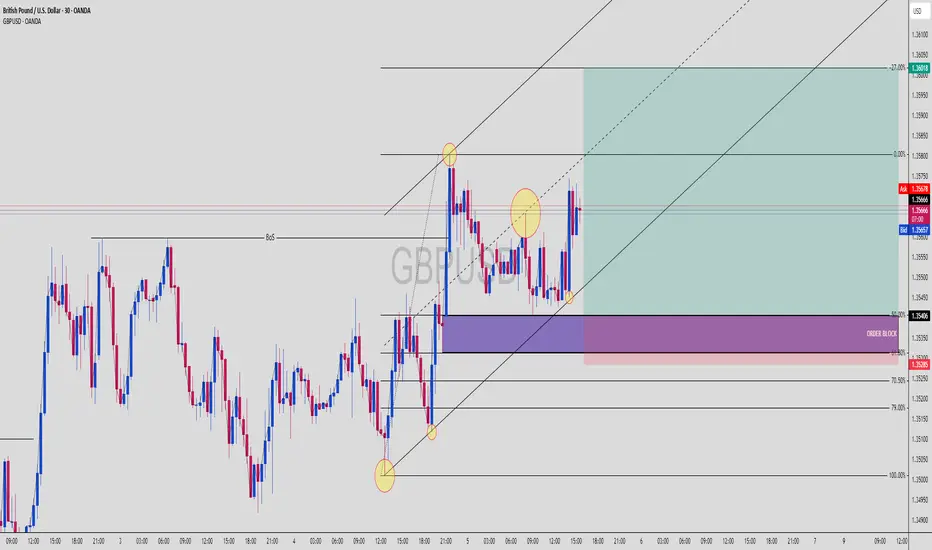
GBPUSD Decision Point | Will the Order Block Hold or Fold?GBPUSD | Smart Money Liquidity Trap or Bullish Breakout?
Here’s a high-probability play based on Order Blocks, Fair Value Gaps, and channel structure—one of the cleanest SMC setups on cable this week.
📊 1. Market Overview
GBPUSD is currently pulling back after a sharp drop, retesting the premium zone Order Block on the H1 timeframe.
Structure remains bullish inside the ascending channel, but there’s major indecision here—will it break above the OB, or retrace deeper into the Fair Value Gap zone?
🧠 2. Dual Bias Logic
You’ve mapped out two valid SMC scenarios (marked in red & blue arrows):
🔻 Scenario 1: Bearish Trap + Deep Liquidity Grab
Price reacts from the Order Block (purple zone)
Rejects and breaks down into the Fair Value Gap (FVG) zone near 1.33300
Targets liquidity resting below prior structure
🔺 Scenario 2: Order Block Respect + Long Continuation
OB holds, price flips bullish
Pushes above 1.35260 for bullish continuation
Final target near channel top @ 1.35920–1.36000 zone
Both scenarios are textbook Smart Money setups — based on how price reacts at this OB, we’ll get the direction.
🧱 3. Key Zones
🔵 Order Block: 1.3445 – 1.3526
🔴 Fair Value Gap (FVG): 1.3330 – 1.3283
🟢 Target (Bullish): 1.3600
🔻 Target (Bearish): 1.3280
⚖️ 4. Risk-Reward Potential
Whether you go long from the FVG or short from the OB, both have:
✅ Clean entries
✅ Clear invalidation zones
✅ Strong RRR potential (1:3 to 1:4+)
📌 5. Watchlist Note
💡 If price taps into the OB and shows weak momentum, prepare for shorts targeting the FVG
💡 If it holds the OB cleanly with bullish engulfing or BOS (break of structure), ride the long back to channel highs
💬 Call to Action:
📈 Add GBPUSD to your SMC sniper list this week
💬 Comment “OB or FVG? 🤔” if you're waiting to catch the bounce
📌 Save this post for Smart Money reference setups

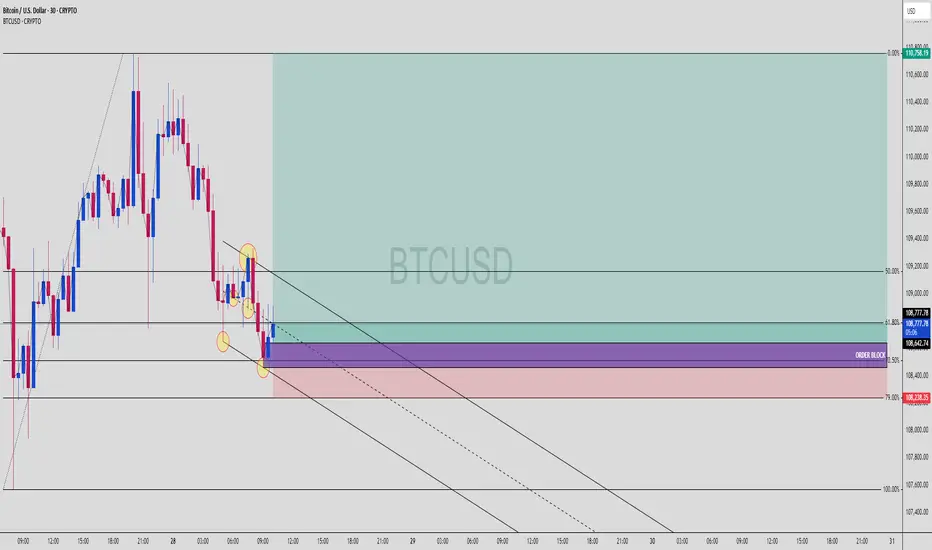
BTC Bulls Awakening from the Shadows – OB + 79% Fib Reaction 📈 BTCUSD | 30-Min Bullish Reversal Setup from OB + 79% Fib Zone
Smart Money never misses a good discount… and this BTCUSD setup is that juicy premium-to-discount play we wait for.
🔍 1. Price Action Context
Market sold off into a clearly defined Order Block
Price tapped precisely at the 79% Fib level
Internal liquidity sweep confirmed below recent equal lows
No candle close below OB = structure still intact
This is what we call the "Trap + Reverse" move. Late shorts just got baited.
🧱 2. Confluences Stacking Up
💎 79% Fib Retracement — Deep discount zone for Smart Money
💎 Bullish Order Block — Last up candle before the sharp sell-off
💎 Liquidity Sweep — Price swept short-term lows = inducement
💎 Channel Structure — Midline bounce = potential breakout
The OB + Fib overlap = a high-probability buy zone with minimal risk
🎯 3. Trade Plan
Entry Zone: 108,250–108,650
Stop Loss: Below 108,000
Take Profit: 110,758 (premium zone)
⚖️ 4. RRR (Risk-Reward Ratio)
📥 Entry: ~108,400
🔒 SL: 108,000
💰 TP: 110,758
✅ RRR ≈ 1:5.8
This is sniper-level asymmetric risk. You don’t chase candles — you wait here, like a lion in the grass 🦁.
🔁 5. What to Watch Next
Price must reclaim and close above 108,867 for confirmation
If we get a BOS (Break of Structure) above 109,200 = 🚀
Hold above the mid-channel line = bullish continuation
💬 Comment “LONGED BTC 💎” if you caught this with the OB bounce!
📌 Save this to study OB + Fib synergy.
👀 Watch price action at 109,200 — breakout zone incoming?
AU Bulls Make A Break For Higher Prices! Time To Long??OANDA:AUDUSD has practically been caught in an Ascending Channel for most of this year but that might not be for "Long"!
A few key things to point out:
- Early April delivered a False Breakout where Price reached the Previous 5 Year Low @ .5980 and was immediately sent back up into the Channel! (Liquidity Sweep??)
- Most of the Price Action that's occurred in this range has been contained to the Upper Chamber of the Channel between the Rising Resistance and Linear Regression.
- Price Consolidated tightly into a Pennant Pattern underneath the Rising Resistance for the past few weeks before delivering a Bullish Break just earlier this evening.
If Bulls are able to sustain Price outside the Channel, this could generate potential Long Opportunities on the Retest of the Break of the Ascending Channel!
Once a Breakout is validated and Retest is successful, the Price Target would be the Next Swing High @ .66875 where Bears were able to push Price down last.
Fundamentally, RBA will be releasing CPI y/y numbers on Tuesday, May 27th with analysts forecasting a .1% Decrease in Inflation from 2.4% to 2.3% after last week having made a 25 basis point rate cut from 4.1% to 3.85%.

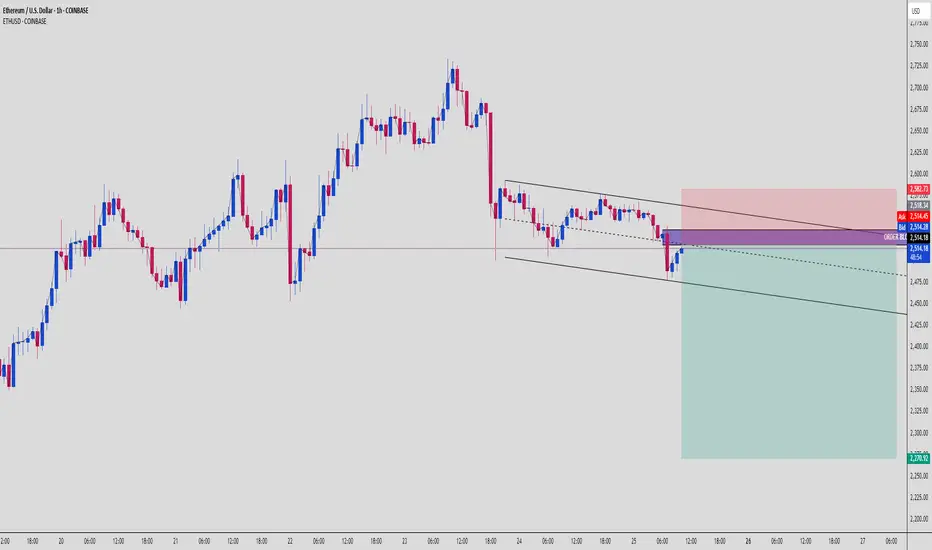
ETH Trap & Drop Setup – OB Rejection + Bearish Channel📉 Ethereum (ETHUSD) | 1H SMC Breakdown | Bearish Setup Explained
Another clean setup for the SMC gang. ETH just gave us a beautiful opportunity, respecting market structure, reacting to Order Block supply, and aiming to clean up sell-side liquidity. Let’s dive in 👇
🧱 1. Structure: Bearish Channel Formation
ETH has been moving in a tight bearish channel, producing:
Lower highs (confirmed supply zones)
Lower lows (liquidity grabs + structure breaks)
This shows consistent bearish pressure.
🧊 2. Premium OB Tap + Rejection Zone
Price just retraced into a Bearish Order Block sitting in the Premium zone, right around $2,514.
💥 OB zone is aligned with:
Upper channel resistance
Supply rejection
Clean inefficiency fill
Price wicked inside and immediately rejected = Smart Money active.
🧠 3. Retail Psychology Trap
Retail likely:
Longing support bounce
Placing stops under structure lows
Not respecting OB/imbalance narrative
Meanwhile, Smart Money:
Enters short from OB
Targets imbalanced zones
Eyes the $2,270 weak low
🎯 4. Liquidity Pool & Final Target
🔻 Target Zone: $2,270
This level is:
A weak low (high chance of being swept)
Sits at lower channel boundary
Acts as a liquidity magnet
Expect price to accelerate as it approaches this zone.
⚔️ 5. Trade Plan (Short Setup)
📍 Entry: $2,514 OB Zone
🔐 Stop Loss: Above $2,582 (structure break + OB invalidation)
🎯 Targets:
TP1: $2,460
TP2: $2,400
TP3: $2,270
⚖️ RRR: ~1:4+ – high precision trade
🧠 Key Concepts in Play:
Order Block Rejection
Premium Pricing Sell Setup
Bearish Channel Continuation
Liquidity Sweep Targeting
📌 Chart Summary:
"Don’t chase candles – follow the narrative. OB tells the story, liquidity gives the profit."
📚 Study the OB zone reaction. These setups repeat every week across assets if you know what to look for.
💬 Drop “ETH OB SNIPER” in the comments if this is your kind of entry.
📈 Tag a trader who needs to stop fading Smart Money moves!
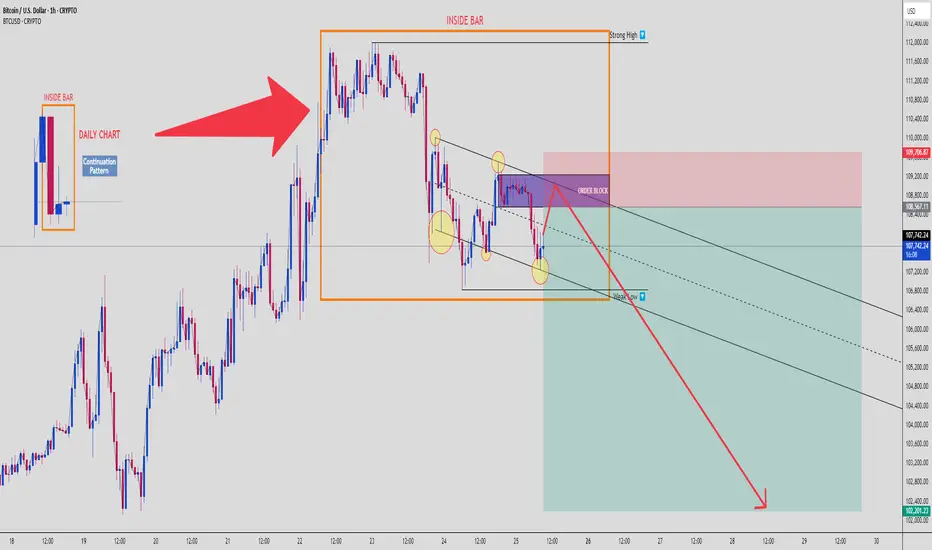
BTCUSD: Inside Bar Trap + Order Block Rejection Targeting $102K📉 Bitcoin | SMC Breakdown | 1H Chart
Welcome to a clean Smart Money setup, where retail gets baited and Smart Money gets paid. Let’s break down what’s happening on BTCUSD, 1H chart, using multi-timeframe confluence and Smart Money Concepts. 👇
🗓️ 1. Daily Chart Confluence
We start with a Daily Inside Bar Pattern – a classic continuation setup, often used by institutions to trap traders before expansion. BTC ranged tightly, then broke to the upside to grab liquidity, not start a rally.
🟥 Daily High = Liquidity Pool
🟧 Inside Bar Range = Manipulation Zone
This is the trap zone.
🧱 2. Order Block Rejection (1H)
Price tapped a clearly defined Bearish Order Block in premium pricing, just above the mid-range of the Inside Bar.
💥 Reaction confirmed:
Rejection candles from OB
Structure respecting downside bias
Fakeout = Fuel for downside expansion
📉 3. Bearish Continuation Structure
Price is moving within a descending channel, respecting internal supply zones. Each lower high is met with supply pressure, and internal lows are swept before moving lower.
You’re looking at a high-probability continuation move toward the weak low marked near $102,200.
🧊 4. Weak Low as Final Target
This level is a classic liquidity magnet – weak lows = retail stop clusters = Smart Money target.
We expect BTC to:
Tap OB
Reject with minor pullback
Break structure
Fill imbalance and target weak low
It’s a beautiful setup if managed correctly.
🧠 5. Psychology & Trap Narrative
Retail is:
Buying the breakout of Inside Bar
Placing stops under weak lows
Ignoring the OB rejection
Smart Money is:
Selling from OB
Riding the imbalance
Grabbing liquidity from below
This is where you flip from reaction-based trading to narrative-based execution.
🧮 6. Trade Setup Summary
📍 Entry Zone: $108,500–$109,700 (OB zone)
🔐 Stop Loss: Above $109,800 (invalidate OB)
🎯 Target:
TP1: $106,500
TP2: $104,000
TP3: $102,200 (Sell-side Liquidity Sweep)
⚖️ RRR: Approx. 1:4 to 1:5 depending on entry
⚠️ Risk Management:
Do not overleverage.
This setup rewards patience and narrative confirmation, not emotional entries. Wait for OB confirmation and rejection.
📈 If this hits, it’s a chart you screenshot and study again and again.
💬 Comment “INSIDE BAR MASTERCLASS” if you’re watching this play out live. Share with your trading circle.