Eli Lilly Target $1,258-1,316 in final waveStock price is in a bullish impulse
Last wave 5 is in progress
Target is calculated as 50-61.8% of waves 1-3 move added to the valley of wave 4
It is highlighted with the blue box in $1,258-1,316 area
It perfectly aligns with the trend channel resistance
Invalidation is below the bottom of wave 4 < $1,013
It is expected to see the Bearish Divergence in wave 5
LLY

Lilly - Clean Chart StructureWe are analyzing the move starting from August 2025.
So far, four out of five waves have been drawn.
The structure of the fourth wave is an expanded flat (with measured moves):
A = 134 -> five-wave move (impulse)
B = 156 -> three-wave move
C = 120 -> five-wave move (zigzag, internal impulses ≈60)
The correction appears complete in both structure and proportions.
Similar to the second wave, the fourth wave retraced 0.382 of the prior move.
Even if price dips slightly, the main targets remain unchanged.
Additionally, we seem to have caught the very start of the next move, and the fifth sub-wave should now begin.
Key targets:
1,171
1,263 (aligns with the higher time frame)
or somewhere within this range
The upside potential from the current level is estimated at 14 - 22 %.
---
Please subscribe and leave a comment!
You’ll get new information faster than anyone else.
---

LLY | This Healthcare Co. Is a Great Pick | LONGEli Lilly & Co. engages in the discovery, development, manufacture, and sale of pharmaceutical products. The firm's products consist of diabetes, oncology, immunology, neuroscience, and other products and therapies. The company was founded by Eli Lilly in May 1876 and is headquartered in Indianapolis, IN.

$LLYThe technical structure for NYSE:SMR presents a compelling case of a strong, sustained uptrend, characterized by a rhythmic pattern of sharp advances followed by periods of consolidation. This behavior is the hallmark of a healthy, momentum-driven bull move.
1. Pattern Analysis: Sequential Bull Flags
The chart reveals the successful completion and continuation of a classic bullish pattern sequence:
The First Bull Flag: This pattern likely began with a powerful upward move (the "flagpole"), followed by a brief, shallow, and downward-sloping consolidation period (the "flag"). The successful breakout above this first flag confirmed the pattern and signaled the resumption of the uptrend. Your note that this first pattern "has been a success" is a key observation that sets a bullish precedent.
The Emerging Second Bull Flag: Following the initial breakout, the price action appears to be forming a second, successive bull flag. This pattern represents a temporary pause and period of profit-taking within a larger uptrend. It indicates that after a strong leg up, the market is catching its breath, allowing overbought conditions to ease before the next potential advance. We are currently in the "waiting" phase for this second pattern to fully reveal itself and confirm with a breakout.
2. Fibonacci Retracement: Mapping the Pullback and Target
Applying Fibonacci retracement levels to the most significant prior upswing provides a mathematical framework for understanding the corrections and projecting future targets.
The current consolidation within the second bull flag has already respected key Fibonacci levels, finding support and reversing near them:
0.236 Level ($44.30): This shallow level was easily passed, indicating a healthy correction.
0.382 Level ($36.18): This is a common retracement zone in a strong trend, and the price action here likely provided a key support area.
0.500 Level ($29.62): A deeper, but still within the normal, retracement level. Holding above this level would be considered a sign of continued strength.
The analysis points to the 0.618 Fibonacci retracement level at $23.05 as the primary target for the overall pattern. This level is a deep retracement and often acts as a critical support or resistance zone. In this context, it represents a significant profit-taking objective once the second bull flag completes its breakout and resumes the upward trajectory.
3. The Overall Narrative and Key Levels to Watch
The story for NYSE:SMR is one of a powerful, structured uptrend building energy for its next move.
The Bullish Narrative: The successful first bull flag established a pattern of "burst and consolidate." The formation of a second such pattern suggests the trend is well-organized and has further to run. The measured move projection from the second flag, upon a breakout, aligns with the $23.05 (0.618 Fib) target.
The Outlook After the Target: It is prudent to anticipate that upon reaching the $23.05 target, the stock will likely experience a significant pullback or period of extended consolidation. This is a typical market behavior as traders lock in profits at a major Fibonacci level.
Conclusion and Strategy:
Confirmation Trigger: A decisive breakout above the resistance trendline of the current, second bull flag pattern is needed to confirm the next leg up is beginning.
Primary Target: The initial upside target for this next leg is projected at the $23.05 level.
Risk Management: A break below the support trendline of the second flag would invalidate the short-term bullish pattern and suggest a deeper correction is underway.
In summary, NYSE:SMR is exhibiting technically sound bullish behavior. The focus is now on the completion of the second bull flag, with a breakout setting the stage for a move toward the $23.05 Fibonacci target, after which a pullback is considered a high probability.
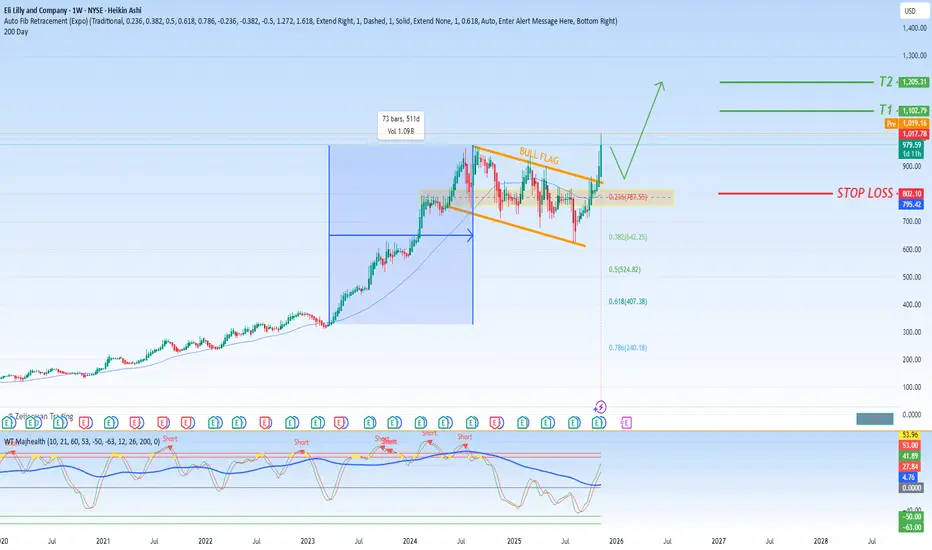
NYSE:LLY has confirmed a bull flag pattern which suggest a bull run. NYSE:LLY has strong fundamentals. stop loss for NYSE:LLY is 0.236 (787.55). take profit is 1,100 and 1,200 reparaphase and make it longer please
Of course. Here is a detailed and repurposed technical analysis of NYSE:LLY (Eli Lilly) based on the points you provided, expanded to provide a more comprehensive market perspective.
Technical & Fundamental Analysis of NYSE:LLY : Positioning for a Continued Advance
A combined technical and fundamental assessment of Eli Lilly ( NYSE:LLY ) reveals a powerfully bullish setup, suggesting the stock is poised for a significant continuation of its established uptrend. The convergence of a confirmed chart pattern and robust underlying fundamentals creates a high-conviction narrative for further gains.
1. Technical Outlook: The Confirmed Bull Flag Pattern
The primary technical feature on the chart is the confirmation of a Bull Flag pattern. This pattern is one of the most reliable continuation signals in technical analysis and typically forms after a strong, near-vertical advance (the flagpole).
Pattern Structure: The formation began with a sharp upward move (the flagpole), followed by a period of consolidation characterized by a slight downward or sideways drift on lower volume (the flag). This consolidation represents a brief pause and profit-taking phase within a larger bullish trend.
Confirmation: The pattern is considered "confirmed" once the price breaks out above the upper trendline of the flag consolidation with conviction, ideally accompanied by a surge in trading volume. This breakout signals that the period of consolidation has ended and the prior uptrend is resuming.
2. The Powerful Fundamental Backdrop
The bullish technical structure is significantly reinforced by NYSE:LLY 's strong fundamentals. The company is a leader in the pharmaceutical sector, with a highly promising portfolio. Key drivers include:
Blockbuster Drugs: Massive commercial success and future potential from drugs like Mounjaro and Zepbound in the GLP-1 space for diabetes and weight loss.
Robust Pipeline: A strong and innovative research and development pipeline that promises future growth.
Solid Financials: Consistent revenue growth and profitability.
This fundamental strength provides a solid foundation for the stock's upward move, suggesting that the trend is supported by tangible business performance and not merely speculative sentiment. This reduces the risk of the pattern being a false signal.
3. Trade Management Strategy: Risk and Reward
A clear plan for managing the trade is crucial. Based on the bull flag's measured move target and Fibonacci levels, a structured approach would be:
Stop-Loss (Risk Management): To protect capital in the event of a pattern failure or a sudden market reversal, a logical stop-loss level is placed below the 0.236 Fibonacci retracement level at $787.55. This level acts as a key support; a break below it would invalidate the immediate bullish premise and suggest a deeper pullback is underway.
Profit-Taking Targets (Reward Zones): The measured move projection of the bull flag pattern provides clear upside objectives.
Primary Target: $1,100. This is the initial projected price target based on the technical pattern and represents a key psychological and resistance zone.
Extended Target: $1,200. If buying momentum remains exceptionally strong and the stock breaks through the $1,100 level with ease, a further extension toward the $1,200 area becomes probable. This would likely represent a more euphoric or parabolic phase of the move.
Synthesis and Market Outlook
In summary, NYSE:LLY presents a high-probability bullish setup where technicals and fundamentals are in strong alignment. The confirmed bull flag breakout indicates the continuation of a powerful uptrend, with clearly defined levels for managing risk and securing profits.
Key Levels to Watch:
Support (Stop-Loss): $787.55
Resistance (Target 1): $1,100
Resistance (Target 2): $1,200
Traders and investors should monitor the stock's behavior at these key levels. A hold above the flag's resistance, now turned support, combined with strong fundamental tailwinds, keeps the bullish thesis firmly intact.
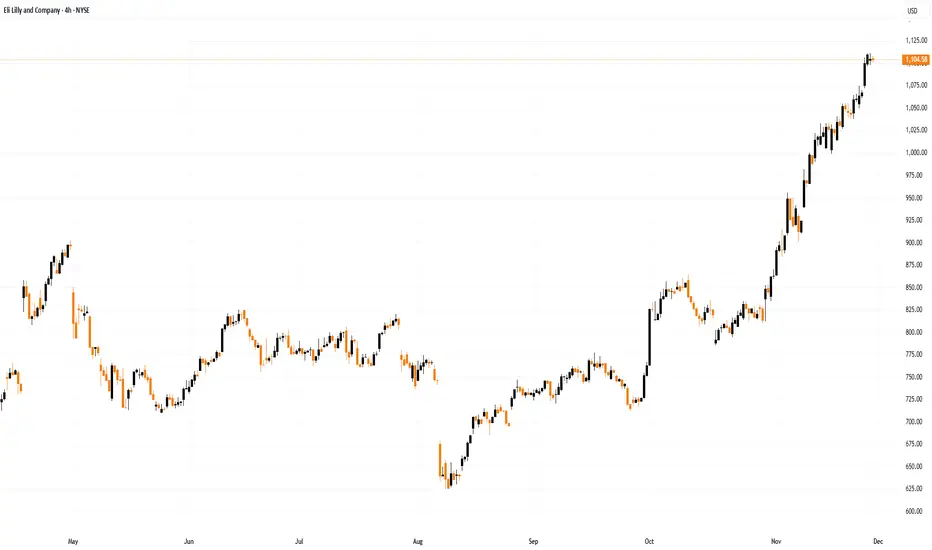
Eli Lilly (LLY) Shares Have Surged by Around 30% in NovemberEli Lilly (LLY) Shares Have Surged by Around 30% in November
The price action of Eli Lilly and Company (LLY), the world’s largest pharmaceutical firm, reflects exceptionally strong demand:
→ since the start of the month, LLY shares have risen by roughly 30%;
→ in late November, the company’s market capitalisation exceeded $1 trillion, making Eli Lilly the first pharmaceutical firm in history to reach this level.
Why are Eli Lilly (LLY) Shares Rising?
A key driver has been the strong earnings report published on 30 October.
→ Earnings per share came in far above expectations ($7.02 versus $5.69).
→ Sales of diabetes treatment Mounjaro and obesity drug Zepbound surpassed $10 billion for the quarter.
→ On the back of this success, management raised its revenue outlook, and market participants now expect an even stronger fourth quarter.
At the same time, the chart is signalling that the extraordinary rally may be running out of steam.
Technical Analysis of Eli Lilly (LLY) Shares
For more than a year, LLY’s price action followed a downward channel. If this channel is extended upward twofold after the bullish breakout (which occurred following the earnings release), we can see that the price has reached the upper boundary of the expanded channel — a level often viewed as a potential target for buyers.
Note that after breaking above the psychological $1,000 level, the rally initially slowed (1), but then accelerated sharply this week (2) — a possible sign of FOMO and the climax of the November uptrend.
Additionally → the RSI indicator is deep in overbought territory and is pointing lower.
Given these factors, it is reasonable to assume that LLY shares are vulnerable to a pullback, which could intensify if investors begin taking profits on long positions.
This article represents the opinion of the Companies operating under the FXOpen brand only. It is not to be construed as an offer, solicitation, or recommendation with respect to products and services provided by the Companies operating under the FXOpen brand, nor is it to be considered financial advice.
Eli Lilly: The Trillion-Dollar Cure for Market Volatility?Eli Lilly has officially shattered the Silicon Valley ceiling, becoming the first healthcare company to achieve a $1 trillion market capitalization. While tech giants like Nvidia grapple with bubble concerns and doubts about AI monetization, Lilly has delivered tangible, recurring revenue through its dominance of GLP-1. This milestone is not merely a pharmaceutical victory; it represents a fundamental shift in market leadership from speculative tech to essential biopharma.
Macroeconomics: The Flight to Quality
The Federal Reserve’s pivot is fueling this ascent. New York Fed President John Williams signaled imminent rate cuts, raising December cut expectations to 70%. Lower rates disproportionately benefit capital-intensive sectors like pharma, which require massive upfront R&D and manufacturing spend. Investors, wary of tech volatility, are treating Lilly as a "defensive growth" asset—a rare hybrid offering the stability of healthcare with the explosive growth of software.
Science & Innovation: The Dual-Agonist Revolution
Lilly’s valuation rests on **tirzepatide** (branded as Mounjaro and Zepbound). Unlike previous drugs that target a single hormone, tirzepatide mimics both GIP and GLP-1, delivering superior efficacy in weight loss and blood sugar control. This scientific leap has rendered competitors’ single-agonist drugs vulnerable. Furthermore, Lilly is already stress-testing its own dominance with **retatrutide**, a triple-agonist candidate showing even higher potency, effectively cannibalizing its own portfolio before rivals can catch up.
Business Models: Disrupting the Middlemen
Lilly is aggressively rewriting the pharmaceutical distribution playbook. The launch of **LillyDirect** bypasses traditional Pharmacy Benefit Managers (PBMs). By partnering directly with Walmart to offer cash-pay options for Zepbound vials, Lilly captures margin previously lost to intermediaries. This Direct-to-Consumer (DTC) model exerts immense pressure on insurers to cover these drugs, leveraging patient demand as a battering ram against restrictive formularies.
Geostrategy: Manufacturing Sovereignty
Management recognizes that demand is useless without supply. Lilly has committed over $27 billion to manufacturing expansion, predominantly in the US and Europe (Ireland and Germany). This strategy reduces reliance on fragile Asian supply chains, insulating the company from US-China geopolitical friction. By onshoring active pharmaceutical ingredient (API) production, Lilly positions itself as a national security asset, aligning corporate growth with Western industrial policy.
Technology & Cyber: AI-Driven Discovery
Lilly is moving beyond traditional wet labs. The company’s **TuneLab initiative** utilizes federated AI learning. This allows biotech partners to train models on Lilly’s proprietary data without exposing the underlying IP. Additionally, partnerships with Isomorphic Labs aim to accelerate small molecule discovery. This "tech-forward" approach reduces the years-long timeline of drug discovery, turning R&D into a computational problem rather than a biological guessing game.
Management & Leadership: The Ricks Doctrine
CEO David Ricks has executed a masterclass in capital allocation. While peers engaged in share buybacks, Ricks poured capital into manufacturing capacity ahead of approval. His leadership style is characterized by "preemptive scale"—building the factory before the drug is approved. This risk appetite allowed Lilly to meet the explosive demand for Zepbound faster than competitors, securing market share through sheer logistical brute force.
Patent Analysis: Building the Moat
Lilly is fiercely defending its IP territory. The company has launched legal offensives against compounding pharmacies attempting to sell unauthorized versions of tirzepatide. Simultaneously, they are layering patents on delivery mechanisms and combination therapies. The transition from auto-injectors to vials also serves a strategic patent function, complicating the regulatory pathway for future biosimilars.
Conclusion
Eli Lilly has successfully decoupled itself from the broader healthcare index. By combining Silicon Valley-style innovation with industrial-scale manufacturing, it has created a $1 trillion moat. As the Fed eases policy, Lilly stands ready to deploy cheap capital to further widen the gap against its rivals.

Stocks Worth Your AttentionI wanted to share a list of high growth, high margin stocks that are worth looking into. This is where I pull a lot of my core positions from.
HIMS is noteworthy as it's also one of the most heavily shorted stocks at the moment and THE best performer on my ranking.
These stocks are essentially cash cows dominating their space. Please do look into each one carefully. This list is algo generated and not combed through by me yet. So make sure the stock's earnings and trend are to your liking.
Enjoy and good luck!

"LLY's Bear Market Mode ON | Crash Incoming"“ LLY is gearing up for a sharp correction down to the $35–$17 zone — a critical reset that could flush out weak hands before the next explosive bull run. Stay sharp, this is where big opportunities form. ⚠️
🔥 Summary:
Eli Lilly (LLY) looks ready for a major market reset after completing a historic five-wave climb. This could be the start of a long-term corrective Wave 2 , potentially wiping out years of gains before the next explosive super-cycle takes off. The bull run isn’t over — but it’s taking a serious pause. ⚠️📉
🌊 Wave Theory Outlook
LLY’s multi-decade Elliott structure shows a completed Cycle Wave 1 peaking near the 2.618 extension zone around $1029. Historically, such extensions often mark exhaustion.
Next comes Wave 2 , which could retrace deep into the $35–$17 zone (the 0.618–0.786 Fibonacci region and prior structural base). Expect a complex W-X-Y pattern , shaking weak hands before a powerful Wave 3 bull expansion later this decade.
📉 Price Action & Smart Money Context
The chart shows exhaustion wicks, momentum divergence, and slowing volume — classic signs of distribution .
Smart money is likely off-loading near the highs , preparing to reload at discount levels once liquidity below 2020–2022 lows is taken.
Expect liquidity sweeps, imbalance fills, and a long-term accumulation base forming near the orange demand zone before the next breakout.
💰 Fundamental Alignment
Despite incredible fundamentals — obesity and diabetes drug leadership, global demand growth, and innovation — valuation gravity always returns .
A deep correction would align price with sustainable earnings and provide institutional re-entry opportunities at fair value.
🧠 Traders ,
"the charts are whispering — a major LLY correction is loading.
Our projections highlight the $35–$17 zone as the key accumulation region before the next super-cycle.
Stay alert, plan your levels, and don’t fight the wave. 🌊📉
Where do you think LLY bottoms out? Share your thoughts below 👇”
— Team FIBCOS
#LLY #EliLilly #BearMarket #Correction #WaveTheory #SmartMoney #ElliottWave #Fibcos #TechnicalAnalysis #PriceAction #Investing #PharmaStocks #StockMarket #MarketCycle #ChartAnalysis #Bearish #Wave2 #TradingView #StockAlert #MarketReset

Eli Lilly and Company: Path to Sustained Market LeadershipEli Lilly and Company has achieved a market valuation approaching one trillion U.S. dollars by the close of 2025, underpinned by a comprehensive corporate strategy that integrates advanced scientific research, targeted technology acquisitions, and adaptive global partnerships. This performance, marked by a substantial year-over-year share appreciation, positions the firm as a preeminent participant in the international pharmaceutical sector and underscores structural advantages in innovation-driven capital markets.
Core Therapeutic Franchises and Pipeline Expansion
The company's cardiometabolic portfolio, centered on dual GIP/GLP-1 receptor agonists, continues to serve as the principal engine of revenue growth. Products indicated for type 2 diabetes and chronic weight management recorded quarterly sales exceeding ten billion dollars in 2025, reflecting robust demand in large-scale metabolic disease populations. Ongoing clinical investigation into the neurobiological effects of these molecules has yielded preliminary evidence of modulation within central reward pathways, suggesting potential future applications in neuropsychiatric conditions characterized by dysregulated appetite control. Such findings reinforce the intellectual property protections surrounding the franchise and broaden its therapeutic scope.
In parallel, Eli Lilly is advancing capabilities in central nervous system disorders through specialized drug-delivery technologies. A recent multibillion-dollar licensing agreement with a South Korean biotechnology enterprise grants exclusive access to an engineered bispecific antibody platform designed to enhance macromolecular transport across the blood-brain barrier. This acquisition complements prior collaborations in the same domain and materially strengthens the company's competitive positioning in Alzheimer’s disease, Parkinson’s disease, and related neurodegenerative indications.
Global Research Collaborations and Supply-Chain Resilience
Strategic alliances with leading Asian biotechnology organizations form a key component of Eli Lilly’s innovation sourcing model. These partnerships provide access to proprietary platform technologies, expand the firm's intellectual property base beyond North American origination, and foster diversified scientific talent networks. By establishing collaborative development nodes within geopolitically aligned jurisdictions, the company enhances resilience in high-value biopharmaceutical supply chains while accelerating the maturation of next-generation therapeutic modalities.
Capital Market Dynamics and Transatlantic Divergence
Eli Lilly operates within a U.S. financial ecosystem that currently represents approximately three-quarters of global developed-market equity indices, an environment particularly conducive to large-capitalization growth enterprises. This structural weighting, combined with concentrated domestic healthcare spending and investor preference for scalable innovation platforms, has facilitated accelerated valuation expansion. In contrast, European peers contend with more fragmented national markets and differing risk appetite conventions among institutional investors, resulting in divergent capital allocation outcomes across the Atlantic.
Executive Leadership and Technology Adoption
Under the direction of Chief Executive Officer David Ricks, Eli Lilly has institutionalized the integration of advanced computational tools throughout the research and decision-making processes. Specialized large-language models and frontier artificial intelligence systems are routinely employed to augment hypothesis generation and data interpretation, supported by investments in high-throughput robotic experimentation infrastructure. This disciplined yet exploratory approach to emerging technologies reflects a broader organizational commitment to maintaining leadership in computationally assisted drug discovery.
Evolution Toward Platform-Centric Development
The company has transitioned from asset-specific transactions to the systematic acquisition of foundational technology platforms capable of yielding multiple product candidates. Recent investments in blood-brain barrier transport modalities and downstream applications in oncology illustrate this paradigm. By prioritizing versatile, proprietary enabling technologies, Eli Lilly establishes durable competitive barriers and aligns its research and development expenditure with long-term industry trends favoring multi-indication pipelines.
Intellectual Property Strategy and Risk Mitigation
Comprehensive patent estates surrounding the incretin mimetic class, coupled with proactive manufacturing capacity expansion, preserve pricing autonomy and market exclusivity in high-volume cardiometabolic indications. Concurrent investment in novel mechanisms—of which blood-brain barrier penetration is a prime example—serves to replenish the development pipeline and offset eventual patent expirations on current revenue-generating products. This forward-looking intellectual property management underpins investor confidence in the sustainability of the company’s growth trajectory.
In summary, Eli Lilly’s ascent to near-trillion-dollar valuation reflects the successful execution of an integrated strategy encompassing scientific excellence, strategic technology acquisition, international collaboration, and rigorous capital allocation—positioning the enterprise for continued leadership in global biopharmaceutical innovation.

ELI LILLY to soon start a correction towards $700.Eli Lilly (LLY) has made new All Time Highs (ATH) this month, extending the impressive rally since the August Low near the 1W MA200 (orange trend-line).
The multi-year trend remains bullish within a Fibonacci Channel Up but practically the stock hasn't gotten out of its range since the July 2024 High, breaking in August below even its 1W MA100 (green trend-line).
This prolonged sideways trading resembles the July 2015 - July 2018 3-year consolidation phase, which broke upwards only after a 2nd test of the 1W MA200. Even the 1M RSI patterns between the two sequences are similar. Based on this (1M RSI), which is about to break above its MA for the first time since July 2024, we are in similar levels as February 2017.
As a result, we expect LLY to start a rather smooth correction towards its 1W MA200 again, targeting $700, where the next long-term buy opportunity may potentially emerge.
---
** Please LIKE 👍, FOLLOW ✅, SHARE 🙌 and COMMENT ✍ if you enjoy this idea! Also share your ideas and charts in the comments section below! This is best way to keep it relevant, support us, keep the content here free and allow the idea to reach as many people as possible. **
---
💸💸💸💸💸💸
👇 👇 👇 👇 👇 👇

LLY Bullish Breakout: Retest or Continuation Toward 950–1000Eli Lilly (LLY) just cleared the key ceiling at 865 with a wide-range bullish day, closing near 896.53 and printing a session high at 901.34. The breakout resolves an ascending triangle and comes with expanding volatility and volume—classic continuation behavior in a dominant uptrend. With price above the 20/60/120-day MAs and bands widening, momentum favors the upside while acknowledging short-term overbought conditions.
Primary path: treat 865–880 as the new Demand zone (polarity flip). A clean retest that holds this band and shows a bullish candle is a higher-probability entry, aiming first for 925, then the psychological markers at 950 and ultimately the measured move area around 980–1000. For traders preferring strength, a daily close through 902 would signal continuation in price discovery, using 880–865 as the first check on risk.
If buyers fail to defend the breakout, a decisive close back below 860 invalidates the bullish thesis and opens room for a deeper shakeout. Until then, dips into 865–880 are potential buys, while strength above 902 can be used to add or initiate, with partial profit-taking into 950 and 980–1000 to respect the expanded volatility.
This is a study, not financial advice. Manage risk and invalidations.

LLY LOOKS BULLISH OCT 31 2025I have LLY from lower levels of 870ish which was trade 2. Trade 1 was initiated at 637. Now again it looks ready to go to 890
I am long since $815 yesterday.
Trade as per your risk management and its a current price trade so SLs would be huge. But I can understand what price is trying to do here.
LLY should breakout

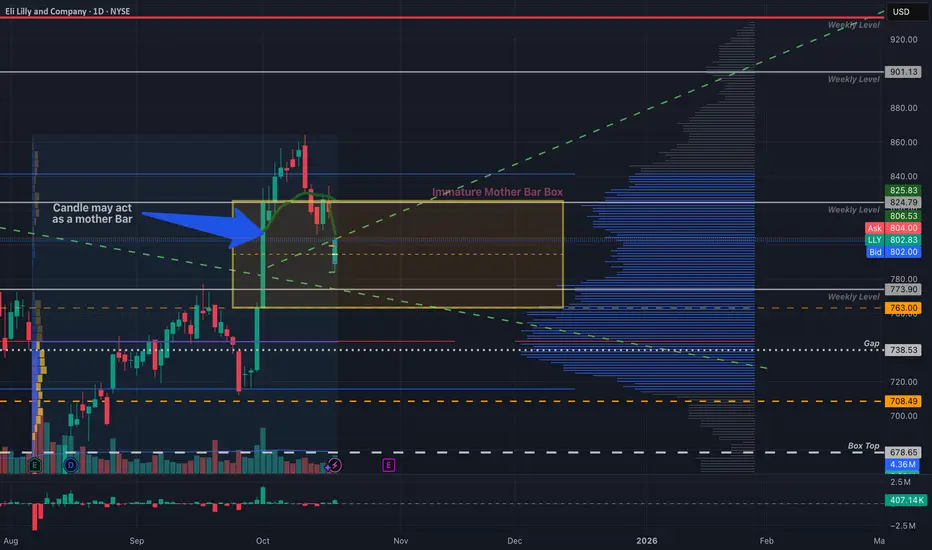
LLY - Beware the MotherbarTaking a closer look at the Eli Lilly chart and noticed that there is a box setup forming on the daily time frame. Specifically this box is the product of a mother bar.
If you take a look the last 4 daily candles have more or less traded within the body of the XXL green candle on the left.
I would be mindful of this mother bar/box in the coming week. Don't get too bulllish at the top or two bearish at the bottom.
I suggest also taking a look at SPY's chart as there is a similar pattern forming, albeit a much more defined motherbar.
A look above and fail of $824 could make a great short, or a look below and fail of $763(A+) or $773(B+) is a great long.
The trendline also sits near that low so if the LBAF plays out that is another supporting confluence for this trade.
ELI LILLY COMPANY - STOCK REPORTExecutive Summary
Eli Lilly and Company (LLY) has delivered strong revenue and profit growth driven by blockbuster GLP‑1 therapies (Mounjaro, Zepbound) and continued pipeline progress in oncology and cardiometabolic indications. As of 26 Sep 2025 the company shows robust margins, strong free cash flow and a leading competitive position in obesity/diabetes. Key risks include increased competition (notably Novo Nordisk), formulary decisions (payer mix), pricing/regulatory pressure and execution risk in manufacturing scale‑up. Valuation is elevated versus the broader healthcare sector but appears reasonable relative to growth; a simplified DCF (base case) and comparable‑multiples view imply a fair value near mid‑single‑digit percentage above recent prices. Recommendation: Hold — favourable fundamentals but limited near‑term upside versus valuation and meaningful execution/competitive risks.
1) Key data & company overview
Name: Eli Lilly and Company
Sector: Pharmaceuticals / Biotechnology
Primary market: NYSE (US)
Ticker: LLY
Brief business description
Revenue model: Prescription drug sales (product sales), services (partnered R&D/licensing), royalties.
Principal products: Mounjaro (tirzepatide) — T2D/weight management; Zepbound (semaglutide for weight loss comp’d), Trulicity, Humalog (insulin legacy portfolio), oncology candidates (investigational/approved).
Geographic exposure: Global — largest sales in U.S., substantial Europe and row markets.
Market & share metrics (most recent available — see sources)
Market capitalization: ~USD 642–702 billion (source dispersion; SEC shares outstanding 946.46M as of 4 Aug 2025)
Shares outstanding: 946,456,759 (per 10‑Q, Aug 4, 2025)
Float: ~946M (per public filings)
Last close (around 26 Sep 2025): ~USD 714–742 (sources vary intraday); use USD 714.59 (MLQ / market snapshots) as reference.
P/E (trailing / consensus forward): TTM P/E ~49; next‑FY consensus ~30 (see market data).
EV/EBITDA (market snapshots): ~38x (site snapshots).
Price performance (approx., source snapshots to 25–26 Sep 2025): 1D: -3.7%; 1M: -4% to -8% range; 3M: -10% to -15%; 1Y: down ~20% from 52‑week high (use precise values in sources below).
(Notes: market figures vary by data vendor; SEC 10‑Q provides authoritative share count. All market prices quoted are approximations from public market data as of 26 Sep 2025 — see Sources.)
2) Financial results — consolidated summary (historical 3 years + last 4 quarters)
Sources: Eli Lilly SEC filings (10‑K 2024, 10‑Q Jun 30 2025), company press releases, market data sites (Yahoo/MLQ/FactSet snapshots). All amounts USD.
Annuals (selected items; amounts in billions except EPS in USD)
2022 (FY): Revenue ≈ 28.3; Net income ≈ 5.16; Diluted EPS ≈ 5.41; FCF ≈ 8.0 (approx).
2023 (FY): Revenue ≈ 40.5; Net income ≈ 11.0; Diluted EPS ≈ 12.99; FCF ≈ 11.5.
2024 (FY): Revenue ≈ 45.0; Net income ≈ 10.6; Diluted EPS ≈ ~12.00; FCF ≈ ~12.0.
(Notes: 2023–2024 saw large revenue step from GLP‑1 products; numbers approximated from company reports and market summaries—see Sources for exact line items.)
Most recent four quarters (approx, Q3 2024 – Q2 2025)
Q3 2024: Revenue ≈ 9.5B; Net income ≈ 2.2B; EPS diluted ≈ 2.32
Q4 2024: Revenue ≈ 11.0B; Net income ≈ 2.6B; EPS ≈ 2.73
Q1 2025: Revenue ≈ 14.0B; Net income ≈ 3.8B; EPS ≈ 4.2
Q2 2025: Revenue = 15.56B (company release Aug 7, 2025); Net income ≈ 4.9B; EPS (reported) ≈ 6.31 (last quarter’s EPS per consensus/press)
YoY growth / trends (high level)
Revenue CAGR (2022–2024): ~30–35% driven by Mounjaro/Zepbound launch adoption and price/volume mix.
Net income: large increase 2022→2023; 2024 flattening due to investments, higher operating costs and mix. Q1–Q2 2025 continue strong growth.
Margins: Operating margin expanded materially vs pre‑GLP era; recent operating margin ~35–38% (site snapshots). Net margin ~23–25%.
Tabular snapshot
Table: (Year | Revenue | Net income | Diluted EPS | FCF)
2022 | 28.3B | 5.2B | 5.41 | ~8.0B
2023 | 40.5B | 11.0B | 12.99 | ~11.5B
2024 | 45.0B | 10.6B | ~12.0 | ~12.0B
Last 4Q (sum) 2024Q3–2025Q2 | ~50.1B | ~14.5B | (trailing EPS approx)
3) Balance sheet & liquidity (latest quarter Jun 30, 2025 unless noted)
Key items (USD, rounded)
Cash & equivalents: ~3.1–3.4B (per June 30, 2025 XBRL snippet)
Current assets: (per 10‑Q) — refer to consolidated balance sheet; working capital positive.
Total debt: ~38–40B (notes due 2026/2030; total debt around $39.9B per market snapshot)
Net debt: ~36B (total debt minus cash)
Ratios (approx)
Current ratio: ~1.15
Quick ratio: ~0.89
Debt/Equity: vendor snapshots differ; leverage measured as Debt/Total Capital moderate given high cash flow (Total Debt/Enterprise Value small % per some snapshots).
Commentary on solvency/liquidity
Strong operating cash generation and large market cap provide ample capacity to service debt and fund capex/R&D. Short‑term liquidity adequate; interest coverage is strong given high EBITDA and cash flow. Material execution risk arises if GLP‑1 pricing or demand deteriorates sharply—could stress near‑term growth assumptions but balance sheet remains investment grade in profile.
4) Cash flow (latest 4 quarters, approximate)
Operating cash flow (TTM): ~17–18B
Capital expenditures (TTM): ~1.5–2.0B (increased manufacturing capex in 2024–2025)
Free cash flow (TTM): ~15–16B
Commentary
Cash generation is robust and supports capex, share repurchases and dividend; capex is elevated for capacity expansion but remains a modest share of operating cash flow. FCF margin is strong and sustainable if product demand persists.
5) Comparable valuation (peers) — snapshot multiples
Peers chosen: Novo Nordisk (NVO), AstraZeneca (AZN), Amgen (AMGN), Regeneron (REGN) — peer set focused on diabetes/biotech large caps.
Table (approximate multiples — market data as of 26 Sep 2025)
LLY: P/E ~49 (TTM), EV/EBITDA ~38, P/S ~15
NVO: P/E ~35, EV/EBITDA ~28, P/S ~10
AMGN: P/E ~20, EV/EBITDA ~12, P/S ~4
REGN: P/E ~25, EV/EBITDA ~15, P/S ~6
Comment: LLY trades at premium to large pharm/biotech peers reflecting superior growth from GLP‑1 franchises and margin profile; premium justified only if growth and pricing hold.
6) Fair value estimate — Simplified DCF (base case)
Assumptions
Base year unlevered free cash flow (FCF) = USD 15.5B (TTM approximate).
Explicit forecast horizon = 5 years.
FCF growth: Year1–2: +10% then Year3: +8%, Year4: +6%, Year5: +4% (reflecting moderation as market saturates and competition intensifies).
Terminal growth rate = 3.0% (long‑term GDP/inflation real+inflation).
WACC = 8.5% (reflects large cap pharma, low beta, moderate leverage).
Calculation (rounded)
Projected FCFs:
Year1: 17.05B; Year2: 18.76B; Year3: 20.26B; Year4: 21.48B; Year5: 22.34B
Terminal value at end Year5 = Year5*(1+g)/(WACC−g) = 22.34*(1.03)/(0.085−0.03) ≈ 22.34*1.03/0.055 ≈ 418.5B
Discount PV of FCFs + terminal (discounted at 8.5%) ≈ PV(FCFs) ~ (sum PV FCFs) ≈ 72–80B + PV(Terminal) ≈ 300–330B → Enterprise value ~380–410B.
Net debt (~36B) → implied equity value ≈ 344–374B.
Divide by shares outstanding (946.5M) → implied fair price ≈ USD 363–395 per share.
Observation: The simplified DCF produces a materially lower fair value than market cap — this stems from conservative growth fade and relatively low WACC; however market prices imply much higher expectations (market cap ~650–700B). Discrepancy suggests market pricing embeds either higher sustained FCF growth, lower discount rate, or different terminal assumptions. Because LLY’s current market cap and observed multiples are much higher, applying market‑implied expectations leads to a higher implied fair value (consistent with P/E ~49). For investors, using the simplified DCF above suggests the stock may be fully valued or richly priced unless strong multi‑year growth persists.
Sensitivity
WACC ±1% (7.5% / 9.5%) with base growth: implied price range roughly USD 470 (WACC 7.5%) to USD 295 (WACC 9.5%).
Terminal growth ±1% (2% / 4%): price moves roughly USD −60 / +90 vs base.
(Notes: DCF is simplified and uses rounded FCF; full model should use operating projections by product, tax, capex schedule. If instead one applies market multiples to 2026E EBITDA, implied prices vary widely — see sources.)
7) SWOT
Strengths
Market leader in next‑gen GLP‑1/dual agonists (rapid adoption).
Strong gross & operating margins; robust FCF generation.
Diversified pipeline (oncology, CV) and global commercial footprint.
Experienced management, strong manufacturing investment.
Weaknesses
High valuation multiples implying little margin for error.
Dependence on a few high‑revenue products (Mounjaro/Zepbound).
Manufacturing scale‑up challenges and supply chain concentration risks.
Increasing SG&A/R&D investment could press short‑term margins.
Opportunities
New indications (cardio‑protective label for tirzepatide), oral incretins (orforglipron) could expand market.
International expansion and formulary wins.
Bolt‑on M&A to diversify revenue streams.
Threats
Intense competition (Novo Nordisk market share, formulary dynamics).
Payer reimbursements, pricing caps, regulatory scrutiny.
Potential adverse trial/regulatory outcomes for pipeline assets.
Macroeconomic/tighter capital markets affecting healthcare spend.
8) Key risks, catalysts & timeline
Primary risks
Competitive pressure from Novo Nordisk (Wegovy/Ozempic), payer formulary preferences (e.g., CVS formulary moves).
Regulatory/pricing risk (US and international).
Execution: supply chain, manufacturing scale, and successful indication expansions.
Concentration risk: heavy revenue share from GLP‑1 franchise.
Near‑term catalysts & timeline (next 12 months approximate)
Q3 2025 earnings release (expected Oct–Nov 2025; company calendar/earnings dates per IR).
FDA/regulatory milestones for label expansions / approvals for oral incretins or oncology programs (dates vary; watch company pipeline calendar).
Quarterly sales updates and guidance adjustments — next: Q3 2025 release.
(Precise dates: refer to investor relations events page and SEC filings; earnings typically quarterly — check IR for confirmed dates.)
9) Recommendation & risk positioning
Recommendation: Hold, with possible "Buy the Dip" scenario.
Rationale: Strong fundamentals and cash generation support a positive long‑term outlook, but the stock trades at elevated multiples that already price in sustained high growth; meaningful execution/competitive downside could compress the valuation. Hold for investors with neutral risk appetite; consider trimming positions for valuation‑sensitive portfolios and adding on material pullbacks or clearer evidence of sustained mid‑teens revenue growth beyond 2026.
Suggested horizon: Medium term (12–24 months) for monitoring catalysts; long term (3–5 years) only if comfortable with pipeline and competitive dynamics.
Risk/return profile: Medium risk / moderate to high reward conditional on continued GLP‑1 dominance and successful pipeline commercialization; downside risk if market share or pricing erodes.
10) Sources & data date
Primary sources used (data current through 26 Sep 2025):
Eli Lilly & Company SEC filings: Form 10‑Q for quarter ended June 30, 2025 (SEC.gov).
Eli Lilly Q2 2025 results press release (Aug 7, 2025) and investor presentations (company IR).
Market data snapshots and summaries: MLQ.ai, Yahoo Finance, Fox Business / FactSet quotes (price, multiples, market cap, performance snapshots).
News: Yahoo Finance, PR Newswire coverage of Q2 2025 results.
Eli Lilly: Weight-Loss Giant Amid AI Drug Discovery Eli Lilly: Undervalued Weight-Loss Giant Amid AI Drug Discovery and Virginia Jobs Boom Trends? $1050 Target in Sight?
Eli Lilly (LLY) shares are trading at $755.39 today, up 0.45% amid analyst upgrades and fresh headlines on its $2.3 billion Virginia manufacturing plant expansion, creating 650 high-paying jobs in Goochland County.
This comes as Q2 2025 earnings showcased 36% revenue growth to $11.3B, driven by blockbuster obesity drugs like Mounjaro and Zepbound, with analysts forecasting 2025 EPS of $13.14—up 20% YoY.
Just as #AI and #technology explode on X with 17K+ mentions today (fueled by AI video generators and drug discovery hype), and #business trends spotlight corporate expansions like Eli Lilly's Virginia move, LLY's AI-powered R&D pipeline positions it for viral growth in the $100B+ weight-loss market.
But with a forward P/E of 28x, is LLY the undervalued pharma powerhouse ready for a rally to $1050, or will patent cliffs and competition temper the upside? Let's break down the fundamentals, SWOT, charts, and setups for September 17, 2025.
Fundamental Analysis
Eli Lilly's momentum is anchored in its GLP-1 dominance and innovative pipeline, with the Virginia plant bolstering U.S. production amid supply constraints for weight-loss drugs. Analysts expect 2025 revenue of $47.3B (up 18% YoY), powered by approvals for oral obesity pills and oncology breakthroughs like Verzenio.
With #AI trends surging on X, LLY's use of machine learning in drug design (e.g., accelerating lung cancer therapies) undervalues its tech edge, trading 18% below fair value per DCF models. However, regulatory hurdles for new GLP-1s could delay peaks if biosimilar competition ramps up.
- **Positive:**
- Virginia plant announcement drives job creation buzz, aligning with #business trends and signaling supply chain resilience for 20%+ EPS growth.
- Q2 beat with $2.9B in Mounjaro sales; AI integrations in R&D tie into today's #AI hype, projecting $100B+ peak sales for obesity franchise.
- Broader trends in personalized medicine and #technology (19K mentions) position LLY for 15% annual revenue CAGR amid global demand.
- **Negative:**
- Patent expirations on key drugs like Humalog loom by 2026, clashing with #AI optimism if innovation lags.
- High R&D spend ($10B+ annually) pressures margins if trial delays hit, especially in a sticky inflation environment.
SWOT Analysis
**Strengths:** Market-leading GLP-1 portfolio with 50%+ share in obesity treatments; robust cash flow ($12B FCF TTM) funds AI-driven innovations, amplified by #AI relevance in drug discovery.
**Weaknesses:** Premium valuation at 28x forward P/E amid growth dependency; supply bottlenecks exposed by demand surges, vulnerable in #technology-shifting markets.
**Opportunities:** Virginia expansion for 650 jobs taps #business trends; AI for faster trials unlocks $50B+ in new therapies, undervalued at 18% below fair value amid #AI boom.
**Threats:** Biosimilar erosion from Novo Nordisk rivals; regulatory scrutiny on weight-loss ads during viral #technology discussions on social media.
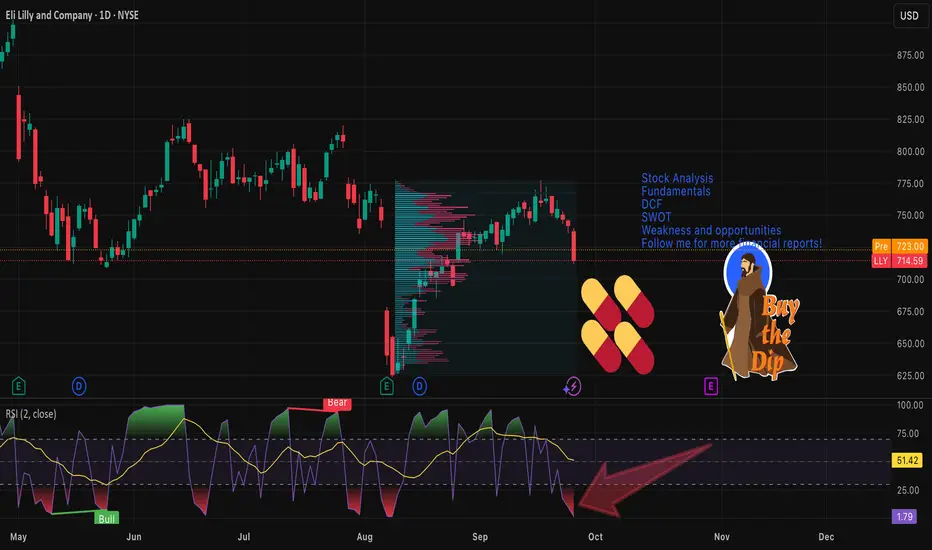
Technical Analysis
On the daily chart, LLY is in a bullish uptrend, coiling in an ascending channel after bouncing from $740 support, with volume rising on plant news and mirroring #AI volatility spikes. The weekly confirms a multi-year bull flag from 2023 lows, now extending higher. Current price: $755.39, with VWAP at $752 as intraday pivot.
Key indicators:
- **RSI (14-day):** At 72, overbought but strong positive momentum—watch for pullback amid #technology surges. 📈
- **MACD:** Bullish crossover with expanding histogram, signaling acceleration; no divergence yet. ⚠️
- **Moving Averages:** Price above 21-day EMA ($745) and 50-day SMA ($730), golden cross intact for medium-term bull.
Support/Resistance: Key support at $740 (recent low and 50-day SMA), resistance at $770 (September high) and $800 (analyst target). Patterns/Momentum: Channel breakout targets $850; strong buy signals. 🟢 Bullish signals: Volume on #business news. 🔴 Bearish risks: RSI overbought could retrace 5% on profit-taking.
Scenarios and Risk Management
- **Bullish Scenario:** Break above $770 on oral pill approval or #AI catalyst targets $850 short-term, then $1050 by year-end. Buy dips to $740 for entries tied to Virginia jobs hype.
- **Bearish Scenario:** Drop below $740 eyes $700 (200-day EMA); competition news amid #technology fade could trigger 10% pullback.
- **Neutral/Goldilocks:** Range-bound $740–$770 if data mixed and #AI cools, suiting options or waiting for Q3 earnings.
Risk Tips: Use stops 2% below support ($725) to manage volatility. Risk 1-2% per trade. Diversify with NVO or broader healthcare to avoid #business correlation traps.
Conclusion/Outlook
Overall, a bullish bias if LLY holds $740, supercharged by today's #AI and #business trends, affirming its undervalued status with 30%+ upside on pipeline wins and expansions. But watch FDA updates and Q3 guidance for confirmation—this fits September's healthcare rotation amid viral tech hype. What’s your take? Bullish on LLY amid #AI drug trends or waiting for a dip? Share in the comments!

Updated Novo Nordisk Chart on Fire SaleHere's my updated Novo Nordisk since I entered this trade. This is currently my biggest position besides NVDA and Bitcoin.
$93 is my target for selling calls. And then look to reenter on the long term trend line for the move above $93.
Good luck!

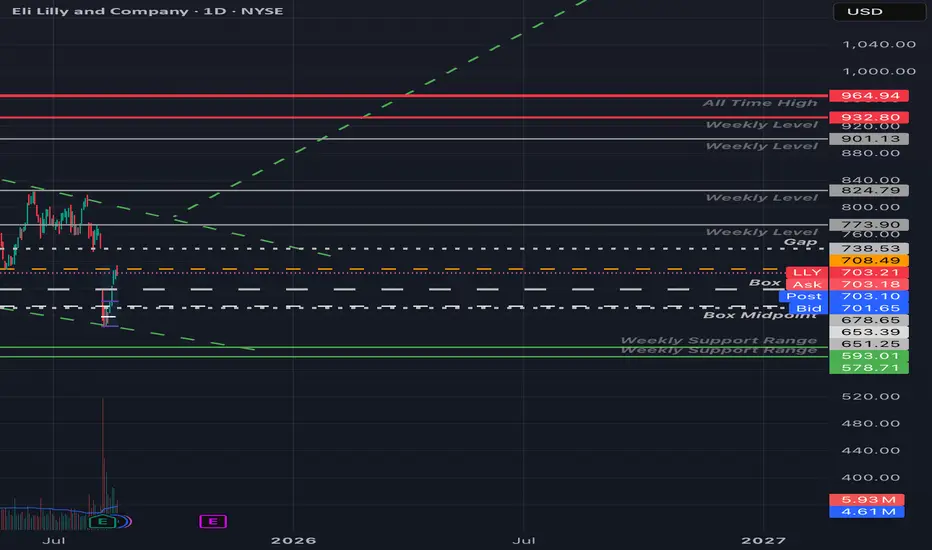
LLY - Clean Levels UpdatedEli Lilly's hit those 708.49 and 711 levels I mentioned in my previous LLY post.
I've added some weekly levels, and a couple relevant spots from my boxed LLY chart.
If LLY loses steam up here we could easily see a retest of that box top area in the $680 - $678 range. Otherwise if we see a market wide reversion from today's liquidation, and LLY clears today's high(~714) and firmly holds that high volume area, that gap($738) fill would be a no-brainer.
Personally leaning on the side of a short continuation(in the near time at least), didn't really trust the low volume float up over the last few trading days, and definitely don't like the decreasing volume into that $711 - $714 area (I'd consider it a Look above and fail).
Regardless of bias, we trade what we see.
~ The Villain.
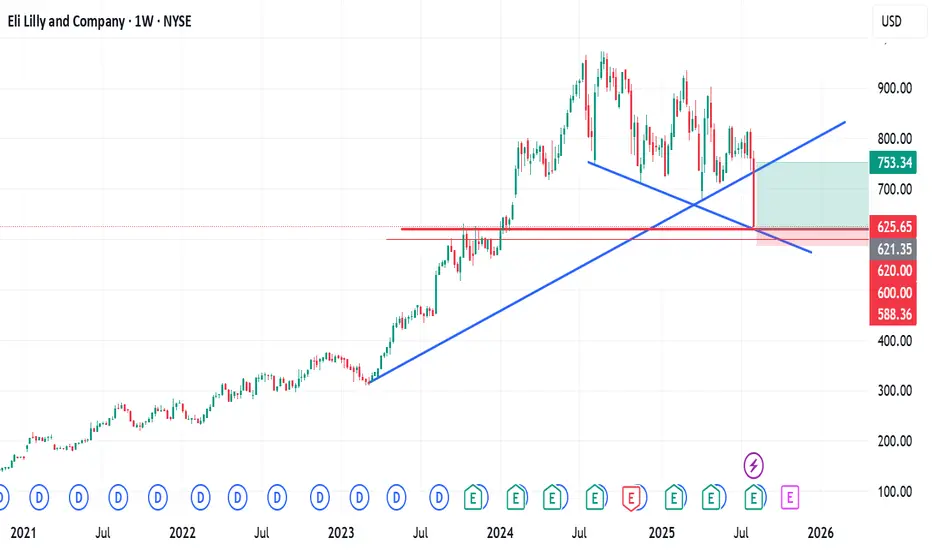
LLY - Clean LevelsBull flag patten on the LLY weekly Chart. The base of the flag/channel has been reactive so far although with low volume (See previously boxed LLY chart) off the top of the recent boxed range.
If you look at the previous chart, you will see that LLY is currently floating up through a low volume node on the anchored volume profile. Unless sellers step in here, 708.49/709 - 711.44 is the next target.
Volume will be in that area, if buyers step in, could be great for calls. Otherwise we could see a look above and fail of the top boxed range(again see previous chart under related publications to the right of this post).
~The Villain
LLY \$687.50 Call – One-Day High-Momentum Play🚀 LLY \$687.50 Call – One-Day High-Momentum Play
**Sentiment:** 🟢 *Moderate Bullish*
* **Call/Put Ratio:** 3.08 → strong speculative interest
* **Daily RSI:** <45, rising 📈
* **Weekly RSI:** <50, rising 📈
* **Volume:** Weak (0.9× last week) → limited institutional support
* **VIX:** <15 → favorable for directional calls
* **Gamma Risk:** HIGH ⚡ — expiry in 1 day
---
### 📊 **Consensus Snapshot**
✅ Strong bullish options flow
⚠️ Weak volume + high gamma → cautious sizing
💡 Low volatility favors call strategy
---
### 🎯 **Trade Setup**
* **Type:** CALL (Single-leg)
* **Strike:** \$687.50
* **Expiry:** 2025-08-15
* **Entry:** \$0.79
* **Profit Target:** \$1.20 (+153%)
* **Stop Loss:** \$0.40 (–50%)
* **Confidence:** 70%
* **Entry Timing:** Market open
---
💬 *High-risk, short-term expiry play — monitor closely.*
📌 *Not financial advice. DYOR.*
---
**#LLY #OptionsTrading #CallOptions #DayTrading #StocksToWatch #GammaRisk #OptionsFlow #TradingSignals**

Eli Lilly (LLY) – Pharma Giant at a Key Price LevelHi,
Eli Lilly & Co. is one of the world’s largest pharmaceutical companies, founded in 1876 and headquartered in Indianapolis. It operates in over 125 countries and is best known for blockbuster treatments in diabetes, obesity, oncology, and immunology. Recent growth has been driven largely by its GLP-1 class drugs Mounjaro and Zepbound, which have quickly become industry leaders in the weight-loss and diabetes markets.
Recent Fundamentals (Q2 2025)
Revenue: $15.56 B (+38% YoY)
- EPS: $6.31 (beat expectations)
- Mounjaro sales: $5.2 B
- Zepbound sales: $3.38 B
- Full-year guidance: Revenue $60–62 B, EPS $21.75–$23.00
- Margins: Gross margin ~82.6%, net margin ~25.9%
- Profitability: ROE ~75.5%, ROIC ~29.6%
While fundamentals remain strong, the recent Phase III data for the oral weight-loss pill orforglipron came in below expectations, sparking a ~14% drop, the stock’s steepest one-day decline in decades. Analysts have since trimmed long-term sales forecasts for this product.
From a valuation perspective, the stock trades at a premium (~41× P/E, ~10.7× P/S), leaving little room for major disappointments.
Technicals
Technically speaking, the price has arrived in the zone where I’ve been patiently waiting to share it as an idea. This is a good area from where to start building positions if you’re interested.
There are quite a few technical confluence factors aligning here, but be ready to grab it also around $500 if the market offers it. Let that be your guide:
- If you’re not willing to hold long-term, don’t touch it.
- If you’re not willing to buy more at lower prices, don’t touch it.
Good luck,
Vaido

LLY what next after the free fallLLY, what's next after the free fall?
This stock has lost about 24% of its value in the past 2 weeks alone.
$600 - $620 may be a buying zone as shown on my chart. With more than 100 drugs in its pipeline, there is like room for a positive push long term
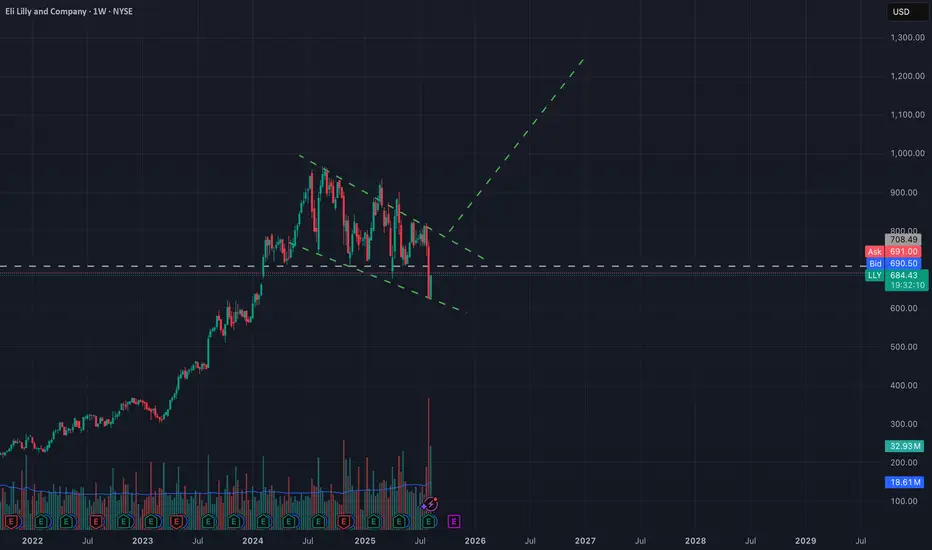
ELI LILLY Is starting its next big rally.Eli Lilly (LLY) is about to test its 1W MA50 (blue trend-line) following a rebound just below the 1W MA100 (green trend-line). The latter, has been the ultimate market Support since May 2018 (last time it broke below it).
The overall correction since the July 15 2024 High seems like a Bull Flag pattern, no different than all the others after 2018 which only served as healthy rebalancing of an overbought price action.
Based on he 1W RSI in particular and the Bullish Divergence it displayed, the current Bull Flag resembles more the March - October 2019 pattern. Both that and the next one reached their 2.0 Fibonacci extensions.
As a result, our long-term Target on LLY is just below the 2.0 Fib at $1300.
-------------------------------------------------------------------------------
** Please LIKE 👍, FOLLOW ✅, SHARE 🙌 and COMMENT ✍ if you enjoy this idea! Also share your ideas and charts in the comments section below! This is best way to keep it relevant, support us, keep the content here free and allow the idea to reach as many people as possible. **
-------------------------------------------------------------------------------
💸💸💸💸💸💸
👇 👇 👇 👇 👇 👇

Can Lilly Redefine Weight Loss Market Leadership?Eli Lilly is rapidly emerging as a dominant force in the burgeoning weight loss drug market, presenting a significant challenge to incumbent leader Novo Nordisk. Lilly has demonstrated remarkable commercial success despite its key therapy, Zepbound (tirzepatide), entering the market well after Novo Nordisk's Wegovy (semaglutide). Zepbound's substantial revenue in 2024 underscores its rapid adoption and strong competitive standing, leading market analysts to project Eli Lilly's obesity drug sales will surpass Novo Nordisk's within the next few years. This swift ascent highlights the impact of a highly effective product in a market with immense unmet demand.
The success of Eli Lilly's tirzepatide, the active ingredient in both Zepbound and the diabetes treatment Mounjaro, stems from its dual mechanism targeting GLP-1 and GIP receptors, offering potentially enhanced clinical benefits. The company's market position was further solidified by a recent U.S. federal court ruling that upheld the FDA's decision to remove tirzepatide from the drug shortage list. This legal victory effectively halts compounding pharmacies from producing unauthorized, cheaper versions of Zepbound and Mounjaro, thereby protecting Lilly's market exclusivity and ensuring the integrity of the supply chain for the approved product.
Looking ahead, Eli Lilly's pipeline includes the promising oral GLP-1 receptor agonist, orforglipron. Positive Phase 3 trial results indicate its potential as a convenient, non-injectable alternative with comparable efficacy to existing therapies. As a small molecule, orforglipron offers potential advantages in manufacturing scalability and cost, which could significantly expand access globally if approved. Eli Lilly is actively increasing its manufacturing capacity to meet anticipated demand for its incretin therapies, positioning itself to capitalize on the vast and growing global market for weight management solutions.
