LNG Week 52: -158 BCF Draw Deepens as Winter Demand Bites* Due to the platform's features, the charts are arranged in sequence from left to right, from the first to the eighth chart. The charts were created by our team and based on an analysis from Bloomberg and the EIA data. This analysis was conducted in cooperation with Anastasia Volkova, analyst of LSE.
The natural gas market closes out Week 52 with continued winter pressure, as a forecast -158 BCF storage withdrawal for Week 51 (December 19) pushes inventories to 3,420 BCF-125 BCF below 2024 and 70 BCF under the 5-year average. The F26 contract expires with heightened volatility above the upper interquartile range, while the forward curve stabilizes long-term but diverges near-term. HDD+CDD values surge to 30-year highs before easing, driving demand amid stable production.
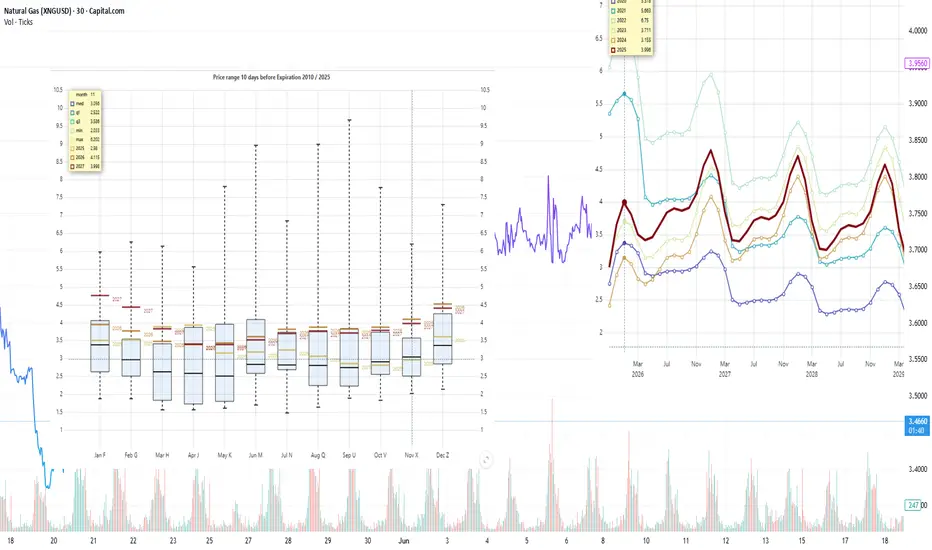
Current prices compared to price dispersion 10 days before expiration, by month since 2010
The last days before the expiration of the F26 contract are marked by increased volatility, as in many historical years. The current price has significantly exceeded the upper limit of the historical interquartile range 10 days before expiration (exceeding the 75th percentile and approaching historical highs). This may signal strong buyer pressure or a change in market expectations, but it also increases the risk of a downward correction to the historical norm.
Forward curve compared to 2020-2025
The shape of the 2025 forward curve on nearby contracts is practically consistent with the 2023–2024 ranges, while the nearby F26 contract shows significant volatility.
Current stocks and forecast for next week compared to 2020-2024
According to the forecast for week 51 (EIA report for the week ending December 19), a series of significant withdrawals is expected to continue. Gas stocks in underground storage facilities will decrease by -158 BCF, which is 35 BCF below the average for the past five years. At the same time, stock levels will reach 3,420 BCF, which is 125 BCF below the 2024 level and 70 BCF below the five-year average.
HDD+CDD based on current NOAA data and forecast for the next two weeks compared to 1994-2024
Currently, the total HDD + CDD (heating and cooling degree days) indicators for all climatic regions of the United States are at the lower end of the range. According to meteorological models, the weather in the next two weeks will be within the average and moderately warm ranges of the 30-year climate norm.
Daily supply/demand difference compared to 2014-2024
On December 24, the difference between supply and demand in 2025 continues to decline after abnormal growth and has fallen below the lower interquartile range for 2014-2024.
Number of days for delivery from warehouses
The graph shows the number of days of supply from storage alone, based on current consumption levels. As of December 24, reserves are sufficient for approximately 30 days, which is one day higher than in 2024, two days lower than the average, and remains stable around the average.
Filling level of European storage facilities
The overall level of gas storage in Europe on December 24 continues to decline and stands at 66.1% (-2.7% for the week), which is 9.8% below the average level and 9.2% lower than last year. The lowest storage levels are observed in Croatia (41.7%), Latvia (50%), Denmark (52.9%), and the Netherlands (53.5%). The maximum levels are in Sweden (102%), Portugal (93.5%), Poland (85.7%), Romania (78.8%), and Italy (76.5%).
Electricity generation by source
Compared to last week, gas generation in the US48 energy balance fell by 3% on December 24, 2025, remaining in the middle range at 35.9% of the total. The share of nuclear generation increased by 2.8% to 20.8% and is in the middle range. The share of coal generation fell by 2.5% and is close to its 5-year low of 16.8%. The share of wind generation fluctuated significantly over the past week, reaching 17.5% and settling at 13.9%. Solar generation accounts for 3.5% of the total.
LNG

LNG Week 51: 185 BCF Draw – Winter Demand Outpaces Supply*Due to the platform's features, the charts are arranged in sequence from left to right, from the first to the ninth chart. The charts were created by our team and based on an analysis from Bloomberg and the EIA data. This analysis was conducted in cooperation with Anastasia Volkova, analyst of LSE.
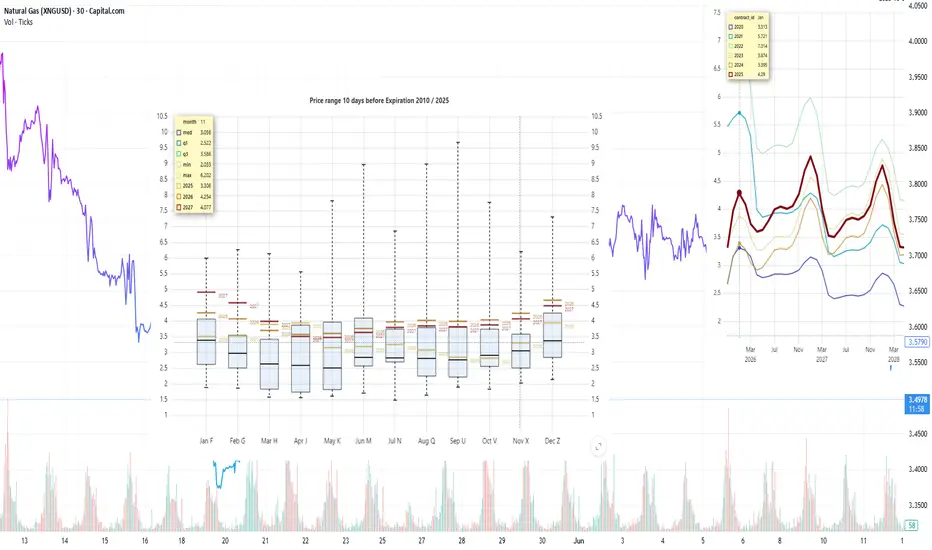
Current prices compared to price dispersion 10 days before expiration by month since 2010
The US natural gas market in December 2025 is characterized by high volatility: prices initially rose sharply due to cold weather at the beginning of the month, reaching a three-year high, but then fell amid milder weather forecasts for the end of December. The main factors are heating demand, inventories, record LNG exports, and stable production.
Forward curve compared to 2020-2025
The shape of the 2025 forward curve on nearby contracts is moving even closer to the 2023–2024 ranges. Despite high volatility on nearby contracts, contracts with delivery in two years and beyond continue to show clear price stabilization at historically stable levels.
Current stocks and forecast for next week compared to 2020-2024
According to the forecast for week 50 (EIA report, December 12), a second consecutive significant withdrawal is expected. Gas stocks in underground storage facilities will decrease by a record -185 BCF, which is significantly lower than the average for the past 5 years by 125 BCF. At the same time, stock levels will reach 3560 BCF, which is 74 BCF lower than the 2024 level and 28 BCF lower than the 5-year average.
HDD+CDD based on current NOAA data and forecast for the next two weeks compared to 1994-2024
Currently, the total HDD + CDD (heating and cooling degree days) indicators for all climatic regions of the United States are declining after peaking on December 15-16. According to meteorological model forecasts, the weather in the next two weeks will be within the average and moderately warm ranges of the 30-year climate norm.
HDD+CDD based on current NOAA data and forecast compared to 1994-2024 by region
As of December 17, no significant increase in the number of degree days is expected in the coming week across regions.
Daily supply/demand difference compared to 2014-2024
On December 17, the difference between supply and demand in 2025 declines after abnormal growth and approaches the upper interquartile range for 2014–2024.
Number of days for delivery from warehouses
The graph shows the number of days of supply from storage alone, based on current consumption levels. As of December 17, reserves are sufficient for ≈26 days, which is 5 days less than in 2024, 7 days below the average, and in the lower minimum range for the past 10 years. With this level of reserves and consumption, even minor disruptions in production or spikes in demand could cause strong price reactions, especially in late winter and early spring.
Filling level of European storage facilities
The overall fill rate of European gas storage facilities continued to decline on December 17, reaching 68.8% (-2.7% over the week), which is 9.9% below the average fill rate and 8.7% lower than last year.
Electricity generation by source
Compared to last week, gas generation in the US48 energy balance on December 17, 2025 fell to an average of 38.5% of the total, the share of nuclear generation fell below a 5-year low to 18%, and the share of coal generation remained at an average of 19.3%. The share of wind (12.6%) and solar (3.9%) remained virtually unchanged compared to last week.

Natural Gas Week 50: -183 BCF Draw – Coldest Start in Years*Due to the platform's features, the charts are arranged in sequence from left to right, from the first to the ninth chart. The charts were created by our team and based on an analysis from Bloomberg and the EIA data. This analysis was conducted in cooperation with Anastasia Volkova, analyst of LSE.
Natural gas entered Week 50 with a historic shift, as the EIA reports a record 183 BCF storage withdrawal for Week 49 (December 5), crushing the 5-year average draw of -72 BCF and leaving inventories at 3,740 BCF-34 BCF below 2024 but still 56 BCF above the median. Cold weather and peak LNG exports earlier drove January futures above $5/MMBtu, but softening forecasts for mid-December have triggered profit-taking, easing near-term prices while 2026-27 contracts hold above the interquartile range.
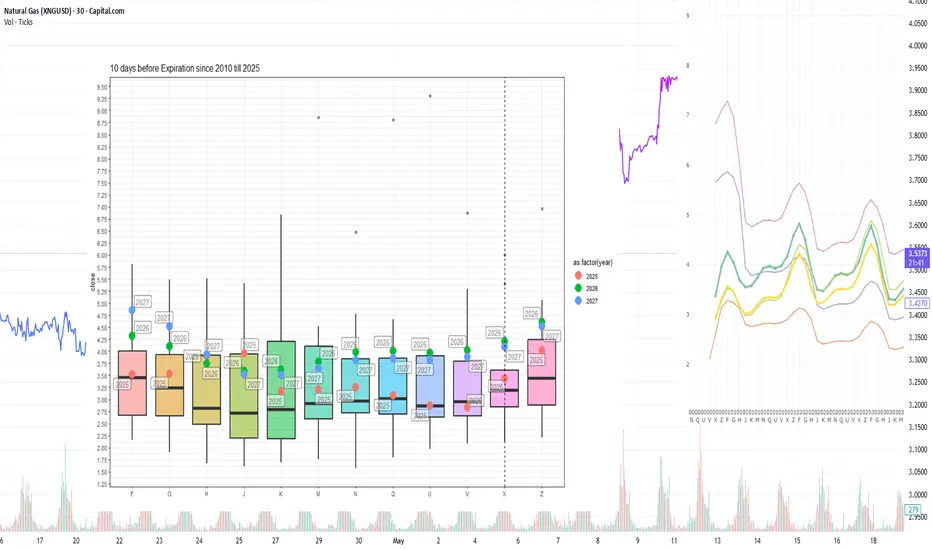
Current prices compared to price dispersion 10 days before expiration by month since 2010
Last week, cold weather and record LNG flows provided strong support for prices. The situation has now evolved, with signs of a correction due to profit-taking and a softening of weather forecasts for the second half of December. However, fundamental drivers (a prolonged cold spell in key regions, peak LNG exports, and growing demand from the energy sector) remain in place and are keeping 2026 and 2027 contract prices above the interquartile range.
Forward curve compared to 2020-2025
The shape of the 2025 forward curve on nearby contracts is once again approaching the 2023–2024 ranges. Despite high volatility on nearby contracts, contracts with delivery in two years and beyond continue to show clear price stabilization at historically stable levels.
Current stocks and forecast for next week compared to 2020-2024
According to the forecast for week 49 (EIA report dated December 5), gas reserves in underground storage facilities will decrease by a record 183 BCF, which is 111 BCF below the average for the past five years. At the same time, reserves will reach 3,740 BCF, which is 34 BCF lower than in 2024, but 56 BCF higher than the five-year average.
HDD+CDD based on current NOAA data and forecast for the next two weeks compared to 1994-2024
Currently, the total HDD + CDD (heating and cooling degree days) indicators for all climatic regions of the United States are within the moderate range relative to the 30-year climate norm. According to meteorological model forecasts, degree days are expected to increase after December 11, reaching maximum levels by December 14-15, after which they will begin to decline, and by December 17-19, values may fall below seasonal norms.
HDD+CDD based on current NOAA data and forecast compared to 1994-2024 by region
As of December 10, another peak in degree days is expected in the coming week, with values exceeding the upper interquartile range in the central regions of EN, ES, WN, WS, and South Atlantic. After December 18, the weather is expected to stabilize and return to average levels and below.
Daily supply/demand difference compared to 2014-2024
On December 10, the difference between supply and demand in 2025 declines after abnormal growth and approaches the upper interquartile range for 2014–2024.
Number of days for delivery from warehouses
The graph shows the number of days of supply based solely on storage reserves, at current consumption levels. As of December 10, reserves are sufficient for approximately 27 days, which is three days less than in 2024, seven days below the average, and at the lower end of the 10-year range. With this level of reserves and consumption, even minor disruptions in production or spikes in demand could cause sharp price reactions, especially in late winter and early spring.
Filling level of European storage facilities
The overall fill rate of European gas storage facilities as of December 10 continues to decline and stands at 71.5% (-4.4% over the week), which is 10.5% below the average fill rate and 10% lower than last year.
Electricity generation by source
Compared to last week, gas generation in the US48 energy balance fell to 38.4% of the total (-5% over the week) on December 10, 2025. The share of nuclear generation remains around 18-19% and is below the 5-year low. The share of coal generation has grown and remains at an average of 19-20%. The share of wind (11.3%) and solar (4.0%) has increased slightly compared to last week.

LNG: $5 Jan. Futures as Cold Snap & Record Exports Drain Storage* Due to the platform's features, the charts are arranged in sequence from left to right, from the first to the ninth chart. The charts were created by our team and based on an analysis from Bloomberg and the EIA data. This analysis was conducted in cooperation with Anastasia Volkova, analyst of LSE.
Natural gas enters Week 49 with a notable shift, as January 2026 futures breach the $5/MMBtu mark-28-32% above year-ago levels-driven by a historic cold snap and peak LNG exports. The entire 2026 curve now sits well above the 15-year upper quartile, with a rare inversion (2026 > 2027) of 40-70 cents signaling intense near-term demand. Storage is set to fall -13 BCF for Week 48 (November 28), beating the 5-year average draw of -31 BCF, leaving inventories at 3,922 BCF-still 208 BCF above the median but 29 BCF below 2024. HDD+CDD values hit 30-year highs, with further spikes forecast until December 5-6 before normalizing.
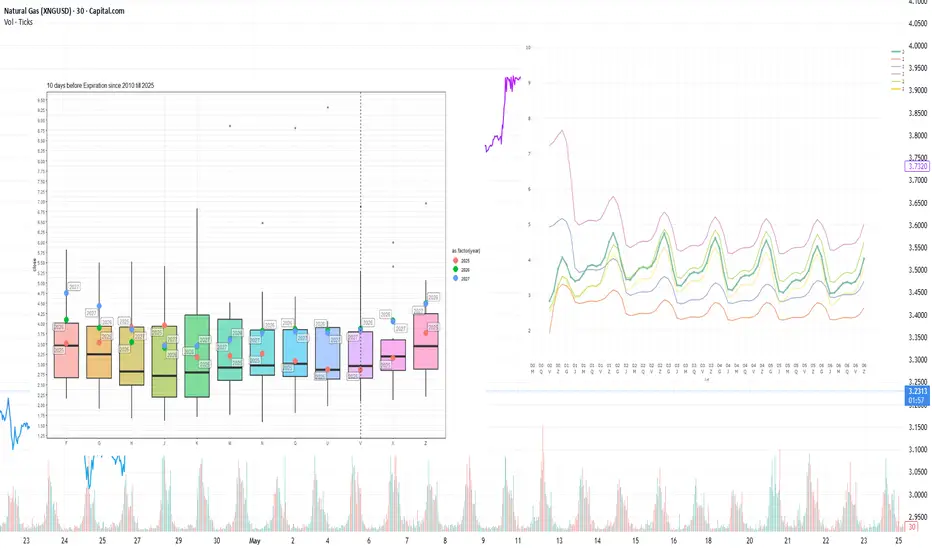
Current prices compared to price dispersion 10 days before expiration by month since 2010
Cold weather in the US and record LNG flows continue to provide strong support for natural gas prices. January 2026 futures are already trading confidently around the psychological mark of USD 5.00/MMBtu, which is approximately 28-32% higher than the same contract a year earlier. The entire 2026 futures curve is now significantly above the upper limit of the interquartile range for the last 15 years and, notably, significantly exceeds the 2027 quotes (the gap reaches 40-70 cents for most months). Possible reasons for this curve inversion (2026 > 2027) include a combination of factors: expectations of very cold weather, maximum utilization of export terminals, plans to commission large volumes of new LNG capacity, and high demand from the energy sector for new data centers.
Forward curve compared to 2020-2025
The shape of the 2025 forward curve on nearby contracts has broken away from the 2023-2024 ranges, but contracts with delivery in two years and beyond continue to show clear price stabilization at historically stable levels.
Current stocks and forecast for next week compared to 2019-2024
According to the forecast for week 48 (November 28), gas reserves in underground storage facilities will decrease by -13 BCF, which is higher than the average of -31 BCF over the past five years. At the same time, the stock level will reach 3922 BCF, which is 29 BCF lower than the 2024 level, but 208 BCF higher than the 5-year average.
HDD+CDD based on current NOAA data and forecast for the next two weeks compared to 1994-2024
Currently, the total HDD + CDD (heating and cooling degree days) indicators for all climatic regions of the United States are at their highest level in decades relative to the 30-year climate norm. According to meteorological model forecasts, the increase in degree days will continue until December 5-6, after which a decline will begin, and by December 10-12, values will return to normal seasonal norms.
HDD+CDD based on current NOAA data and forecast compared to 1994-2024 by region
As of December 3, in terms of regions, the peak number of degree days is expected in the coming week, exceeding the upper interquartile range in the central regions of EN, ES, WN, WS, and South Atlantic. After December 10, the weather is expected to stabilize and return to average levels and below.
Daily supply/demand difference compared to 2014-2024
As of December 3, the difference between supply and demand in 2025 is above the maximum level for 2014-2024. The main drivers of demand growth over supply are increased consumption for industry, power generation, and household consumption due to cold weather. LNG exports are at peak levels.
Number of days for delivery from warehouses
The graph shows the number of days of supply from storage alone, based on current consumption levels. As of December 3, reserves are sufficient for ≈27 days, which is 1 day less than in 2024, 7 days below the average, and at the lower end of the 10-year minimum range. With this level of reserves and consumption, even minor disruptions in production or spikes in demand could cause sharp price reactions, especially in late winter and early spring.
Filling level of European storage facilities
The overall level of gas storage in Europe on December 3 fell by 2.7% over the week and stands at 74.9%, which is 10.5% below the average level and 10% lower than last year.
Electricity generation by source
Compared to last week, gas generation in the US48 energy balance on December 3, 2025, increased significantly to 43.9% of the total (+3% for the week). The share of nuclear generation decreased by 2% to 18% and is below the 5-year low. The share of coal generation increased by 1.5% to 19.7% and is at an average level. Wind (7.8%) and solar (3.2%) decreased slightly compared to last week.

LNG Week 46: +40 BCF Build Beats 5-Yr Avg as Cold Snap Ends*Due to the platform's features, the charts are arranged in sequence from left to right, from the first to the tenth chart. The charts were created by our team and based on an analysis from Bloomberg and the EIA data. This analysis was conducted in cooperation with Anastasia Volkova, analyst of LSE.
Current prices compared to price dispersion 10 days before expiration, by month since 2010
December and winter contracts continue to rise, remaining well above the upper limit of the interquartile range. The current NGZ25 contract is trading above USD 4.5, which corresponds to the February 2026 contract and the December 2027 contract.
Forward curve compared to 2020-2025
The shape of the 2025 forward curve on nearby contracts has broken away from the 2023–2024 ranges, but contracts with delivery in two years and beyond continue to show clear price stabilization at historically stable levels.
Current stocks and forecast for next week compared to 2019-2024
According to the forecast for week 45 (November 7), gas reserves in underground storage facilities will increase by +40 BCF, which is higher than the average of +31 BCF for the past five years, but is within the upper quantile of 58 BCF. At the same time, the stock level will reach 3954 BCF, which corresponds to the 2024 level.
HDD+CDD based on current NOAA data and forecast for the next two weeks compared to 1994-2024
Current HDD+CDD values by region show maximum values for the previous 30 years of observations. After November 13, HDD is expected to decrease due to warming and return to average values and below.
HDD+CDD based on current NOAA data and forecast compared to 1994-2024 by region
In terms of regions, the sharp cold snap mainly affected the central regions and the South Atlantic. By November 13-14, temperatures are expected to return to average values.
Weekly total supply/demand difference compared to 2014-2024
On November 10, the difference between supply and demand in 2025 is in the middle range for 2014–2024, indicating a balance between supply and demand for this period.
Number of days for delivery from warehouses
The graph shows the number of days of supply from storage alone, based on current consumption levels. As of November 12, 2025, reserves are sufficient for approximately 30 days, which is below the historical minimum. With this level of reserves and consumption, even minor disruptions in production or spikes in demand could cause significant price reactions, especially in late winter and early spring.
Filling level of European storage facilities
The overall fill rate of European gas storage facilities as of November 12 is 82.2%, which is 8% below the average fill rate and 10% lower than last year. Seasonally, Europe is entering a period of withdrawal from storage facilities.
Filling level of European storage facilities by country
Particularly low storage levels of 60-80% are observed in Croatia, Denmark, Germany, Latvia, the Netherlands, and Slovakia. At the same time, storage levels in Poland, Italy, France, Romania, and Portugal have reached 90-100%.
Electricity generation by source
Compared to last week, the US48 energy balance for November 12, 2025, is characterized by an increase in gas generation (+1.5%) and coal generation (+1.6%) and a decrease in wind generation (-3%) and nuclear generation (-1%).

LNG Week 44: 80 BCF Storage Gain as Demand Edges Supply*Due to the platform's features, the charts are arranged in sequence from left to right, from the first to the Eighth chart. The charts were created by our team and based on an analysis from Bloomberg and the EIA data. This analysis was conducted in cooperation with Anastasia Volkova, analyst of LSE.
Current prices compared to price dispersion 10 days before expiration, by month since 2010
The expiration of the NGX25 contract was above the median according to data from 2010. Quotations for December and winter contracts for 2026 support growth and remain above the upper limit of the interquartile range.
Forward curve compared to 2020-2025
The shape of the forward curve in 2025 shows a steady convergence and is even closer to the configurations recorded in 2023 and 2024 for comparable dates. This trend is particularly evident in contracts with delivery in three years or more, where prices are steadily converging towards historical levels.
Current stocks and forecast for next week compared to 2019-2024
According to the forecast for week 43 (October 20-26), gas reserves in underground storage facilities will increase by +80 BCF, which is slightly above the average of +78 BCF for the past 5 years.
15-day sliding sum HDD+CDD based on current NOAA data and forecast for the next two weeks compared to 1994-2024
The current values of HDD+CDD accumulated over 15 days are in the average range for 1994–2024. The forecast for the coming week suggests that the values will exceed the average by 15–20 points, but in two weeks, there will be a trend toward returning to the average and below.
Accumulated HDD+CDD for 15 days based on current NOAA data and forecast compared to 1994-2024 by region
The current values of HDD+CDD accumulated over 15 days remain within the average range for 1994–2024. The forecast for the next two weeks suggests a return to the average weather trend in all regions.
Weekly total supply/demand difference compared to 2014-2024
This week, the difference between supply and demand in 2025 rose above the average values for 2014–2024, indicating that demand is growing faster than supply.
Number of days for delivery from warehouses
The graph shows the number of days of supply from storage facilities alone, based on current consumption levels. At the end of October 2025, reserves will last for approximately 34 days, which is below the lower limit of the interquartile range. With such a moderately reduced level of reserves, even minor disruptions in production or spikes in demand could cause sharp price reactions, especially in late winter and early spring.
Anomalies in weather (HDD+CDD) and fundamental factors
Overall, fundamental and weather factors are within the expected range, except for continued growth in consumption in the residential and commercial sectors caused by the start of the heating season. However, there has been no significant cooling at the start of the heating season so far.

LNG Week 43: 92 BCF Storage Surge Signals Weather-Driven Shift*Due to the platform's features, the charts are arranged in sequence from left to right, from the first to the Eighth chart. The charts were created by our team and based on an analysis from Bloomberg and the EIA data. This analysis was conducted in cooperation with Anastasia Volkova, analyst of LSE.
The natural gas market enters Week 43 with a robust storage uplift, as reserves are projected to rise 92 BCF during Week 42 (October 13-20), hitting 3,813 BCF-53 BCF above last year and well above the 5-year median of 74 BCF. The NGX25 contract swings to the upper end of the interquartile range with heightened volatility, while 2026 winter contracts stay above the range, fueled by growth momentum. Weather shifts, with HDD+CDD nearing 30-year averages and a 15-20 point uptick forecast, hint at rising demand. We analyze these trends below.
Current prices compared to price dispersion 10 days before expiration, by month since 2010
The NGX25 contract changed direction and is trading at the upper end of the IQR 10 days before expiration, demonstrating increased volatility. Quotes for 2026 winter contracts supported growth and remain above the upper limit of the interquartile range.
Forward curve compared to 2020-2025
The shape of the forward curve in 2025 shows a steady convergence and is even closer to the configurations recorded in 2023 and 2024 for comparable dates. This trend is particularly evident in contracts with delivery in three years or more, where prices are steadily converging towards historical levels.
Current stocks and forecast for next week compared to 2019-2024
According to the forecast for week 42 (October 13-20), gas reserves in underground storage facilities will increase by +92 BCF, reaching 3,813 BCF, which is 53 BCF higher than the figure for the same period last year. Last week's inventory growth was supported by high production volumes and mild weather conditions.
15-day sliding sum HDD+CDD based on current NOAA data and forecast for the next two weeks compared to 1994-2024
The current values of HDD+CDD accumulated over 15 days have reached the average range for 1994–2024. The forecast for the next two weeks suggests that the values will exceed the average by 15–20 points, which may be a significant driver of growth in the near-term contract.
Accumulated HDD+CDD for 15 days based on current NOAA data and forecast compared to 1994-2024 by region
The current values of HDD+CDD accumulated over 15 days are within the average range for 1994–2024. The forecast for the next two weeks suggests a departure from the current mild weather trend in all regions except WS CENTRAL, WN CENTRAL, MOUNTAIN, and PACIFIC.
Weekly total supply/demand difference compared to 2014-2024
This week, the difference between supply and demand in 2025 continues to be below the average values for 2014–2024, indicating weaker demand or excess supply.
Number of days for delivery from warehouses
The graph shows the number of days of supply from storage alone, based on current consumption levels. In the second half of October 2025, reserves will last for approximately 35 days, which is below the lower limit of the interquartile range. With such moderate reserves, even minor disruptions in production or spikes in demand could cause sharp price reactions, especially in late winter and early spring.
Anomalies in weather (HDD+CDD) and fundamental factors
Overall, fundamental factors and weather anomalies are within the expected range, with the exception of consumption in the residential and commercial sectors, caused by the start of the heating season.

LNG Week 42: 87 BCF Storage Rise Meets Warm Weather Volatility*Due to the platform's features, the charts are arranged in sequence from left to right, from the first to the Eighth chart. The charts were created by our team and based on an analysis from Bloomberg and the EIA data.
Current prices compared to price dispersion 10 days before expiration by month since 2010
Due to warm weather and high production, the NGX25 contract is trading below its 10-day average and showing increased volatility during this period. Prices for 2026 winter contracts remain above the upper limit of the interquartile range.
Forward curve compared to 2020-2025
The shape of the forward curve in 2025 shows a steady convergence and is even closer to the configurations recorded in 2023 and 2024 for comparable dates. This trend is particularly evident in contracts with delivery in three years or more, where prices are steadily converging towards historical levels.
Current stocks and forecast for next week compared to 2019-2024
According to the forecast for week 41 (October 6-12), gas reserves in underground storage facilities will increase by +87 BCF, reaching 3728 BCF, which exceeds the figure for the same period last year. The growth in reserves is supported by high production volumes and mild weather conditions.
14-day sliding sum HDD+CDD based on current NOAA data and forecast for the next two weeks compared to 1994-2024
The HDD+CDD accumulated over 14 days for all regions remains below the historical averages for 1994–2024, and even taking into account the forecast for the next two weeks, no significant deviation from the current trend of mild weather is expected.
14-day sliding sum of HDD+CDD based on current NOAA data and forecast for the next two weeks compared to 1994-2024 by region
In all regions except WS CENTRAL and PACIFIC, the 14-day cumulative HDD+CDD remains below the historical average for 1994–2024, and the forecast for the next two weeks does not suggest a departure from the current mild weather trend.
Weekly total supply/demand difference compared to 2014-2024
This week, the difference between supply and demand in 2025 is below the average values for 2014–2024, indicating weaker demand or excess supply.
Number of days for delivery from warehouses
The graph shows the number of days of supply from storage facilities alone, based on current consumption levels. By early October 2025, reserves will last for approximately 35 days, which is below the lower limit of the interquartile range. With such moderate reserves, even minor disruptions in production or spikes in demand could cause sharp price reactions, especially in late winter and early spring.
Anomalies in weather (HDD+CDD) and fundamental factors
Overall, fundamental factors and weather anomalies are within the expected range, with no systemic deviations. We do not expect significant price deviations in the current expiration period unless there are radical changes in supply and demand due to weather, production, or export factors.
*This analysis was conducted in cooperation with Anastasia Volkova, analyst of LSE.
LNG Week 41: 89 BCF Storage Surge Drives Mild Weather Trends*Due to the platform's features, the charts are arranged in sequence from left to right, from the first to the Eighth chart. The charts were created by our team and based on an analysis from Bloomberg and the EIA data.
Current prices compared to price dispersion 10 days before expiration by month since 2010
The NGX25 contract is trading above its 10-day average and showing increased volatility during this period. Quotes for 2026 winter contracts remain above the upper limit of the interquartile range.
Forward curve compared to 2020-2025
The shape of the forward curve in 2025 demonstrates stability and converges even more closely with the configurations recorded in 2023 and 2024 for comparable dates. This trend is particularly evident in contracts with delivery in three years or more, where prices are converging steadily toward historical levels.
Current stocks and forecast for next week compared to 2019-2024
According to the forecast for week 40 (September 29 – October 5), gas reserves in underground storage facilities will increase by +89 BCF, reaching 3,560 BCF, which exceeds the figure for the same period last year. The growth in reserves is supported by high production volumes and mild weather conditions.
Weekly HDD+CDD sum based on current NOAA data and forecast for the next two weeks compared to 1994-2024
In week 40 of this year, HDD+CDD indicators for the continental United States are still below the average values for the last 30 years of observations, but there has been a significant increase compared to last week's forecast, which is clearly visible in the graph for 2025. The forecast for week 41 also indicates that this trend will continue: a further decline in values relative to historical levels is expected, which may ease pressure on prices by increasing demand and energy prices.
Explanation of the graph: the candles represent quantiles for 30 years from 1994 to 2024. Red dots represent 2024, green dots represent 2025, and blue dots represent the 2025 forecast.
Weekly HDD+CDD sum based on current NOAA data and forecast for the next two weeks compared to 1994-2024 by region
A steady trend is observed in the leading regions: HDD+CDD values in 2025 remain below the historical averages for 1995–2024 in virtually all areas. The lag in indicators corresponds to the generally mild weather of the season and reduced energy demand for heating and cooling, which is recorded in all major regions, but there is an upward trend that has been growing from revision to revision over the last 6 days.
Weekly total supply/demand difference compared to 2014-2024
This week, the difference between supply and demand in 2025 is at the average for 2014–2024, but lower than in 2024.
Number of days of supply from storage facilities
The graph shows the number of days of supply from storage facilities alone, based on current consumption levels. In 2025, February–March reserves will be at 10–18 days, which is comparable to or slightly below average. From May to August, stocks will increase to 25–35 days, which is slightly below the 10-year average. By the beginning of October 2025, the number of days of consumption from stocks will increase to 35 days, which is at the lower end of the IQR. The moderate level of storage adequacy to meet current demand creates a fundamentally tighter market, where even moderate production disruptions or minor spikes in demand can cause disproportionate price reactions, especially in late winter and early spring.
Anomalies in weather (HDD+CDD) and fundamental factors
Overall, fundamental factors and weather anomalies are within the expected range, with no systemic deviations, except for isolated declines in LNG exports from 07-10 caused by technical work at the Sabine terminal.
*This analysis was conducted in cooperation with Anastasia Volkova, analyst of LSE.
LNG Week 40: 64 BCF Storage Boost Meets Cooling Demand Drop*Due to the platform's features, the charts are arranged in sequence from left to right, from the first to the Eighth chart.
Current prices compared to price dispersion 10 days before expiration by month since 2010
The next NGX25 contract is trading above the 10-day average level before expiration and is showing significant volatility during this period. Prices for 2026 winter contracts continue to remain above the upper limit of the interquartile range, reflecting a steady upward trend ahead of the winter period.
Forward curve compared to 2020-2025
The shape of the forward curve in 2025 remains stable and converges even more closely with the configurations observed in 2023 and 2024 for similar dates. This trend is most evident for contracts with delivery terms of three years or more, where there is a steady convergence towards historical price levels.
Current stocks and forecast for next week compared to 2019-2024
According to the forecast for week 39 (September 22–28), underground storage stocks will increase by +64 BCF to reach 3,572 BCF, exceeding the level for the same week last year. The growth in stocks is supported by high production volumes, which remain the main driver of stock growth.
Weekly HDD+CDD sum based on current NOAA data and forecast for the next two weeks compared to 1994-2024
In week 40 of this year, HDD+CDD values for the continental United States remain significantly below the average values for the last 30 years of observations, as clearly shown in the graph for 2025. The forecast for week 41 also indicates that this trend will continue: a further decline in values relative to historical levels is expected, which may continue to exert downward pressure on demand and energy prices.
Explanation of the graph: the candles represent quantiles for 30 years from 1994 to 2024. Red dots represent 2024, green dots represent 2025, and blue dots represent the 2025 forecast.
Weekly HDD+CDD total based on current NOAA data and forecast for the next two weeks compared to 1994-2024 by region
A steady trend is observed in the leading regions: HDD+CDD values in 2025 remain below the historical averages for 1995–2024 in virtually all areas. The lag in indicators corresponds to the generally mild weather of the season and reduced energy demand for heating and cooling, which is recorded in all major regions.
Weekly total supply/demand difference compared to 2014-2024
This week, the difference between supply and demand in 2025 is at the average values for 2014–2024.
Number of days for delivery from warehouses
The graph shows the number of days of supply from storage alone, based on current consumption levels. In February–March 2025, reserves will be at 10–18 days, which is comparable to or slightly below average. In May–August, reserves will increase to 25–35 days, which is slightly below the 10-year average. At the beginning of October 2025, the number of days of consumption from reserves will have increased to 35 days, which is at the lower end of the IQR. The moderate level of storage adequacy to meet current demand creates a fundamentally tighter market, where even moderate production disruptions or minor spikes in demand can cause disproportionate price reactions, especially in late winter and early spring.
Anomalies in weather (HDD+CDD) and fundamental factors
Overall, fundamental factors and weather anomalies are within the expected range, with no systemic deviations, except for isolated declines in LNG exports caused by technical work at individual terminals.
This analysis was conducted in cooperation with Anastasia Volkova, analyst of LSE.
LNG:Storage Inventories Projected to Increase above 2024 Levels.*Due to the platform's features, the charts are arranged in sequence from left to right, from the first to the ninth chart.
Current prices vs. price spread 10 days before expiration by month since 2010
The expiration of the NGV25 contract is occurring near the 15-year median. The subsequent NGX25 contract is currently trading around the 10-day pre-expiration historical average, however, showing elevated volatility. Winter 2026 contract prices remain above the interquartile range.
Current forward curve vs. 2020-2024
The forward curve shape remains stable, increasingly resembling the configurations observed on comparable calendar dates in 2023 and 2024. This pattern is particularly evident in contracts with delivery three years from now or longer, where a pronounced convergence toward historical pricing levels is occurring.
Current inventory and forecast for next week compared to 2019-2024
During Week 38 (September 15–21), storage inventories are projected to increase by +76 BCF, reaching 3,509 BCF — already surpassing 2024 storage levels. Meanwhile, injection rates have slowed due to reduced cooling demand and now align with the five-year median pace. Elevated production remains the primary driver behind inventory growth.
Weekly HDD+CDD total from current NOAA data and forecast for the next two weeks comparing 1994-2024
Across the continent, the current year’s Week 39 is marked by HDD+CDD values significantly below the 30-year historical average. Forecasts for Week 40 suggest continued weakness in these metrics, which is expected to suppress demand further and may reignite downward pressure on prices.
Explanation of the chart: candles represent quantiles for 30 years from 1994 to 2024. Red dots 2024, green 2025, blue prediction 2025.
Weekly HDD+CDD total from current NOAA data and forecast for the next two weeks compared to 1994-2024 by region
Forecasts across key regions align with the broader trend: HDD+CDD values remain below the 30-year historical average.
Weekly cumulative supply/demand differentials compared to 2014-2024
Despite elevated inventory levels and robust production pace, the weekly aggregate supply-demand spread chart for the 2014–2024 period illustrates a key observation: the divergence between demand and supply has widened significantly above the decade-long average and now mirrors the level seen during the same week in 2024. The main factors sustaining strong demand include consistently high LNG exports, steady industrial consumption, and gas-fired power generation.
Number of Days for Deliveries from Storages
The chart illustrates the number of supply days equated to solely storage deliveries, assuming current consumption levels. In February–March 2025, inventories stood at 10–18 days — it’s comparable to or slightly below the historical average. From May through August, coverage increased to 25–35 days, which remains somewhat below the 10-year range. By September 2025, inventories rose to 33 delivery days, aligning with the median but still below the peaks observed in 2015–2016. This moderate level of storage adequacy creates a structurally tighter market, where even minor production disruptions or modest demand spikes can trigger disproportionate price reactions - especially during the late winter to early spring period.
Weather Anomalies (HDD+CDD) and Fundamental Factors
Overall, fundamental factors and weather anomalies are within the expected range, with no systemic deviations, except for isolated declines in LNG exports and Mexican exports, which may temporarily support prices.
Anomalies in Power Generation Sources
Core generation across most sources has evidently stabilized, with remaining key anomalies observed in coal, hydro, and solar output.
This analysis was conducted in cooperation with Anastasia Volkova, analyst of LSE.
Natural Gas Bearish News TodayNatural Gas crumbled off the inventory report this morning.
Natural gas inventories came in at 90B vs 80B consensus.
This larger than expected build shows a weaker demand for Nat Gas during this seasonal period.
Key things to consider:
1. EU moves to accelerate ban on Russian LNG.
2. New Israel–Egypt pipeline coming online
3. China continues to import from Arctic LNG‑2 despite sanctions
4. Japan’s JERA in talks to buy U.S. shale gas assets
5. Gas storage in Germany & winter supply concerns
6. Western Canada storage nearly full; supply glut
7. Canadian production at record levels, but prices very low

XNGUSD Technical Update – What the Chart Is Telling Us NowIn this video, I break down the current XNGUSD (Natural Gas) chart using pure price action analysis on the daily timeframe.
This update builds on my previous post, where I shared a comprehensive outlook supported by fundamentals, including supply/demand imbalances, geopolitical risks, and long-term LNG export growth.
In this video, I focus purely on the technical picture—highlighting key levels, market structure, recent consolidation, and where I see potential opportunities unfolding next.
📈 If you're trading or investing in Natural Gas, this is a must-watch update to stay in tune with the current market dynamics.
Remember: This is not financial advice. Always do your own research and manage risk appropriately.

NATURAL GAS - Who can Predict this wild beast?Natural gas got demolished today, down over 8%.
The one headline we saw hitting the tape that is having some partial influence:
"Vessel Arrives at LNG Canada to Load First Cargo, Strengthening Global Supply Outlook – LNG Recap"
Today, we did hedge our core long UNG position with a short dated $56 put on EQT.
We are already green on that trade and looking for $56 level to come into play.
Natural gas volatility sure trades in a world of its own which is why it is key to size accordingly.

Will Middle East Flames Ignite Winter Gas Prices?The global natural gas market is currently navigating a period of profound volatility, with prices surging and defying typical seasonal trends. This significant upward movement is primarily driven by escalating geopolitical tensions in the Middle East, specifically the intensifying conflict between Iran and Israel, coupled with the looming potential for direct US military intervention. This complex interplay of factors is fundamentally reshaping perceptions of global energy supply and influencing investor sentiment, pushing natural gas prices towards critical psychological and technical thresholds.
Direct military strikes on Iran's energy infrastructure, including the world's largest gas field, the South Pars, have introduced a tangible threat to supply at the source. This is compounded by the strategic vulnerability of the Strait of Hormuz, a vital maritime chokepoint through which a significant portion of the world's liquefied natural gas (LNG) transits. Despite Iran possessing the world's second-largest natural gas reserves and being the third-largest producer, international sanctions and high domestic consumption severely limit its export capabilities, making its existing, albeit modest, export volumes disproportionately sensitive to disruption.
Europe, having strategically pivoted to LNG imports following the reduction of Russian pipeline gas, finds its energy security increasingly tied to the stability of Middle Eastern supply routes. A prolonged conflict, especially one extending into the crucial winter months, would necessitate substantial LNG volumes to meet storage targets, intensifying competition and potentially driving European gas prices higher. This environment of heightened risk and volatility also attracts speculative trading, which can amplify price movements beyond fundamental supply-demand dynamics, embedding a significant geopolitical risk premium into current market valuations.
This confluence of direct infrastructure threats, critical chokepoint risks, and Europe's structural reliance on global LNG flows creates a highly sensitive market. The trajectory of natural gas prices remains inextricably linked to geopolitical developments, with potential for further substantial increases in an escalation scenario, or sharp reversals should de-escalation occur. Navigating this landscape requires a keen understanding of both energy fundamentals and the intricate, often unpredictable, currents of international relations.

Expand Energy (EXE) – Fueling Growth in the LNG BoomCompany Overview:
Expand Energy NASDAQ:EXE is strategically positioned near the Gulf Coast, enabling it to capitalize on rising global LNG demand with a disciplined growth strategy.
Key Catalysts:
$2.7 Billion Capital Plan (2025) 💰
$500M for debt reduction & share buybacks, improving financial flexibility.
Balances growth investments with shareholder returns.
Production Expansion 📈
2024: 6.41 Bcfe/d
2025: 7.1 Bcfe/d 🚀
2026: 7.5 Bcfe/d 🌍
Scalable drilling & infrastructure investments enhance efficiency.
Strategic LNG Market Positioning ⚡
Located near key export hubs, maximizing access to high-demand markets.
Flexible capacity investments ensure adaptability to pricing trends.
Investment Outlook:
✅ Bullish Above: $95.00-$96.00
🚀 Upside Target: $140.00-$145.00
📈 Growth Drivers: LNG market demand, financial discipline, and production scalability.
🔥 Expand Energy – Driving the Next Wave of LNG Growth. #EXE #Energy #LNG

$GAIL REVIVES US LNG PLANS POST-TRUMP BAN LIFTNSE:GAIL REVIVES US LNG PLANS POST-TRUMP BAN LIFT
1/7
Good morning, energy traders! ☀️⚡️
Major shake-up in the LNG world: India’s GAIL is back on the hunt for a US LNG stake or long-term deals. What’s fueling this move? Let’s break it down!
2/7 – THE BACKSTORY
• Trump administration lifts the ban on new LNG export permits.
• GAIL had plans on ice since 2023—now they’re back in action.
• Sandeep Kumar Gupta (GAIL’s chairman) says: “We’re reviving our plans to buy a stake or sign long-term LNG contracts.”
3/7 – WHY IT MATTERS
• LNG Prices: Expected to soften post-2026 as supply ramps up.
• Impact on India: Cheaper energy imports, eye on boosting gas to 15% of energy mix by 2030. ♻️
• US Benefit: Strengthens position as a global LNG exporter—hello, bullish signals for Cheniere Energy (LNG) and Venture Global!
4/7 – MARKET IMPACT
• Prices: More supply could translate to downward pressure on LNG prices.
• Investment Angle: US LNG producers & infrastructure might see capital inflows. Keep an eye on relevant tickers!
• Energy Security: India aims for a cleaner, more reliable energy mix—this is long-term strategy at play.
5/7 – STRATEGIC ANGLE
• Aligns with India’s push to expand natural gas usage from ~6% to 15% by 2030.
• US Gains: Jobs, economic boost, and stronger foothold in global energy markets.
• Trade Partnerships: Could deepen economic ties between US & India.
6/8 What’s your take on GAIL’s US LNG strategy?
1️⃣ Bullish on US LNG exports 🐂
2️⃣ Bearish on LNG prices post-2026 🐻
3️⃣ Waiting for more clarity ↔️
Vote below! 🗳️👇
7/7 – YOUR TRADING PLAYBOOK
• Short-Term: Watch for volatility in LNG stocks (like LNG, Venture Global). GAIL might see a spike on renewed interest.
• Long-Term: Growing LNG supply + India’s energy push = potential contrarian bet on energy stocks before the broader market catches up.

Cheniere Energy (NYSE:LNG): Head & Shoulders Targets $187 Head & Shoulders reversal pattern has been spotted.
Trigger: Breakdown below Neckline was activated yesterday
Target: $187 - height of Head below Neckline
Invalidation: $233
Fundamentals: Peace talks on Ukraine

Chart Industries (GTLS) AnalysisCompany Overview:
Chart Industries NYSE:GTLS is a leading manufacturer of cryogenic equipment, offering solutions vital for the storage, distribution, and processing of clean energy resources like LNG, hydrogen, and oxygen. The company plays a pivotal role in supporting the global energy transition, addressing the growing demand for sustainable and low-carbon solutions.
Key Growth Drivers
Innovative Clean Energy Solutions:
Hydrogen and LNG Leadership: Chart Industries is at the forefront of clean energy infrastructure, with its cryogenic storage and distribution systems enabling the transition to low-carbon fuels. This expertise positions GTLS to benefit from rising investments in renewable energy and clean fuels.
Proprietary IPSMR® Technology: Chart’s IPSMR® liquefaction technology delivers cost-effective and efficient LNG production, making it highly attractive for major energy players. Key adoption includes:
Woodside Energy's Louisiana LNG Project: A significant endorsement of GTLS's technology and its potential for broader industry adoption.
Global Expansion and Diversified Revenue:
ExxonMobil Collaboration: The agreement with ExxonMobil for the Mozambique Rovuma LNG Project expands GTLS's footprint in international markets and diversifies its revenue base. Such collaborations showcase its engineering expertise and align with global energy majors’ transition strategies.
Broader Market Reach: Chart’s solutions are gaining recognition across multiple geographies, reinforcing its position as a global leader in cryogenic and energy transition technologies.
Alignment with Sustainability Trends:
Decarbonization Demand: With growing regulatory and consumer focus on reducing emissions, Chart’s solutions for hydrogen and carbon capture technologies are poised for sustained demand. The company’s portfolio aligns perfectly with long-term sustainability goals globally.
Strategic Positioning in Clean Energy Ecosystems: Chart is strategically positioned to serve critical energy sectors, including LNG for power generation, hydrogen for mobility, and oxygen for healthcare and industrial applications.
Investment Thesis:
Chart Industries is uniquely positioned to benefit from the global clean energy transition, driven by its cutting-edge technologies, strategic partnerships, and alignment with sustainability trends. Its focus on hydrogen, LNG, and carbon capture enhances its long-term growth potential, supported by increasing capital allocation toward clean energy projects worldwide.
Bullish Case:
Target Price Range: $340.00–$350.00
Entry Range: $180.00–$181.00
Upside Potential: Chart Industries’ advanced solutions and participation in large-scale global projects position it for substantial revenue growth and shareholder value creation in the coming years.

Will the Perfect Storm in Natural Gas Markets Lead to a New EnerIn an era of unprecedented global energy transformation, the natural gas market stands at a critical juncture where geopolitical tensions, technological advancement, and infrastructure development converge to create a potentially game-changing scenario. The ongoing Middle East crisis, particularly the Israel-Iran tensions threatening the Strait of Hormuz, could reshape energy flows and trigger a cascade of effects across interconnected global energy markets, potentially forcing a fundamental reassessment of natural gas's role in the global energy mix.
A seismic shift is approaching in North American markets with LNG Canada's anticipated 2025 launch, which promises to revolutionize Canadian gas pricing dynamics and global market access. This transformation coincides with an extraordinary surge in potential demand from AI and data centers, projected to consume between 3 and 30 billion cubic feet per day of additional North American gas. Such technological evolution, coupled with Asia's growing appetite for cleaner energy sources, suggests a structural reformation of traditional gas flow patterns and pricing mechanisms.
The convergence of these factors presents both challenges and opportunities for market participants. While weather patterns and storage dynamics continue to influence short-term price formation, longer-term strategic considerations are increasingly dominated by infrastructure development, market access, and geopolitical risk management. As the industry adapts through strategic hedging, infrastructure investment, and consolidation, the natural gas market appears poised for a period of dynamic evolution that could fundamentally alter its global value proposition and establish a new paradigm in energy markets.

Natural Gas Goes Kaboom!Profits have been secured I the Natural gas trade. That being said I still think Nat gas equities can push higher.
On the UNG chart we just saw the 20 day MA & 50 Day MA bullishly crossover each other.
Last time this happened Nat gas had a 4-5 day parabolic move.
The bulls must be careful to not push this commodity up too quickly because it makes the pattern less likely to have a continued breakout.
We are still putting in Lower weekly highs, so the next test of the most recent pivot high is going to be crucial.
If the bulls can trigger the weekly inverse head and shoulder pattern there's going to be a great long continuation opportunity. Until we break the pivot high & create a higher high traders must use caution now that we've had a large move occur.
AR, EQT, CPK, LNG are all set to push higher if Nat gas holds these gains.

Natural gas...time to buy? Natural gas just keeps bleeding lower.
Despite the oversold intra day condition this commodity is finding no support.
Natural gas equities are mixed right now, but are definitely showing some signs of accumulation.
We think the next 2 support zones on Nat gas if we lose this critical area are $2.21 & $2.00
Beware Nat gas tends to overshoot.
This trendline we are holding right now connects through major lows going back to 2020.

Natural Gas: A Mega Move is BrewingNatural Gas has been a very volatile asset in recent sessions.
The price action in the 4 hour chart has triggered a bullish breakout.
The next bullish inverse head and shoulders pattern on the daily chart is starting to take shape. This pattern has not yet triggered.
If we see a breakout of this pattern there is about $1.50 of upside from the neckline.
Resource stocks are still holding up very well, granted so is the market.
A very similar structure is playing out on the weekly chart, regarding the 50 Weekly MA
If we see price trade in congruency we should see more upside this week and then potentially we may see some sellers the folling week
