XRP: Hold til End of YearIf you consider the entire cryptoasset market at the moment, we're beginning to see a shift in mentality.
There is more optimism in the markets. Though still carrying great skepticism, it should be noted that there are several indicators to our advantage that signal the beginning of another possible bull run.
Considering that there is a significant uptrend in BTC's chart (where we can also refer to the Ichimoku Cloud and infer that all three indicators are pointing upwards in the daily) and its effect on the entire crypto market, coupled with the halving that's set to occur in May, it would not be out of the question that we begin to see a snowball effect over the next 3-4 months. These indicators are pointing to a -very- strong upward momentum and it doesn't look like it will end any time soon.
Even though I previously did a piece on going both long and short on BNB, after looking at the log chart and comparing it to XRP's position and overall fundamentals, it seems as though the ROI that is projected for XRP during the span of this year is -considerably- larger.
In short, if you want to make money, it's likely that both BNB and XRP will go up during these following months.
BUT if you want to make FAT stacks, I suggest going with XRP.
LB out.
Logscale

BitcoinUSD BLX Log LinesHere is a couple well known log lines applied to a TV chart.
This is not trading/financial advice.

BitcoinUSD Internal Fibonacci Patterns XPrice likes to revisit zones, zones were price stopped and price visited once (TF dependent) establishes an area that attracts price. However if rejected, zone becomes a strong boundary for a probable duration of time. Price rarely leaves an area to never return. Yellow represents a strong attraction for price. Blue Repels.
Previous Analysis
This is not trading/financial advice.

Is this #VergeCurrency $XVG Trend-Based Fib Extension right?I see some people who do not turn on the log setting on their trend-based fib extension analyses.
This is with it on.
Is this correct?
I particularly like the .618 is basically hovering around Verge's ATH. I also see interesting fractals (colored ovals).
Comments would be greatly appreciated. Thanks!


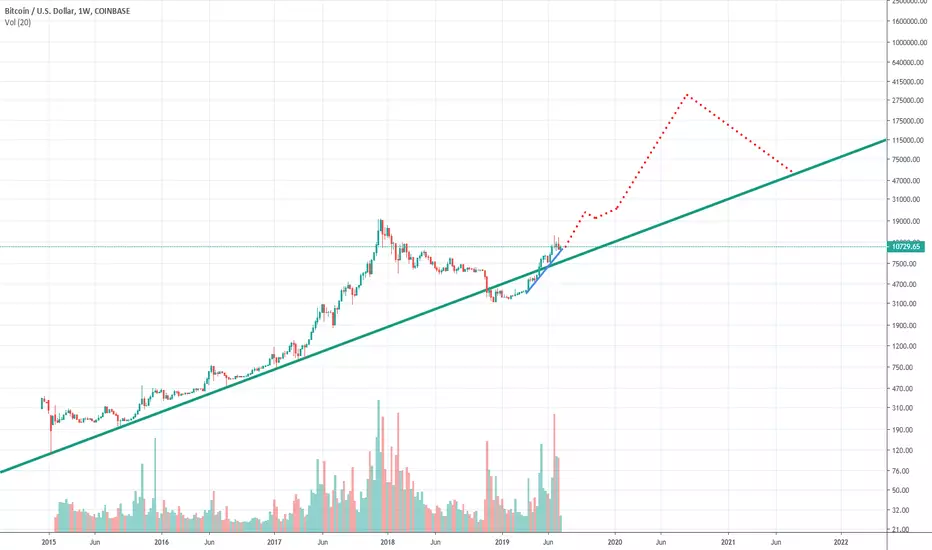
The only bitcoin chart you needLooking at BTC on a logarithmic chart on high time frame.
Bitcoin has always bounced from this trend line.
It's pretty easy....
If we lose the "2018" bottom and break down from the long term trend line bitcoin is doomed and could crash very hard.
If 5800 can hold we should see a bounce up to triangle resistance.
If we can break above this resistance the next bull run to 50k is on the table.
Cheers


Log vs Linear parallel channel comparisonOn the left is the log chart with parallel channels.
Notice the price just wicked close to the bottom of the main up channel and the bottom of the current down channel for LTF
On the right is the linear chart with parallel channels.
Notice the 11-12k candles rejected off the centre of the main up channel and we are below the centre of the current down channel for LTF
it's a bit basic and the channels might not be accurate depending on TF viewed and if you want to include candle bodies or wicks but it will give you an idea.


ZEC weekly log scale SharkUsually when measuring the retracements for potential harmonics we use the Linear Fibonacci scale but i think it might be acceptable to use the FIB tool adjusted for log scale in certain instances and this is one of them.
Pay no mind to the numbers auto generated by the Cypher tool as those numbers are only Linear scale retracements and the tool doesn't have a log scale adjusted option like the FIB tool does.
For those who would like to check the measurements themselves I have color coded each individual set of waves:
XA-B retrace in Orange
AB extension to C in Blue
BC extension to D in Green
X to C retrace to D in Black.
I have also marked the PCZ of the shark in the Blue Box if pattern is valid we will see a reversal between the 886 and 1.13 retracements.
Price-wsie that's between 37-15 dollars
Yea i know, that's a huge zone of reversal but that's the nature of a Shark pattern.
because of how big the reversal zone is it is too early to plot fib targets for the pattern for i currently don't have a definite price to fib from yet but something i can say is no matter where it reverses in this zone even a 0.382 and 0.50 retrace would yield a 100-200% move.
Alternatively I have also spotted a broadening and descending wedge marked in the green trendlines and are currently showing TDI-RSI bullish divergence from the lows back in December and February to our current lows a breakout of the wedge on it's own gives us a measure move back to around 300 if we're being conservative.
ZEC has never been my favorite coin but based off the technicals presented here i find no harm in trying to own atleast a few of them then forgetting about them to see how this pattern plays out.

Bitcoin log scale trendMy target since parabola got broke is S2. Now capitulation is clear. If it goes below S2 and challenges log scale trend, bitcoin would be i deep trouble.


Apple Big Picture Analysis linked with recent actionMy Elliot Wave of Apple in the Big Picture. I am assuming this Stock to still be in corrective Wave 4 at the moment which should stretch out a little bit longer. This assumption however is only valid as long as we stay under the 260 price level.

ETH Log scale example (backs up XRP targets)This is just to prove the people wrong who think XRP cant reach 100$+ as per my analysis, they think using the log scale is unrealistic. Yeah ok then.....


The 'Wildcard scenario'- BTC log scale revealing incoming dump?Remember that big rising broadening wedge that BTC broke down from but not really that hard and then came right back into it?
Well it turns out that it still hasn't been violated in the logarithmic price scale, and its support (now resistance) is really really close to where we are holding right now..
What does this mean?
Well at the very least it means that btc will probably have a descent amount of sellers at that line, but it also means the a downwards rejection from that line is a very likely scenario.
What do you think about this pattern?
Could BTC get rejected so hard that it could break 10k to the downside again?
Is this just the beginning of a big bear period that takes BTC all the way down to the 2k-6k levels?
Is none of these things going to happen and BTC will just ignore that line and pump to 19k?
I honestly have no clue, but you go ahead and write your opinions in the comments!


Gold on log scale. Next target is $1616 very fast.Have a look at the long term gold price on a log scale. Look at the last bull market from 2002 until 2011.
Once again we are in a bull market. If it plays out like the last one we should see $1616 very soon -maybe in a month or two. This should be followed by an acceleration of the trend taking us through the all time high and on to $2200 by mid 2021. At that point there will be no stopping the future price ascent.
The reason for the slow rise at the start is the gold miners. They want to show their shareholders that they are selling gold forward on every rally. At some point they will realise that this is something which will make them look foolish so they will stop selling. Then there will be nothing to stop gold's ascent.
Near term target (2 months): $1616
Medium term Target (2 years): $2200

BTC recovered from multiple price crashes. Higher highs to come.The above chart shows the price of bitcoin plotted on a log scale. This is a way of easily seeing the percentage movements. On a log scale, a crash from $10 to $8 looks the same size as a crash from $10’000 to $8’000. They are both 20% crashes. If it were a linear scale, the $10 to $8 crash would be virtually invisible.
As can be seen, bitcoin has suffered many price declines of more than 20%, and some more than 50%. Yet, after each price decline, a price recovery has started. If bitcoin was a fad, a bubble, a scam, or a mania, the price would never have recovered from even the first price crash.
Yet, each price decline has been followed by a recovery to a new all-time-high. We are in the middle of one such price recovery right now.
Look carefully at the graph. As you can see, we are very close to breaking the all-time-high of $19’000. Look how fast prices recovered after previous declines. The latest decline, and subsequent recovery, are playing out like all previous patterns. Thanks to the log scale, you can see the normality of the current price behaviour and where it is likely to go.
I have my view of where the price will be in one year. (Clue: much higher). Tell me your guess. I will award a thumbs up to every answer which is within 30% of my target. Thumbs up also for any thought provoking answers.
I will publish my target price tomorrow as a reply to this blog.

BTC : Matrix hacked - Still bullish ? - LogscaleNotice how Bollinger Bands contract just before touching the trending support
If it does the same near a good existing horizontal support... next bull run may be starting ("may" as in any technical analysis)

