#AN028: London Challenges European Union, Halts Defense Funds
The news that the United Kingdom has decided not to pay the €6.75 billion earmarked for the new European Defense Fund sends a clear political and economic signal to Brussels. Hello, I'm Andrea Russo, an independent Forex trader and prop trader with $200,000 in capital under management. Thank you in advance for your time.
Behind this decision is not just a question of money, but a precise strategy of industrial and military independence aimed at reaffirming British sovereignty post-Brexit.
💼 Economic and geopolitical implications
The European fund was designed to finance joint defense and technological projects, reducing dependence on the United States and strengthening the EU's autonomous military capacity.
By refusing to participate, London is sending a two-pronged message:
Economic: Priority is given to its own budgets and its national defense industry, which has seen a strong revival in the last two years with orders from Ukraine, the Middle East, and NATO countries.
Strategic: The United Kingdom does not intend to bind itself to European defense plans that could compete with NATO, of which it remains a key member.
📉 Market Impact
In currency markets, the news tends to temporarily strengthen the pound sterling (GBP), as it is perceived as a gesture of autonomy and fiscal stability—less public spending in a context of tensions over EU budgets.
However, the effect could be short-lived: the decision deepens the rift with Brussels, fueling political risks and potential trade frictions, especially if the EU reacts with restrictive measures on joint military contracts or exports.
On the equity front, British defense stocks (BAE Systems, Rolls-Royce Defence) could benefit from "patriotic" sentiment and increased domestic orders.
On the bond market, however, the effect is neutral: the move does not change the sovereign rating but reinforces the idea of the pound as a regional safe haven currency in a Europe torn between austerity and defense spending.
🌍 Risks for the EU
For Brussels, London's lack of input complicates the construction of a common defense policy:
less funding for shared industrial programs,
greater dependence on Germany and France,
and a perception of European institutional instability, a factor that tends to weaken the euro (EUR).
London

30 OCT 2025: US100 MARKET RECAPLONDON KILL ZONE
BREAD & BUTTER SETUP
DISCLAIMER:
The owner of this page is an authorised Representative under supervision of TD MARKETS (PTY) LTD, an authorised Financial Services Provider (FSP No. 49128) licensed by the Financial Sector Conduct Authority (FSCA) under the Financial Advisory and Intermediary Services Act (FAIS).
The FSP is licensed to provide advice and intermediary services in respect of Category I financial products, including but not limited to derivative instruments, long-term deposits, and short-term deposits.
All investment ideas are provided in accordance with the scope of the FSP's license and applicable regulatory requirements. Derivative instruments is a leveraged products that carry high risks and could result in losing all of your capital, and past performance is not indicative of future results.
This idea and any attachments are informational/education and does not constitute a recommendation to buy/sell.
No guarantee is made regarding the accuracy or outcome of this trade idea.
If you choose to accept this idea, please do so at your own risk.

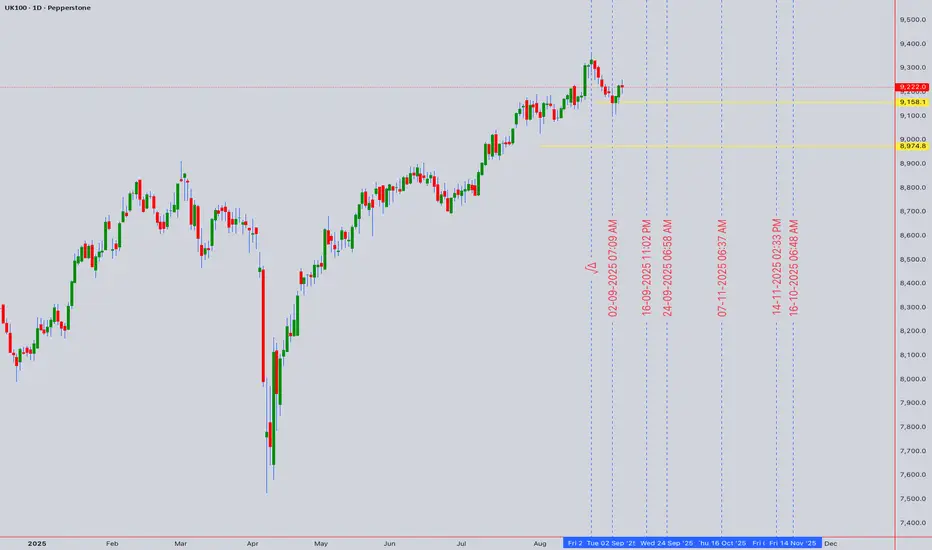
FTSE Challenges Key Resistance - Breakout or False Dawn?UK100 Technical Analysis: 🇬🇧 FTSE Challenges Key Resistance - Breakout or False Dawn? 🌅
Asset: UK100 (FTSE 100 Index CFD)
Analysis Date: September 5, 2025
Current Closing Price: 9,222.0 (as of 11:54 PM UTC+4)
Timeframes Analyzed: 1H, 4H, D, W
Executive Summary & Market Outlook 🧐
The UK100 is testing a critical technical and psychological resistance zone between 9,200 and 9,250. 🚧 This level has acted as a significant barrier in the past. The index is in a near-term uptrend but remains in a broader multi-month consolidation phase. A decisive breakout above 9,250 could signal the start of a new bullish leg, while a rejection here would reinforce the range-bound narrative and trigger a pullback. This analysis provides a clear roadmap for intraday 🎯 and swing traders 📈 navigating this pivotal level.
Multi-Timeframe Technical Analysis 🔍
1. Trend Analysis (Daily & 4-Hour Chart):
Primary Trend: 🟡 Range-Bound (Neutral). Price is trapped within a larger consolidation rectangle between ~8,800 and 9,250.
Short-Term Trend: 🟢 Bullish. The recent rally from the 9,000 support has been strong, bringing price to the upper boundary of the range.
2. Key Chart Patterns & Theories:
Range-Bound Consolidation 📊: The dominant pattern is a large rectangle. The current test of the range high (~9,250) is a make-or-break moment. A breakout would be significant, while a rejection is a classic range-trading signal.
Elliott Wave Theory 🌊: The move off the recent low looks corrective (3 waves), suggesting it may be a B-wave or part of a larger consolidation pattern within the range. This reinforces the importance of the 9,250 resistance.
Ichimoku Cloud (H4/D1) ☁️: Price is trading just above the Cloud on the daily chart, indicating a tentative bullish bias. However, the Cloud is relatively flat, reflecting the lack of a strong trend. A clear break above 9,250 would see price move decisively above the Cloud.
Wyckoff Method: The price action could be interpreted as part of a potential re-accumulation phase near the top of the range. A breakout on increasing volume would confirm this.
3. Critical Support & Resistance Levels:
Resistance (R1): 9,220 - 9,250 (Key Range High & Technical Ceiling) 🚨
Resistance (R2): 9,400 (Projected Target if breakout occurs)
Current Closing Price : ~9,222
Support (S1): 9,100 - 9,150 (Immediate Support & 21-period EMA) ✅
Support (S2): 9,000 - 9,050 (Major Range Support - Must Hold) 🛡️
Support (S3): 8,800 (Ultimate Range Low & 200-day EMA)
4. Indicator Consensus:
RSI (14-period on 4H/D): Reading is near 62, in bullish territory but not yet overbought. This suggests there is room for further upside if buyers can maintain control. A bearish divergence here would be a strong sell signal.
Bollinger Bands (4H) 📏: Price is pressing against the upper band, a sign of strong short-term momentum. A rejection here could see price move back towards the middle band.
Moving Averages: The 50 and 200-day EMAs are flat, confirming the range-bound nature. The 21-period EMA on the 4H chart is key short-term dynamic support.
Volume & VWAP: A breakout above 9,250 needs to be confirmed with a significant increase in volume to be trusted. Low-volume breakouts are often false.
Trading Strategy & Forecast 🎯
A. Intraday Trading Strategy (5M - 1H Charts):
Bearish Scenario (Range Rejection Play) ⬇️: This is a classic range trade. Fade the resistance with a short position.
Entry: On clear rejection signals at 9,240-9,250 (e.g., bearish pin bar, engulfing pattern).
Stop Loss: Tight, above 9,270.
Target: 9,150 (TP1), 9,100 (TP2).
Bullish Scenario (Breakout Play) ⬆️: If price breaks out with conviction, wait for a pullback for a better entry.
Entry: On a pullback to re-test 9,220-9,230 as new support.
Stop Loss: Below 9,200.
Target: 9,350 (TP1), 9,400 (TP2).
B. Swing Trading Strategy (4H - D Charts):
Strategy: RANGE TRADING OR BREAKOUT WAIT. The most logical play is to trade the range until it breaks.
Ideal Long Zone: Near the 9,000 - 9,050 support area. ✅
Ideal Short Zone: Near the 9,220 - 9,250 resistance area. ✅
Breakout Strategy: A daily close above 9,270 would be a strong buy signal targeting 9,400+. A daily close below 8,950 would be a strong sell signal.
Risk Management & Conclusion ⚠️
Key Risk Events: UK economic data (GDP, CPI, BoE decisions) and GBP volatility are key drivers. 🔥 As a heavily international index, the FTSE is also highly sensitive to global risk sentiment and commodity prices (particularly oil and mining stocks).
Position Sizing: Trading within a range requires tight stop losses. Ensure your position size allows for a stop placed just outside the range boundaries without incurring excessive risk.
Conclusion: The UK100 is at a critical juncture. ⚖️ The battle between the bulls and the bears is concentrated at the 9,220-9,250 resistance wall. Until a decisive break occurs, the range-bound strategy is favored. Swing traders should be patient for entries near support or a confirmed breakout. Intraday traders can fade the range extremes. The next major move will be dictated by the resolution of this level. 📊
Overall Bias: 🟢 Bullish above 9,270 | 🔴 Bearish below 8,950 | 🟡 Neutral/Range-Bound between 9,000-9,250
For individuals seeking to enhance their trading abilities based on the analyses provided, I recommend exploring the mentoring program offered by Shunya Trade. (Website: shunya dot trade)
I would appreciate your feedback on this analysis, as it will serve as a valuable resource for future endeavors.
Sincerely,
Shunya.Trade
Website: shunya dot trade
⚠️Disclaimer: This post is intended solely for educational purposes and does not constitute investment advice, financial advice, or trading recommendations. The views expressed herein are derived from technical analysis and are shared for informational purposes only. The stock market inherently carries risks, including the potential for capital loss. Therefore, readers are strongly advised to exercise prudent judgment before making any investment decisions. We assume no liability for any actions taken based on this content. For personalized guidance, it is recommended to consult a certified financial advisor.
London Buy Model Example August 07 2025Hello traders! This is a turtle soup idea. Enjoy. Thanks for all the support.
London Kill Zone 2am - 5am
Asian Lunch 12am - 2am

Targets Hit So as you can see previously I stated that I was waiting for a breakout of the rising wedge before I entered this trade. Now it didn't go quite as planned as price made a bigger rising wedge from what I originally mapped out but nonetheless I was able to recognise, it re-adjust and enter the trade. Price hit both targets.

LONG ES after London Open*I like the long better for london open.
From 6000, weak liquidity built up above, Finished business below, macro SMAs buy bias...
HOWEVER there is also a good case for shorts as we are heading up into futures open, SMAs and there is LVN space below to squeeze into. So... I will be looking for finished business RISK and test/acc ENTRY as outlined there and targeting the weak liquidity above. Given the SMAs above etc, i doubt price will rush up, so take your time and get that test to confirm.
And as always if its not there DONT chase. Patience.

Nikkei 225. Tokyo Open Delivery cause of Geopolitical DriversSharing my Tokyo Open model for the daily expansion on Nikkei. Along with Intraday market profiles. And Quarterly Theory

London Take 1 - 5/6/2025 - GBPUSDInitial comments ...updates will follow as usual.
London Setup for GBPUSD.

UK HOUSE PRICES: RELENTLESS UPTRENDIn January 2025, the latest figures reveal that UK house prices have risen by 0.7%, pushing the average price to a staggering £299,238, a new all-time high. For the mainstream media, the narrative of an impending house price crash has been a constant refrain over the past two years, fueled by the belief that prolonged high interest rates would spell disaster for the housing market.
Indeed, these elevated interest rates have significantly hindered the natural upward trajectory of house prices, which typically rise in response to inflation, a growing population, and a persistent shortage of new housing construction.
The current stagnation in UK house prices resembles a pressure cooker, building up energy that is bound to release in a dramatic surge. The government’s ongoing strategy of printing money to appease voters will inevitably flow into asset prices, leading to inflation in these markets, much like the consumer price inflation we’ve already witnessed.
The government finds itself in a bind, compelled to continue this money printing to meet the electorate's demands for free money and to manage an ever-growing debt burden. As the debt increases, so does the need for borrowing to service it. This cycle makes it increasingly challenging for the UK to lower long-term borrowing rates, especially compared to the US, which still holds sway over the global financial landscape.
UK house prices are gradually regaining momentum following the fallout from the Liz Truss debacle, a situation she seems to remain blissfully unaware of, despite the havoc her brief six-week tenure as Prime Minister wreaked on the British economy.
The financial landscape was nearly sent tumbling into chaos, prompting the Bank of England to step in with an unprecedented commitment to purchase UK Government Bonds. The economy is so fragile that the UK is now compelled to invest in US government bonds to shore up its financial system against the spectre of another crisis reminiscent of the Truss era under Labour. We were perilously close to a financial meltdown!
Currently, UK house prices are inching towards a potential increase of around 10% per year, indicating a modest upward trend rather than a frenzied housing boom, while also avoiding the catastrophic price drop that the media seems to obsess over.
Ultimately, average house prices in the UK are set to rise, irrespective of government actions or economic conditions. Therefore, those considering the purchase of a standalone house should act without hesitation, as flats and new builds present more complicated challenges—flats can become a logistical nightmare, and new developments might be situated in flood-prone areas, among other concerns.

Buy FTSE 100 Index London open & breakoutPrice here is moving in a good Uptrend. MACD ZERO LAG is so bullish . From 11:30am London open Long trade might be a, good for the Aussie currency. we seem to recover better.

NZDJPY ShortI'm seeing nice rejection from my point of interest. You can hop on this too if you don't mind.
Have a pipful day folks

GBPUSD BearishLondon session overlapping on NY and we will have a correctional trend to downside in GU

8.16.2024 Holding Gold LongRight now we are holding out Gold trade runners on Long until we start to get bearish confirmation that it may be reversing.
It is at a 4hr down trend line as well as our gray zone is up above it that is based off of a 4hr swing high.
Enjoy!

GBPUSDGood morning traders, today the market is moving because we have fundamentals both in the pound now at 7:00 and in the afternoon NY we are going to look for a window of opportunity to take advantage of the day. For today's first leg in London, it presents a bullish scenario. Once I get my psychological point and everyone is induced to buy, we will look for sales.

UK100 FTSE100 - ABC Correction Uderway?Hello Guys,
The yearly Candle is slightly Bullish - but we did not see a break on a closing base of the crucial 7900 area -> ATH.
A Retest of this area would constitute a Bullish setup - which I would be happy to be part of after the last rallye.
Q2 Close - Doji -> might see a consolidation phase from here with a sideways to down mentality - considering the recent gains the bulls had.
The monthly Bias is Bearish. A Bearish Engulfing Pattern (Although a small one) has been formed. The Stochastic confirms a Bearish Bias - not totally contradicting the higher Timeframes! So Bulls be prepared for some drop… Just an idea from my side. A Double Top at 8400 would be a strong sign of Bears being back.
-> For the bulls 7900 has to hold - for the bears 8400.
Thats all for now…
Thanks for reading

GBPUSD - SELL NOW- LONDON TRADE IDEA( 1:5 RR)This is related to my earlier analysis. Price has now traded deep into AOI. Anticipating an inflection off the H1 800EMA.
Potential RR is 1:5. I will post trade updates

The RICS UK House Price Balance - Trending Up For Now The RICS UK House Price Balance
(Released this Thursday 14th Mar 2024 for Feb month)
The Royal Institute of Chartered Surveyors (RICS) House Price Balance is a monthly survey that indicates whether more or less surveyors expect housing prices to rise or fall in the U.K. housing market. A positive net balance suggests house price increases, while a negative net balance implies price decreases.
The RICS provides valuable insight into the UK housing markets trend and helps gauge the direction of house price movements whilst also offering insight into consumer spending.
The Chart
The RICS House Price Balance is calculated as the proportion of surveyors reporting a rise in housing prices minus the proportion reporting a fall in prices.
It reflects the expected monthly change in national house prices.
Positive vs. Negative Net Balance:
A positive net balance indicates that more surveyors expect price increases, signaling a robust housing market. A negative net balance implies that more surveyors anticipate housing price decreases, indicating a fragile housing market.
Green Area 🟢 = More Surveyors Reporting an Increase in House Prices
Red Area 🔴 = More Surveyors Reporting an decrease House Prices
Grey Areas ⚫️= Recessions
▫️ The RICS fell sharply from April 2022 down to the 0% level in Oct 2022. This was a leading indication of a downward trend UK House market prices (falling from 78% in Apr 2022 to 0% in Oct 2022).
▫️ The RICS fell into the red zone from Oct 2022 forward indicating that houses prices from this date were in net decline (per surveyors responses).
▫️ Almost 12 months later the RICS reached a low of -66% in Sept 2023. Since this date we have started to trend upwards sharply recovering from -66% to -18.4% today. However we remain in net negative territory indicating house prices are still in declining but not as much as before, a change of trend may forming indicating a move to house price appreciation (not confirmed until we move above the 0% level into + territory).
▫️ The Historic Recession Line on the chart illustrates the -63% level which crossed by the RICS at the onset of the 1990 and 2007 recessions (grey areas on chart). We recently penetrated this level moving to -66% in Sept 2023 which historically does not bode well.
This weeks RICS release will be very revealing and could tell us if we have a continuation of the upward trend for UK House prices or if we we remain firmly in negative territory.
Lets see what Thursday brings, a fascinating little metric to help us keep an eye on the property market in the UK and the to get an idea of UK consumer behavior.
PUKA

GBPJPY - GJ 1hrPull back! SELL Now !
80+ pips on GJ
GBPJPY has made a clean red candle below the support. Now that GJ has retested support and rejected it with a nice red candle we can take sell entries. Watch as GJ is near the weekly resistance . This zone has also been confirmed, so we can see a rejection to test previous support areas
tp 1: 4hr and daily support
tp 2: 3.82 fib
tp 3: D1 support, if GJ breaks below this area look to continue selling
*stop loss can be increased. please use proper risk to reward

13th Feb 2023 / EURUSD SHORT IDEA- Potential London Judas swing.
- I want to see a bearish session targeting Asia’s low and PDL.
- Price has already traded above Asia’s high in a premium of the DR.
- Remember it’s CPI day, potentially could be a slow session.

GBPCHF SHORTSI have analyzed and seen the weekly and daily timeframe being bearish, these are the main timeframes, so I went to the four hour timeframe to look for opportunity to short, then I spot the resistance zone just below the 50 exponential moving average, now expecting a retracement to the moving average then take shorts.

XAUUSD GOLDPair : XAUUSD ( Gold / U.S Dollar )
Description :
Completed " 12345 " Impulsive Waves at Demand Zone or Fibonacci Level - 61.80%. Bearish Channel as an Corrective Pattern in Short Time Frame and Rejection from Lower Trend Line. It has completed the Break of Structure and making its Retracement

GBPAUD: “Break Out” Setup on “Momentum” Entry (37/100)System has identified a “BO” playbook setup and a potential “momentum” shift market entry during the third hour of the LONDON 12-Candle Window.
RISK: 1R
TARGET: 2R
***DISCLAIMER***
This is a new system based strategy being live tested for the purpose of gathering data. The system generates between 3-6 signals per session upon detecting a qualifying setup and entry signal. Currently being tested only in LONDON and only using certain pairs. The win rate and expectancy are unknown. Please do not take these trades.

GBPAUD: “Breakout” Setup on “Momentum” Entry (38/100)System has identified a “BO” playbook setup and a potential “momentum” shift entry during the second hour of the LONDON 12-Candle Window.
RISK: 1R
TARGET: 2R
***DISCLAIMER***
This is a new system based strategy being live tested for the purpose of gathering data. The system generates between 3-6 signals per session upon detecting a qualifying setup and entry signal. Currently being tested only in LONDON and only using only certain pairs. The win rate and expectancy are unknown. Please do not take these trades.
