NZDCAD Will Move Higher! Buy!
Please, check our technical outlook for NZDCAD.
Time Frame: 4h
Current Trend: Bullish
Sentiment: Oversold
Forecast: Bullish
The market is trading around a solid horizontal structure 0.805.
The above observations make me that the market will inevitably achieve 0.808 level.
P.S
The term oversold refers to a condition where an asset has traded lower in price and has the potential for a price bounce.
Overbought refers to market scenarios where the instrument is traded considerably higher than its fair value. Overvaluation is caused by market sentiments when there is positive news.
Like and subscribe and comment my ideas if you enjoy them!
Long!!!!

Copper Long 5/6 Special.Fundamental: 5 | Technical: 6 StacksCAPITALCOM:COPPER COPPER We trade with the odds stacked in our favour. That's confluence. Fundamental: 5 | Technical: 6 Stacks. That was we like to call the perfect trade. No such thing however when the stars align we pull the trigger. Copper supported by infrastructure demand and tight supply; technicals show sustained strength near
$4.90.

#033: Long Investment Opportunity on AUD/CAD
The Australian dollar/Canadian dollar exchange rate has been consolidating for several sessions, establishing a clean base just above a key demand area. Hello, I'm Forex Trader Andrea Russo, an independent trader and prop trader with $200,000 in capital under management. Thank you in advance for your time.
It's not just the support itself that's interesting, but also the way the price has reacted each time it's tested: strong rejections, increasing volume, and clear signs of institutional traders absorbing the market.
On higher timeframes, the bearish pressure is showing signs of exhaustion. The latest candles have pronounced lower wicks, a sign that buyers are returning to activity while the sellers' pressure is slowing. The price continues to move within a descending channel, but the structure is starting to show the first signs of a possible reversal.
Volumes also tell the same story: each test of the low zone has been accompanied by an increase in activity, typical of an accumulation phase. The main moving averages are flattening, confirming a loss of strength in the previous trend.
From a macro perspective, the Australian dollar continues to benefit from the stability of the commodity market and a relatively neutral monetary policy, while the Canadian dollar is suffering from the recent weakening of oil prices. This intermarket divergence often heralds a corrective or impulsive move in favor of the AUD.
In summary, the technical and fundamental context suggests a possible resumption of bullish momentum. However, it will be crucial to wait for a decisive close above the short-term resistance zone to confirm the entry of directional momentum.

AUDCHF: Bullish Continuation & Long Trade
AUDCHF
- Classic bullish formation
- Our team expects growth
SUGGESTED TRADE:
Swing Trade
Buy AUDCHF
Entry Level - 0.5184
Sl - 0.5177
Tp - 0.5200
Our Risk - 1%
Start protection of your profits from lower levels
Disclosure: I am part of Trade Nation's Influencer program and receive a monthly fee for using their TradingView charts in my analysis.
❤️ Please, support our work with like & comment! ❤️

AUDUSD Eyes 0.64500 Support as Bullish Structure Holds FirmHey Traders,
In today’s session, we’re closely monitoring AUDUSD for a potential buying opportunity around the 0.64500 zone. The pair continues to trade within a broader uptrend, and the current pullback appears to be a healthy correction toward a key support and resistance confluence near 0.64500.
A sustained reaction from this level could reaffirm the bullish structure, opening the door for a continuation toward recent highs if momentum aligns with a weaker USD backdrop.
Trade safe,
Joe.

Gold Eyes 4,200 as Pullback Near 4,070 Sets Stage for Next BreakHey Traders,
In today’s session, we’re monitoring XAUUSD for a buying opportunity around the 4,070 zone. Gold remains in a strong uptrend, and after setting a fresh all-time high, price is now pulling back toward key trend support.
This area has been acting as a critical demand zone, and a bullish reaction here could trigger the next leg higher — potentially toward the 4,200 mark.
With safe-haven demand still elevated and DXY under pressure, the broader context continues to favor further upside in Gold.
Trade safe,
Joe.

USDCHF Sellers In Panic! BUY!
My dear friends,
My technical analysis for USDCHF is below:
The market is trading on 0.7991 pivot level.
Bias - Bullish
Technical Indicators: Both Super Trend & Pivot HL indicate a highly probable Bullish continuation.
Target - 0.8026
About Used Indicators:
A pivot point is a technical analysis indicator, or calculations, used to determine the overall trend of the market over different time frames.
Disclosure: I am part of Trade Nation's Influencer program and receive a monthly fee for using their TradingView charts in my analysis.
———————————
WISH YOU ALL LUCK

USDCHF Is Going Up! Long!
Please, check our technical outlook for USDCHF.
Time Frame: 9h
Current Trend: Bullish
Sentiment: Oversold (based on 7-period RSI)
Forecast: Bullish
The market is approaching a significant support area 0.800.
The underlined horizontal cluster clearly indicates a highly probable bullish movement with target 0.809 level.
P.S
Please, note that an oversold/overbought condition can last for a long time, and therefore being oversold/overbought doesn't mean a price rally will come soon, or at all.
Like and subscribe and comment my ideas if you enjoy them!

EURGBP Will Grow! Buy!
Here is our detailed technical review for EURGBP.
Time Frame: 1h
Current Trend: Bullish
Sentiment: Oversold (based on 7-period RSI)
Forecast: Bullish
The market is on a crucial zone of demand 0.870.
The oversold market condition in a combination with key structure gives us a relatively strong bullish signal with goal 0.871 level.
P.S
The term oversold refers to a condition where an asset has traded lower in price and has the potential for a price bounce.
Overbought refers to market scenarios where the instrument is traded considerably higher than its fair value. Overvaluation is caused by market sentiments when there is positive news.
Like and subscribe and comment my ideas if you enjoy them!

GOLD Will Move Higher! Buy!
Please, check our technical outlook for GOLD.
Time Frame: 8h
Current Trend: Bullish
Sentiment: Oversold (based on 7-period RSI)
Forecast: Bullish
The market is approaching a significant support area 4,069.35.
The underlined horizontal cluster clearly indicates a highly probable bullish movement with target 4,202.88 level.
P.S
We determine oversold/overbought condition with RSI indicator.
When it drops below 30 - the market is considered to be oversold.
When it bounces above 70 - the market is considered to be overbought.
Like and subscribe and comment my ideas if you enjoy them!

GBPUSD Will Go Up From Support! Long!
Please, check our technical outlook for GBPUSD.
Time Frame: 4h
Current Trend: Bullish
Sentiment: Oversold (based on 7-period RSI)
Forecast: Bullish
The market is trading around a solid horizontal structure 1.327.
The above observations make me that the market will inevitably achieve 1.334 level.
P.S
Overbought describes a period of time where there has been a significant and consistent upward move in price over a period of time without much pullback.
Like and subscribe and comment my ideas if you enjoy them!

NZD/USD BULLISH BIAS RIGHT NOW| LONG
NZD/USD SIGNAL
Trade Direction: long
Entry Level: 0.572
Target Level: 0.596
Stop Loss: 0.555
RISK PROFILE
Risk level: medium
Suggested risk: 1%
Timeframe: 1D
Disclosure: I am part of Trade Nation's Influencer program and receive a monthly fee for using their TradingView charts in my analysis.
✅LIKE AND COMMENT MY IDEAS✅

EUR/GBP - Multi time frame Analysis🔥 EUR/GBP — Fun but Deeper MTF Plan 🔥
Bias
Bullish across HTFs. Weekly + Daily demand stacked (0.8680–0.8700 riding on top of 0.8580–0.8620). Liquidity trendline above = magnet 🎯
Technical Breakdown
Weekly : Rising wedge grind, BOS history intact. As long as 0.8580 holds, topside liquidity at 0.8780–0.8800 is the draw.
Daily : Fresh reaction from 0.8680–0.8700 demand; higher-low structure pointing to 0.8750–0.8770 first stop.
1H : Sweep → MSS over 50EMA. Grey 1H POI 0.8690–0.8705 = sweet dip zone. If deeper, last defensive line is 0.8680 (daily base).
Execution (Scenarios)
A) Quick tag & go (primary):
Buy 0.8690–0.8705 → TP1 0.8745, TP2 0.8758, TP3 0.8775–0.8785 (liquidity sweep).
SL: 0.8672 (clean under daily base). R:R ≈ 1:2–1:3.
B) Deeper discount (secondary):
If we flush the POI, watch 0.8680–0.8688 for a wick + reclaim → same targets.
SL: 0.8665.
Risk Management
Risk 0.5–1% per idea. Scale out 30/40/30 at TP1/TP2/TP3.
If 1H closes below 0.8680, step aside—bull script broken short-term.
No chasing above 0.8750; wait for a pullback or a clean breakout-retest.
Trader Checklist ✅
HTF bias aligns? ✔️
Price into 1H POI or daily base? ✔️
M5/M15 shift back to bullish on entry? ✔️
Spread/news clean? ✔️
Then send it 🚀

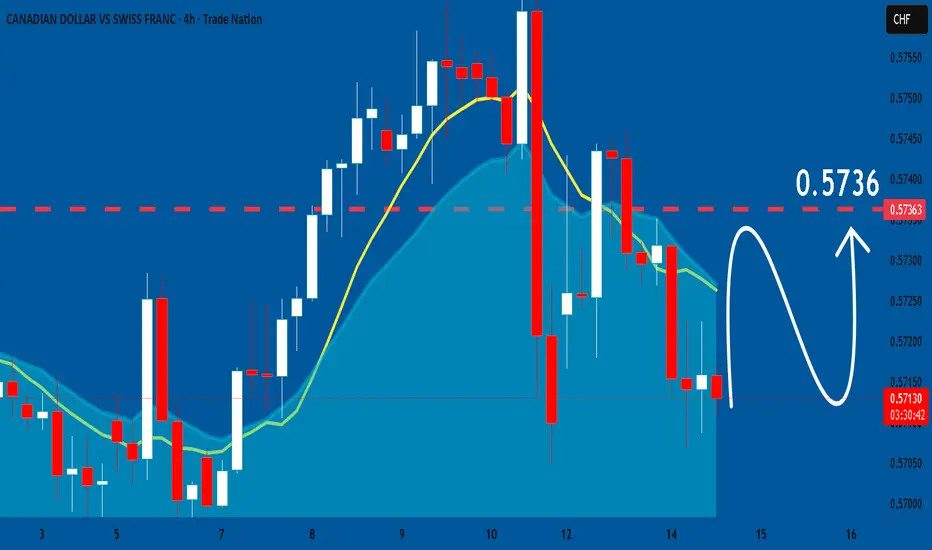
CADCHF: Growth & Bullish Forecast
Remember that we can not, and should not impose our will on the market but rather listen to its whims and make profit by following it. And thus shall be done today on the CADCHF pair which is likely to be pushed up by the bulls so we will buy!
Disclosure: I am part of Trade Nation's Influencer program and receive a monthly fee for using their TradingView charts in my analysis.
❤️ Please, support our work with like & comment! ❤️
AUDJPY Massive Long! BUY!
My dear subscribers,
AUDJPY looks like it will make a good move, and here are the details:
The market is trading on 98.180 pivot level.
Bias - Bullish
Technical Indicators: Both Super Trend & Pivot HL indicate a highly probable Bullish continuation.
Target - 98.364
About Used Indicators:
The average true range (ATR) plays an important role in 'Supertrend' as the indicator uses ATR to calculate its value. The ATR indicator signals the degree of price volatility.
Disclosure: I am part of Trade Nation's Influencer program and receive a monthly fee for using their TradingView charts in my analysis.
———————————
WISH YOU ALL LUCK

BTCUSD: Price can Rebound Up from Support line of PennantHello everyone, here is my breakdown of the current Bitcoin setup.
Market Analysis
Bitcoin has been through an incredibly volatile cycle. After reversing from a major low near the 109400 Support, we saw a powerful rally that led to a new ATH around 126000. Since that peak, the market has been in a deep and complex corrective phase.
Currently, this correction has taken the shape of a large pennant or wedge pattern. The price is consolidating and coiling within this structure. After a recent test of the upper boundary, the price is now pulling back towards the ascending support line for what I see as a critical test.
My Scenario & Strategy
I view the current pullback to the support line as a healthy correction and a logical place for buyers to show interest and defend the structure. A confirmed and strong bounce from this dynamic support would be the key signal for me that the pullback is over and the market is ready to challenge the highs again.
Therefore, the strategy is to watch for this bounce. A successful rebound is expected to lead to a rally that will break the intermediate Resistance at 117300. The primary target for the subsequent move is 118600, which aligns with the resistance line of the pennant.
That's the setup I'm tracking. Thank you for your attention, and always manage your risk.

AUDNZD Technical Analysis! BUY!
My dear friends,
Please, find my technical outlook for AUDNZD below:
The price is coiling around a solid key level - 1.1328
Bias -Bullish
Technical Indicators: Pivot Points Low anticipates a potential price reversal.
Super trend shows a clear buy, giving a perfect indicators' convergence.
Goal - 1.1361
Safe Stop Loss - 1.1311
About Used Indicators:
The pivot point itself is simply the average of the high, low and closing prices from the previous trading day.
Disclosure: I am part of Trade Nation's Influencer program and receive a monthly fee for using their TradingView charts in my analysis.
———————————
WISH YOU ALL LUCK

USOIL LONG FROM SUPPORT
USOIL SIGNAL
Trade Direction: long
Entry Level: 58.07
Target Level: 63.04
Stop Loss: 54.76
RISK PROFILE
Risk level: medium
Suggested risk: 1%
Timeframe: 9h
Disclosure: I am part of Trade Nation's Influencer program and receive a monthly fee for using their TradingView charts in my analysis.
✅LIKE AND COMMENT MY IDEAS✅

AUD/CHF BULLS WILL DOMINATE THE MARKET|LONG
AUD/CHF SIGNAL
Trade Direction: long
Entry Level: 0.518
Target Level: 0.524
Stop Loss: 0.514
RISK PROFILE
Risk level: medium
Suggested risk: 1%
Timeframe: 4h
Disclosure: I am part of Trade Nation's Influencer program and receive a monthly fee for using their TradingView charts in my analysis.
✅LIKE AND COMMENT MY IDEAS✅

NZD/CHF SENDS CLEAR BULLISH SIGNALS|LONG
Hello, Friends!
NZD/CHF downtrend evident from the last 1W red candle makes longs trades more risky, but the current set-up targeting 0.460 area still presents a good opportunity for us to buy the pair because the support line is nearby and the BB lower band is close which indicates the oversold state of the NZD/CHF pair.
Disclosure: I am part of Trade Nation's Influencer program and receive a monthly fee for using their TradingView charts in my analysis.
✅LIKE AND COMMENT MY IDEAS✅

NZDJPY Will Go Higher! Buy!
Here is our detailed technical review for NZDJPY.
Time Frame: 2h
Current Trend: Bullish
Sentiment: Oversold (based on 7-period RSI)
Forecast: Bullish
The market is testing a major horizontal structure 86.456.
Taking into consideration the structure & trend analysis, I believe that the market will reach 87.323 level soon.
P.S
Please, note that an oversold/overbought condition can last for a long time, and therefore being oversold/overbought doesn't mean a price rally will come soon, or at all.
Like and subscribe and comment my ideas if you enjoy them!

GBPJPY Will Go Up! Long!
Take a look at our analysis for GBPJPY.
Time Frame: 1h
Current Trend: Bullish
Sentiment: Oversold (based on 7-period RSI)
Forecast: Bullish
The market is approaching a key horizontal level 201.854.
Considering the today's price action, probabilities will be high to see a movement to 202.612.
P.S
The term oversold refers to a condition where an asset has traded lower in price and has the potential for a price bounce.
Overbought refers to market scenarios where the instrument is traded considerably higher than its fair value. Overvaluation is caused by market sentiments when there is positive news.
Like and subscribe and comment my ideas if you enjoy them!

EURCHF: Bullish Continuation is Highly Probable! Here is Why:
Balance of buyers and sellers on the EURCHF pair, that is best felt when all the timeframes are analyzed properly is shifting in favor of the buyers, therefore is it only natural that we go long on the pair.
Disclosure: I am part of Trade Nation's Influencer program and receive a monthly fee for using their TradingView charts in my analysis.
❤️ Please, support our work with like & comment! ❤️
