GBP/NZD BULLISH BIAS RIGHT NOW| LONG
Hello, Friends!
GBP/NZD pair is trading in a local downtrend which we know by looking at the previous 1W candle which is red. On the 6H timeframe the pair is going down too. The pair is oversold because the price is close to the lower band of the BB indicator. So we are looking to buy the pair with the lower BB line acting as support. The next target is 2.323 area.
Disclosure: I am part of Trade Nation's Influencer program and receive a monthly fee for using their TradingView charts in my analysis.
✅LIKE AND COMMENT MY IDEAS✅
Long!!!!

USD/JPY - Multi timeframe Analysis🔥 USD/JPY — Bit More In-Depth, Still Punchy
🧭 Weekly (HTF Bias)
Trend up. We just tagged 153–154 weekly supply (prior rejection zone).
Two paths:
Clean break & hold above 154 → 156–157 magnet 🎯
Wick/reject here → corrective dip toward 149–150 (old highs + demand).
📆 Daily (Structure Check)
Clear BOS up; daily 50-EMA + structure stack around 149.2–150.2 = prime buy-the-dip area.
Expect a liquidity sweep under 150, then reclaim → rerun 153.5–154.
Daily close <147.8–147.5 = momentum shift ⚠️
⏰ 8H (Execution Map)
Rising liquidity trendline guiding pullbacks.
Buy Zone 1: 149.2–150.2 (trendline + demand + prior high).
Buy Zone 2 (deep discount): 144.8–145.6 if we get a full flush.
Above 151.5–152 and holding? Bulls may skip the deep dip and rocket straight back into 153–154 🚀
🧩 Trade Plan (rules-ish)
Primary idea (pro-trend):
Wait for sweep/reclaim of 150 on LTF (H1/H4 close back above).
Entry : 149.8–150.2 retest.
TPs: 152.2 → 153.5 → 154.8–155.2.
Invalidation : H4 close <149.0 (safer: <147.8).
Alt (only if strong breakout):
H4 close >154.2 + retest holds → ride to 156.0–157.0.
Counter-trend scalp (advanced): bearish wick rejection inside 153.5–154.2 → tag 151.6–150.8 “snack stop,” then look to flip long.
Summary : Bias bullish, hunting a dip to 150 for continuation. Lose 147.8 and the script changes.

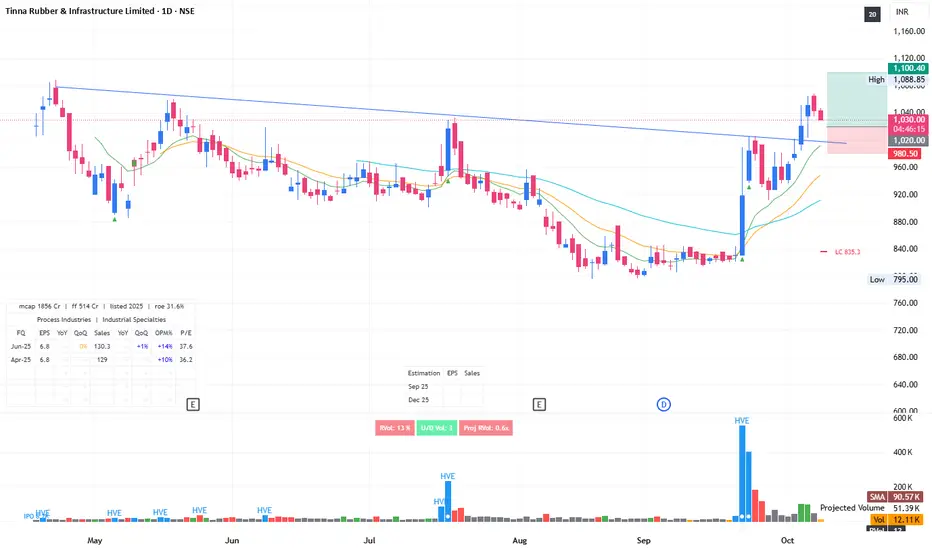
IPO base breakout - retestThis stock follows IPO breakout strategy. Currently retesting with very light volume. One can look at adding in range of 1020 - 1030 and over the couple of months, this could give good returns.
Follow string 5% SL rule from your buy price.
NZDUSD Eyes 0.5730 Rebound as Dollar Weakens Near DXY ResistanceHey Traders,
In today's trading session, we are monitoring NZDUSD for a buying opportunity around the 0.57300 zone. The pair has been moving within a descending channel and is now approaching the lower boundary, suggesting potential for a technical rebound from channel support.
From a macro perspective, the bearish bias on the U.S. Dollar—driven by the ongoing government shutdown and sustained pressure near the 98.800 resistance on DXY—could further support upside momentum in NZDUSD.
Trade safe,
Joe.

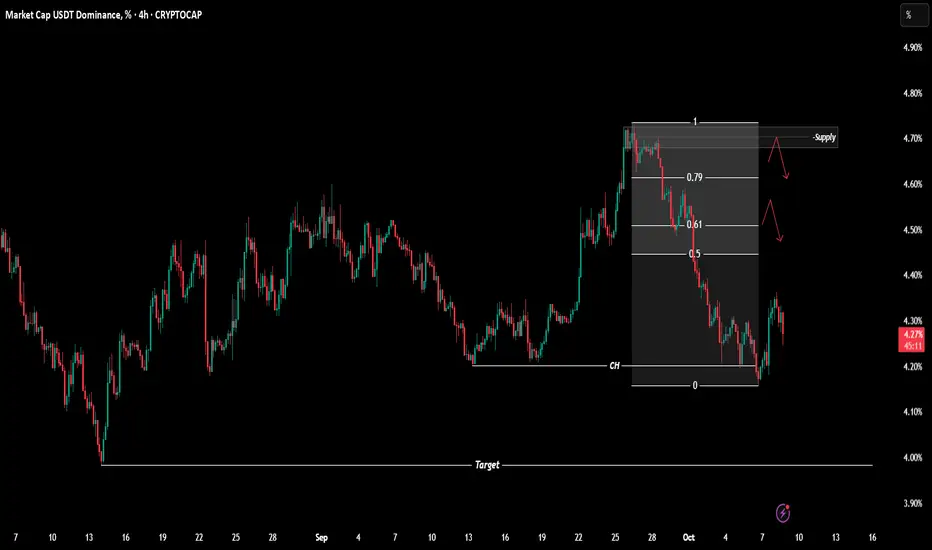
$USDT.D Analysis - Oct 8 | 4H Time FrameCRYPTOCAP:USDT.D Analysis - 4H
Hello and welcome to another analysis from the Satoshi Frame team!
I’m Abolfazl, and today we’re going to analyze Bitcoin on the 4-hour timeframe.
USDT dominance has shown a trend reversal on the 4-hour timeframe and has turned bearish.
The OTE zone and the marked supply area could act as potential rejection zones if dominance makes a short-term pullback upward.
On the other hand, we could also see another drop from the current level, moving toward the lower support area near the recent low.
The main target (4%) is already marked on the chart.
See you in the next analyses!
Stay tuned with the Satoshi Frame team...
$BTCUSDT Analysis - Oct 8 | 4H Time FrameBINANCE:BTCUSDT Analysis - 4H
Hello and welcome to another analysis from the Satoshi Frame team!
I’m Abolfazl, and today we’re going to analyze Bitcoin on the 4-hour timeframe.
Bitcoin has been rejected from the $120,000 level, and we currently expect it to move toward the all-time high.
You can look for entry confirmations on the 15-minute timeframe.
See you in the next analyses!
Stay tuned with the Satoshi Frame team...

GBPAUD What Next? BUY!
My dear subscribers,
My technical analysis for GBPAUDis below:
The price is coiling around a solid key level - 2.0332
Bias - Bullish
Technical Indicators: Pivot Points High anticipates a potential price reversal.
Super trend shows a clear buy, giving a perfect indicators' convergence.
Goal - 2.0375
About Used Indicators:
By the very nature of the supertrend indicator, it offers firm support and resistance levels for traders to enter and exit trades. Additionally, it also provides signals for setting stop losses
Disclosure: I am part of Trade Nation's Influencer program and receive a monthly fee for using their TradingView charts in my analysis.
———————————
WISH YOU ALL LUCK

EURUSD My Opinion! BUY!
My dear followers,
I analysed this chart on EURUSD and concluded the following:
The market is trading on 1.1633 pivot level.
Bias - Bullish
Technical Indicators: Both Super Trend & Pivot HL indicate a highly probable Bullish continuation.
Target - 1.1677
About Used Indicators:
A super-trend indicator is plotted on either above or below the closing price to signal a buy or sell. The indicator changes color, based on whether or not you should be buying. If the super-trend indicator moves below the closing price, the indicator turns green, and it signals an entry point or points to buy.
Disclosure: I am part of Trade Nation's Influencer program and receive a monthly fee for using their TradingView charts in my analysis.
———————————
WISH YOU ALL LUCK

BITCOIN Is Bullish! Long!
Take a look at our analysis for BITCOIN.
Time Frame: 1h
Current Trend: Bullish
Sentiment: Oversold (based on 7-period RSI)
Forecast: Bullish
The market is approaching a key horizontal level 123,044.94.
Considering the today's price action, probabilities will be high to see a movement to 125,510.67.
P.S
Overbought describes a period of time where there has been a significant and consistent upward move in price over a period of time without much pullback.
Like and subscribe and comment my ideas if you enjoy them!

EURUSD Is Very Bullish! Buy!
Please, check our technical outlook for EURUSD.
Time Frame: 3h
Current Trend: Bullish
Sentiment: Oversold (based on 7-period RSI)
Forecast: Bullish
The market is approaching a significant support area 1.163.
The underlined horizontal cluster clearly indicates a highly probable bullish movement with target 1.167 level.
P.S
Please, note that an oversold/overbought condition can last for a long time, and therefore being oversold/overbought doesn't mean a price rally will come soon, or at all.
Like and subscribe and comment my ideas if you enjoy them!

GBPAUD Will Grow! Long!
Take a look at our analysis for GBPAUD.
Time Frame: 3h
Current Trend: Bullish
Sentiment: Oversold (based on 7-period RSI)
Forecast: Bullish
The price is testing a key support 2.042.
Current market trend & oversold RSI makes me think that buyers will push the price. I will anticipate a bullish movement at least to 2.048 level.
P.S
We determine oversold/overbought condition with RSI indicator.
When it drops below 30 - the market is considered to be oversold.
When it bounces above 70 - the market is considered to be overbought.
Like and subscribe and comment my ideas if you enjoy them!

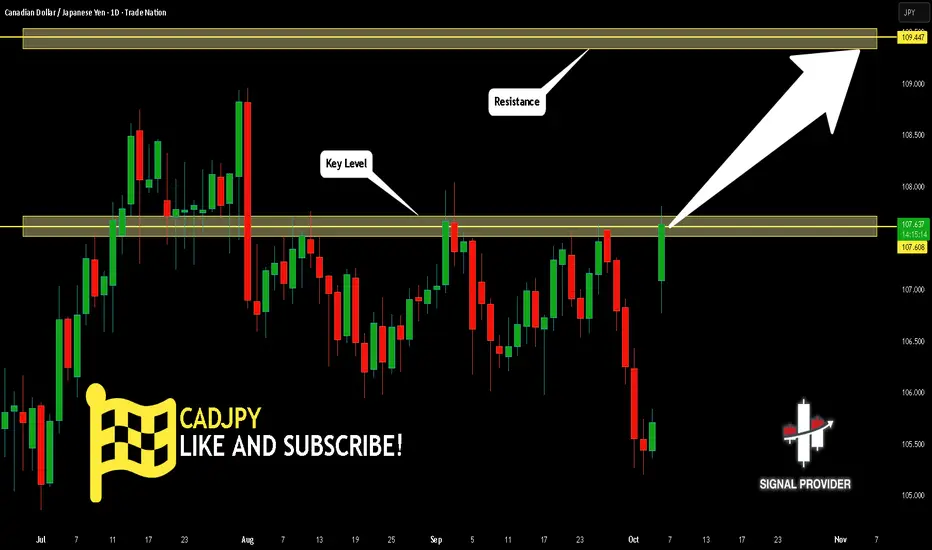
CADJPY Is Going Up! Long!
Here is our detailed technical review for CADJPY.
Time Frame: 1D
Current Trend: Bullish
Sentiment: Oversold (based on 7-period RSI)
Forecast: Bullish
The market is testing a major horizontal structure 107.608.
Taking into consideration the structure & trend analysis, I believe that the market will reach 109.447 level soon.
P.S
We determine oversold/overbought condition with RSI indicator.
When it drops below 30 - the market is considered to be oversold.
When it bounces above 70 - the market is considered to be overbought.
Like and subscribe and comment my ideas if you enjoy them!
GOLD Will Go Higher From Support! Buy!
Please, check our technical outlook for GOLD.
Time Frame: 1h
Current Trend: Bullish
Sentiment: Oversold (based on 7-period RSI)
Forecast: Bullish
The market is trading around a solid horizontal structure 3,958.06.
The above observations make me that the market will inevitably achieve 4,000.95 level.
P.S
Overbought describes a period of time where there has been a significant and consistent upward move in price over a period of time without much pullback.
Like and subscribe and comment my ideas if you enjoy them!

EURUSD: Reversal from the Lows and Up MoveHello everyone, here is my breakdown of the current Euro setup.
Market Analysis
From a broader perspective, the price of EURUSD has shifted into a bearish phase after a prior Upward Channel failed and broke down. This reversal led to the formation of the current Downward Wedge, a pattern that has been guiding the price lower.
Currently, the price is at a critical decision point. After a complex series of moves, it is now testing the lower support line of the wedge, which aligns with the major Support at the 1.1615 level.
My Scenario & Strategy
My scenario is built on the idea of a 'fake breakdown' at this key support. I'm looking for the price to dip briefly below the wedge's support line into the Support zone to hunt for liquidity, and then quickly reverse.
A swift reclaim of the wedge's interior would be a powerful signal that sellers are exhausted and a bullish reversal is underway. This is the key confirmation I am waiting for.
Therefore, the strategy is to watch for this reclaim. A successful reversal would validate the long scenario. The primary target for the subsequent rally is the Wedge Resistance Line at the 1.1670.
That's the setup I'm tracking. Thank you for your attention, and always manage your risk.

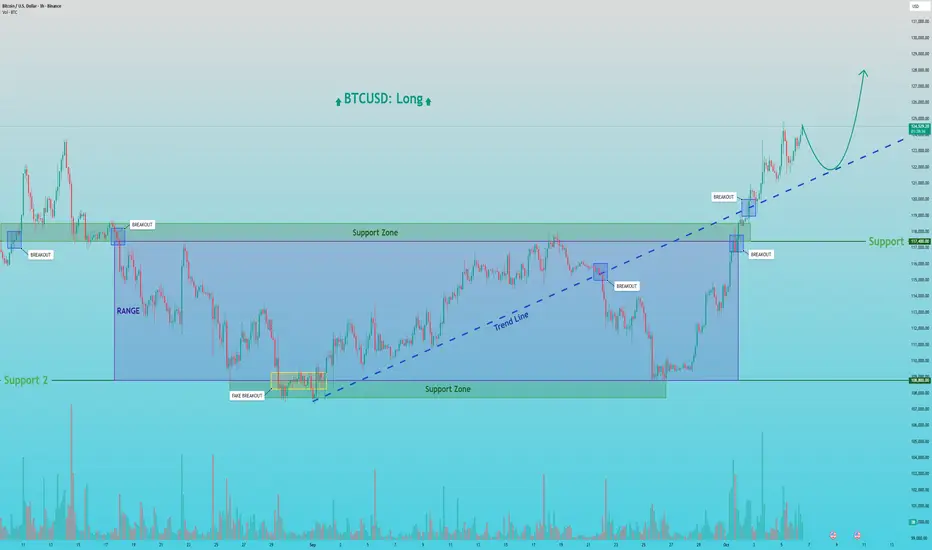
BTCUSD: Is This the Breakout to a New All-Time High?Hello everyone, here is my breakdown of the current Bitcoin setup.
Market Analysis
From a broader perspective, the price action for Bitcoin has been complex, culminating in a powerful breakout. After a fake breakdown below the 108800 Support level, the price reversed strongly, broke out of its consolidation range, and also pushed above a major trend line.
This series of events shows significant bullish strength. Currently, after this strong breakout, the price is in a natural corrective phase, pulling back to retest the broken structures from above.
My Scenario & Strategy
My scenario is built on the idea that this breakout is valid and the uptrend will continue. I see the current pullback as a classic retest, offering a potential opportunity to join the new bullish momentum.
I'm looking for the price to complete its correction to the broken trend line. A confirmed and strong bounce from this line would be the key signal for me that the pullback is over and the primary trend is ready to resume.
Therefore, the strategy is to watch for this bounce. A successful defense of the trend line would validate the long scenario. My new target for the next impulsive wave higher is 128000, which would be a new ATH.
That's the setup I'm tracking. Thank you for your attention, and always manage your risk.
NZD/USD BULLS ARE GAINING STRENGTH|LONG
NZD/USD SIGNAL
Trade Direction: long
Entry Level: 0.576
Target Level: 0.584
Stop Loss: 0.571
RISK PROFILE
Risk level: medium
Suggested risk: 1%
Timeframe: 9h
Disclosure: I am part of Trade Nation's Influencer program and receive a monthly fee for using their TradingView charts in my analysis.
✅LIKE AND COMMENT MY IDEAS✅

EUR/USD BUYERS WILL DOMINATE THE MARKET|LONG
Hello, Friends!
We are now examining the EUR/USD pair and we can see that the pair is going down locally while also being in a downtrend on the 1W TF. But there is also a powerful signal from the BB lower band being nearby indicating that the pair is oversold so we can go long from the support line below and a target at 1.168 level.
Disclosure: I am part of Trade Nation's Influencer program and receive a monthly fee for using their TradingView charts in my analysis.
✅LIKE AND COMMENT MY IDEAS✅

Long CAKEUSDT (D1). x3-x5 probablyLong CAKEUSDT. x3-x5 probably
entry - current level
TP1 - 10
SL - close below DMA200 (around 2.3 with confirmation on daily TF)
FA.
BSC DEX from last cycle.
BSC narrative.
TA.
1) High-volume buys in feb-march 2025 on a second retest of the lows (1.5 zone).
2) 200DMA - strong support for 3-4 months.
3) Just look at BNB/USDT chart and you'll get it :)
No need to overcomplicate.
p.s. NFA, DYOR

GBPUSD: Bulls Will Push
The charts are full of distraction, disturbance and are a graveyard of fear and greed which shall not cloud our judgement on the current state of affairs in the GBPUSD pair price action which suggests a high likelihood of a coming move up.
Disclosure: I am part of Trade Nation's Influencer program and receive a monthly fee for using their TradingView charts in my analysis.
❤️ Please, support our work with like & comment! ❤️

NZDUSD Set To Grow! BUY!
My dear friends,
NZDUSD looks like it will make a good move, and here are the details:
The market is trading on 0.5813 pivot level.
Bias - Bullish
Technical Indicators: Supper Trend generates a clear long signal while Pivot Point HL is currently determining the overall Bullish trend of the market.
Goal - 0.5830
About Used Indicators:
Pivot points are a great way to identify areas of support and resistance, but they work best when combined with other kinds of technical analysis
Disclosure: I am part of Trade Nation's Influencer program and receive a monthly fee for using their TradingView charts in my analysis.
———————————
WISH YOU ALL LUCK

ASX Weekly Market Wrap: XJO, LYC, CBA, BHP, CSL, ANZ, WDS, EOSIn this week’s market analysis of the Australian market , we break down key price movements and trends across the #ASX, with a close look at the XJO and standout stocks like Lynas Rare Earths (#LYC), Commonwealth Bank (#CBA), BHP Group (#BHP), CSL Limited (#CSL), ANZ Bank (#ANZ), Woodside (#WDS), and EOS (#EOS).
We explore current momentum, trend direction, and price action indicators to help you understand Aussie market developments. Whether you're paper trading or keeping track of market trends, this is your essential guide for the week ahead.
*Apologies for the incorrectly dated chart of 2027! We are not there yet! 😅

Gold - 4H Forecast ☀️ GOLD – 4H Forecast ☀️
Alright gold gang, let’s talk business — XAU/USD is setting up for something clean 👇
🧠 Bias :
Still bullish overall, but we’re chilling in premium territory, and this structure screams “pullback incoming.” Expect a retrace before the next rocket launch 🚀.
🧩 Technical Breakdown:
Price just printed a Buy-Side Liquidity (BSL) grab up top — textbook liquidity sweep before a potential correction.
We’ve got a strong impulsive leg pushing off a 4H + Daily demand confluence around $3,850–$3,880.
The 71% fib retracement zone aligns beautifully with that 4H demand, creating a prime reload area if price dips.
The volume profile gap (POI) also hints at untested liquidity sitting below current highs.
🎯 Trade Idea:
Entry Zone: $3,880–$3,860 (4H & Daily demand overlap)
Target 1: $3,970 (current high retest)
Target 2: $4,010+ (continuation into new impulse)
Invalidation: Below $3,830 (break of structure + demand failure)
⚙️ Risk Management:
Keep risk tight — 1%–1.5% max. If we get a reaction at the 71% level, partials at $3,950 are smart to secure profits before the next leg.
💬 Summary :
Gold just ran buy-side liquidity and looks ready to dip into discount before ripping higher again. If we get a clean 4H or 1H confirmation in the demand, expect another bullish leg to unfold.

GBPUSD Will Go Up From Support! Long!
Here is our detailed technical review for GBPUSD.
Time Frame: 3h
Current Trend: Bullish
Sentiment: Oversold (based on 7-period RSI)
Forecast: Bullish
The market is testing a major horizontal structure 1.344.
Taking into consideration the structure & trend analysis, I believe that the market will reach 1.348 level soon.
P.S
Please, note that an oversold/overbought condition can last for a long time, and therefore being oversold/overbought doesn't mean a price rally will come soon, or at all.
Like and subscribe and comment my ideas if you enjoy them!
