GBPCAD Technical Analysis! BUY!
My dear subscribers,
This is my opinion on the GBPCAD next move:
The instrument tests an important psychological level 1.8738
Bias - Bullish
Technical Indicators: Supper Trend gives a precise Bullish signal, while Pivot Point HL predicts price changes and potential reversals in the market.
Target - 1.8766
My Stop Loss - 1.8722
About Used Indicators:
On the subsequent day, trading above the pivot point is thought to indicate ongoing bullish sentiment, while trading below the pivot point indicates bearish sentiment.
Disclosure: I am part of Trade Nation's Influencer program and receive a monthly fee for using their TradingView charts in my analysis.
———————————
WISH YOU ALL LUCK
Long!!!!

EURUSD Massive Long! BUY!
My dear friends,
My technical analysis for EUR/USD is below:
The market is trading on 1.1659 pivot level.
Bias - Bullish
Technical Indicators: Both Super Trend & Pivot HL indicate a highly probable Bullish continuation.
Target - 1.1691
About Used Indicators:
A pivot point is a technical analysis indicator, or calculations, used to determine the overall trend of the market over different time frames.
Disclosure: I am part of Trade Nation's Influencer program and receive a monthly fee for using their TradingView charts in my analysis.
———————————
WISH YOU ALL LUCK

NZD/CAD BULLS WILL DOMINATE THE MARKET|LONG
Hello, Friends!
NZD/CAD downtrend evident from the last 1W red candle makes longs trades more risky, but the current set-up targeting 0.814 area still presents a good opportunity for us to buy the pair because the support line is nearby and the BB lower band is close which indicates the oversold state of the NZD/CAD pair.
Disclosure: I am part of Trade Nation's Influencer program and receive a monthly fee for using their TradingView charts in my analysis.
✅LIKE AND COMMENT MY IDEAS✅

EURCAD: Will Keep Growing! Here is Why:
The price of EURCAD will most likely increase soon enough, due to the demand beginning to exceed supply which we can see by looking at the chart of the pair.
Disclosure: I am part of Trade Nation's Influencer program and receive a monthly fee for using their TradingView charts in my analysis.
❤️ Please, support our work with like & comment! ❤️
EURUSD: Bullish Continuation & Long Trade
EURUSD
- Classic bullish setup
- Our team expects bullish continuation
SUGGESTED TRADE:
Swing Trade
Long EURUSD
Entry Point - 1.1665
Stop Loss - 1.1653
Take Profit - 1.1695
Our Risk - 1%
Start protection of your profits from lower levels
Disclosure: I am part of Trade Nation's Influencer program and receive a monthly fee for using their TradingView charts in my analysis.
❤️ Please, support our work with like & comment! ❤️

$ETH – Trend Still IntactCRYPTOCAP:ETH has been overall bullish after breaking above the $4,230 neckline and retesting it as support.
We’ll be looking for trend-following longs as long as the red trendline holds, expecting the bullish momentum to continue toward the $4,800 resistance and potentially the $5,000 psychological level.
A break below the trendline would signal a short-term correction before the next leg higher.
⚠️ Disclaimer: This is not financial advice. Always do your own research and manage risk properly.
📚 Stick to your trading plan regarding entries, risk, and management.
Good luck! 🍀
All Strategies Are Good; If Managed Properly!
~Richard Nasr

BTCUSD Setup You Can’t MissHey everyone, Kilian here!
The Bitcoin market keeps showing positive signals as the uptrend holds steady. On the technical chart, a double bottom pattern is gradually taking shape, with the first low followed by a higher low, a clear sign that buying pressure is building. At the moment, price is trading just above the neckline, a critical level that many analysts see as the key decision point for the next move.
If price holds above the neckline and confirms the breakout, the bullish scenario aiming toward 124,625 becomes stronger. But if the market slips back below this level, it could signal buyer weakness and raise the risk of a reversal.
As always, traders should wait for clear confirmation before entering, and stick to strict risk management rules in this volatile environment.
Trade safe and stay disciplined.

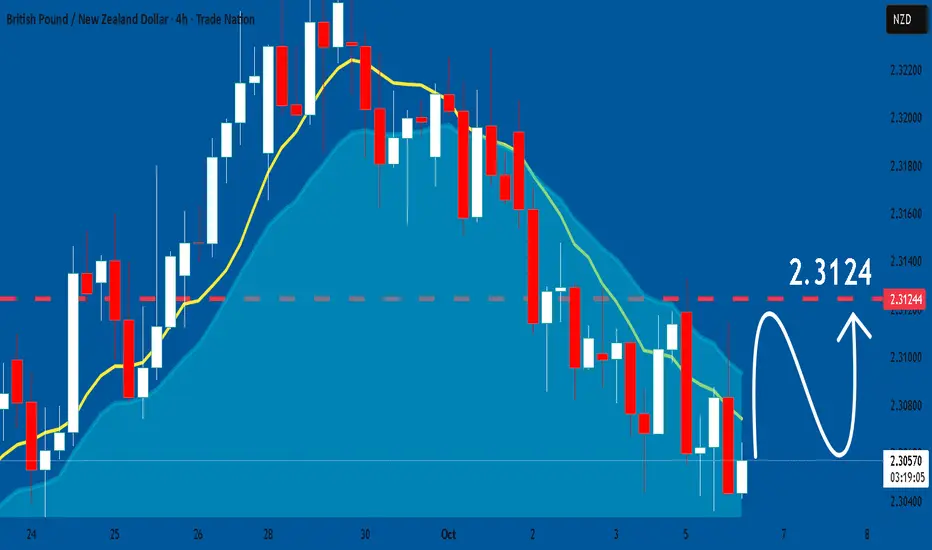
GBPNZD: Bullish Continuation is Expected! Here is Why:
Our strategy, polished by years of trial and error has helped us identify what seems to be a great trading opportunity and we are here to share it with you as the time is ripe for us to buy GBPNZD.
Disclosure: I am part of Trade Nation's Influencer program and receive a monthly fee for using their TradingView charts in my analysis.
❤️ Please, support our work with like & comment! ❤️
EURUSD Long: Bounce Expected from 1.1660 DemandHello, traders! The prior market structure for EURUSD was defined by a descending channel, from which the price eventually broke out and entered a new consolidation range. The price action within this range has seen a rotation from the 1.1780 supply level down to the 1.1660 demand level, where buyer initiative has re-emerged.
Currently, the auction is trading near this 1.1660 demand level after a reversal from the lows. The market is showing signs of building support in this zone, suggesting that the corrective move from the range highs may be complete.
My scenario for the development of events is that after a final small correction, the price will continue its growth within the consolidation. I believe a successful defense of the demand zone will trigger a new rotation to the upside. The take-profit is therefore set at 1.1750, targeting the upper portion of the range. Manage your risk!

GBPAUD: Great Trading Opportunity
GBPAUD
- Classic bullish formation
- Our team expects growth
SUGGESTED TRADE:
Swing Trade
Buy GBPAUD
Entry Level - 2.0337
Sl - 2.0322
Tp - 2.0370
Our Risk - 1%
Start protection of your profits from lower levels
Disclosure: I am part of Trade Nation's Influencer program and receive a monthly fee for using their TradingView charts in my analysis.
❤️ Please, support our work with like & comment! ❤️

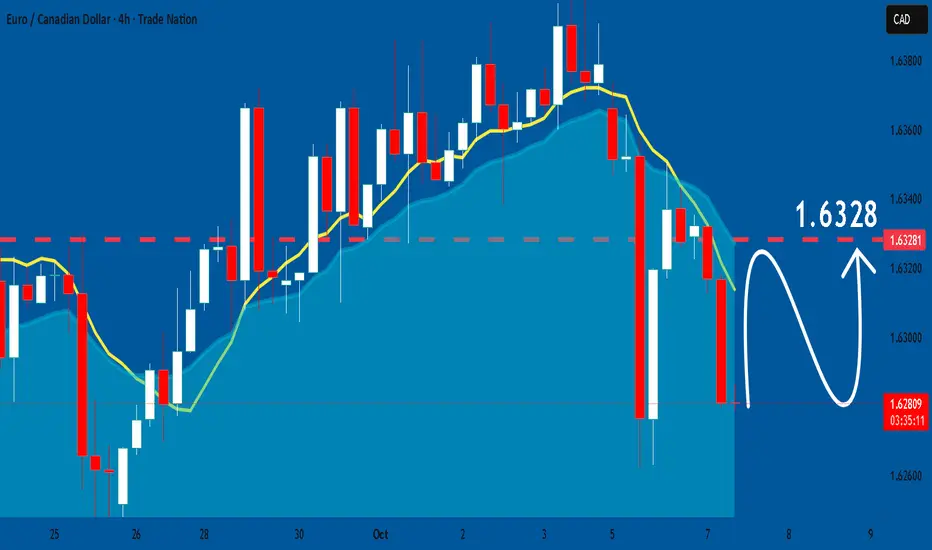
EURCAD Sellers In Panic! BUY!
My dear friends,
Please, find my technical outlook for EURCAD below:
The price is coiling around a solid key level - 1.6329
Bias - Bullish
Technical Indicators: Pivot Points High anticipates a potential price reversal.
Super trend shows a clear buy, giving a perfect indicators' convergence.
Goal - 1.6360
About Used Indicators:
The pivot point itself is simply the average of the high, low and closing prices from the previous trading day.
Disclosure: I am part of Trade Nation's Influencer program and receive a monthly fee for using their TradingView charts in my analysis.
———————————
WISH YOU ALL LUCK

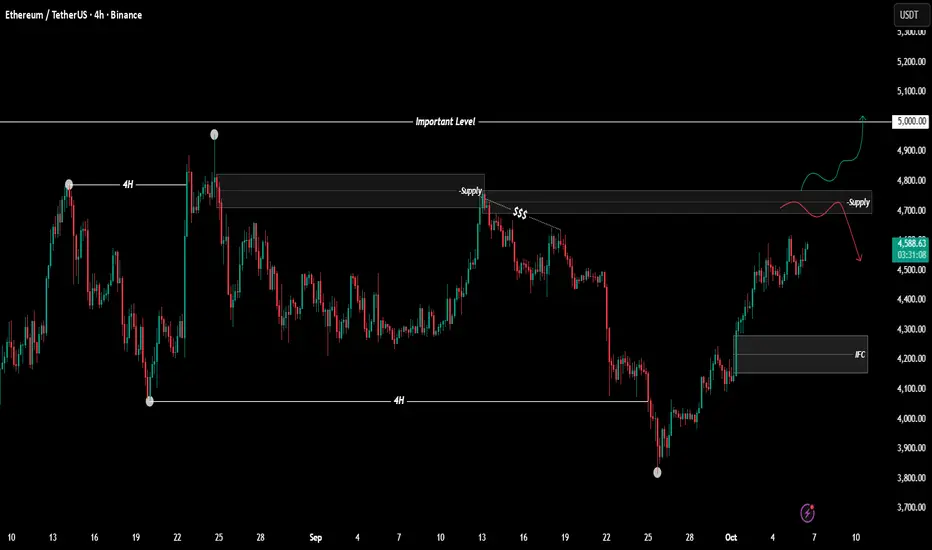
$ETHUSDT Analysis - Oct 6 | 4H Time FrameBINANCE:ETHUSDT Analysis - 4H
Hello and welcome to another analysis from the Satoshi Frame team!
I’m Abolfazl, and today we’re going to analyze Ethereum on the 4-hour timeframe.
As you know, USDT dominance has been trending downward, and the overall market structure is bullish. On the other hand, Bitcoin has set a new all-time high! Considering these factors, it’s clear that Ethereum also has the potential to move toward $5,000, which isn’t unrealistic.
From another perspective, Ethereum has shown a change of character (CHOCH) on the 4-hour timeframe, and the marked supply zone could create a pullback in price.
When the price reaches the supply zone, make sure to look for proper entry confirmations, and keep in mind that there’s a higher chance of the zone being broken and I’m personally looking for long positions.
See you in the next analyses!
Stay tuned with the Satoshi Frame team...
06/10/25 Weekly OutlookLast weeks high: $125,735.08
Last weeks low: $111,559.20
Midpoint: $118,6547.14
New All Time High for Bitcoin in the first week of "Uptober", really impressive strength since flipping $117,500.
BTC still finds itself within a range between ATH and $108,000 but with such strength on the bounce from range lows, could we see price discovery going into the last leg of the year?
From a macro perspective month/quarter end is now over and done with, banks have completed their window dressing/de-risking and we can expect liquidity to flow back into the risk markets. Rate cut cycle continues, M2 Global money supply at ATH with seemingly no plans to stop in the near future.
For now I am still treating trading BTC as it is in a range until we get price acceptance above $125,000. If there is a breakout above and a rally altcoins should follow. In terms of news releases this week because of the US Government shutdown there is a disruption on data releases but overall nothing of great importance is disrupted.
Good luck this week everybody!

EURGBP: Growth & Bullish Continuation
The recent price action on the EURGBP pair was keeping me on the fence, however, my bias is slowly but surely changing into the bullish one and I think we will see the price go up.
Disclosure: I am part of Trade Nation's Influencer program and receive a monthly fee for using their TradingView charts in my analysis.
❤️ Please, support our work with like & comment! ❤️

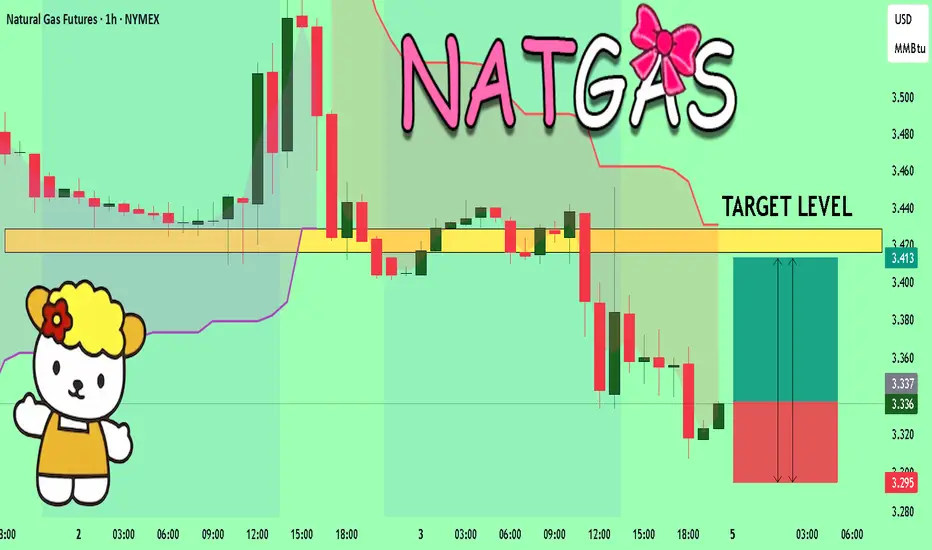
NATGAS Trading Opportunity! BUY!
My dear subscribers,
NATGAS looks like it will make a good move, and here are the details:
The market is trading on 3.336 pivot level.
Bias - Bullish
My Stop Loss - 3.295
Technical Indicators: Both Super Trend & Pivot HL indicate a highly probable Bullish continuation.
Target - 3.416
About Used Indicators:
The average true range (ATR) plays an important role in 'Supertrend' as the indicator uses ATR to calculate its value. The ATR indicator signals the degree of price volatility.
Disclosure: I am part of Trade Nation's Influencer program and receive a monthly fee for using their TradingView charts in my analysis.
———————————
WISH YOU ALL LUCK
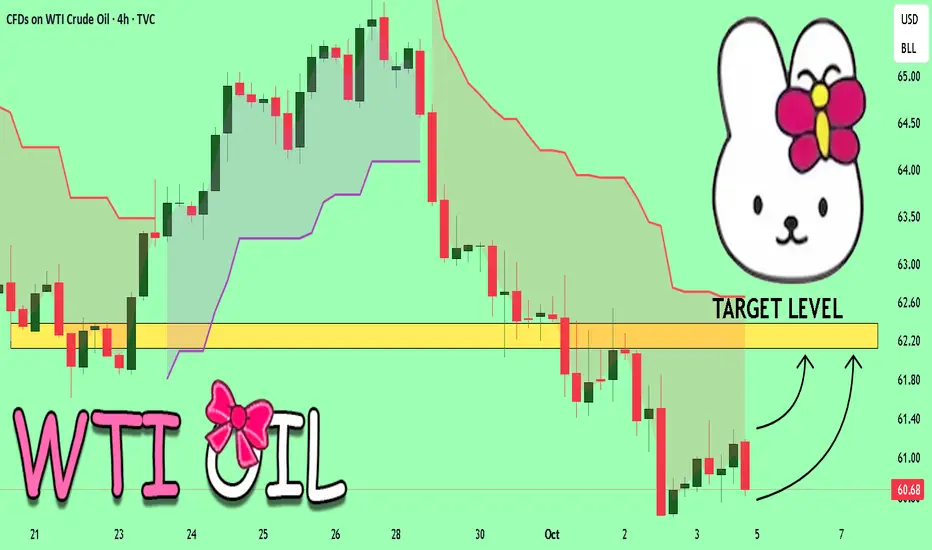
USOIL On The Rise! BUY!
My dear friends,
Please, find my technical outlook for USOIL below:
The instrument tests an important psychological level 60.68
Bias - Bullish
Technical Indicators: Supper Trend gives a precise Bullish
Super-trend indicator is more useful in trending markets where there are clear uptrends and downtrends in price. signal, while Pivot Point HL predicts price changes and potential reversals in the market.
Target - 62.13
About Used Indicators:
Super-trend indicator is more useful in trending markets where there are clear uptrends and downtrends in price.
Disclosure: I am part of Trade Nation's Influencer program and receive a monthly fee for using their TradingView charts in my analysis.
———————————
WISH YOU ALL LUCK
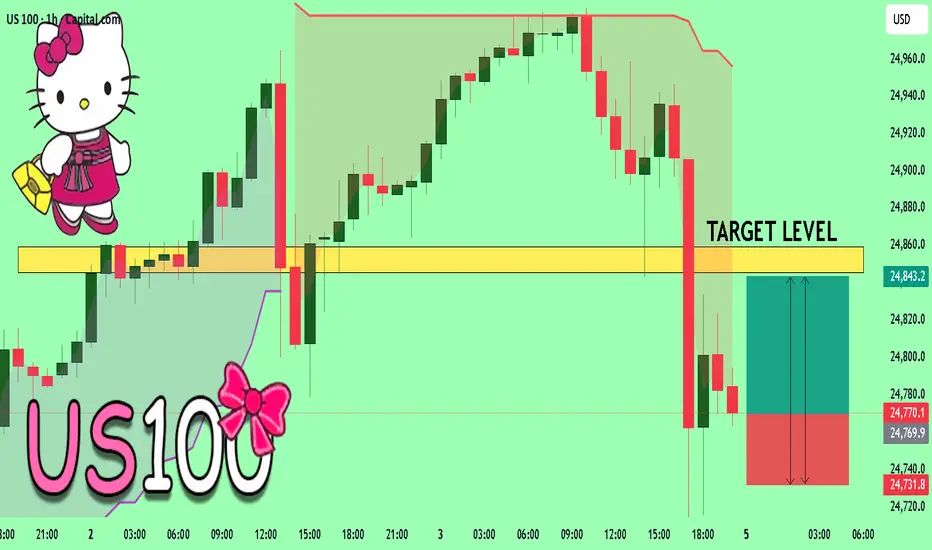
US100 Expected Growth! BUY!
My dear friends,
Please, find my technical outlook for US100 below:
The price is coiling around a solid key level - 24770
Bias -Bullish
Technical Indicators: Pivot Points High anticipates a potential price reversal.
Super trend shows a clear buy, giving a perfect indicators' convergence.
Goal - 24845
Safe Stop Loss - 24731
About Used Indicators:
The pivot point itself is simply the average of the high, low and closing prices from the previous trading day.
Disclosure: I am part of Trade Nation's Influencer program and receive a monthly fee for using their TradingView charts in my analysis.
———————————
WISH YOU ALL LUCK
USDJPY Will Go Up! Long!
Here is our detailed technical review for USDJPY.
Time Frame: 1D
Current Trend: Bullish
Sentiment: Oversold (based on 7-period RSI)
Forecast: Bullish
The market is on a crucial zone of demand 146.741.
The oversold market condition in a combination with key structure gives us a relatively strong bullish signal with goal 149.744 level.
P.S
The term oversold refers to a condition where an asset has traded lower in price and has the potential for a price bounce.
Overbought refers to market scenarios where the instrument is traded considerably higher than its fair value. Overvaluation is caused by market sentiments when there is positive news.
Like and subscribe and comment my ideas if you enjoy them!

USDJPY Will Go Up From Support! Buy!
Take a look at our analysis for USDJPY.
Time Frame: 4h
Current Trend: Bullish
Sentiment: Oversold (based on 7-period RSI)
Forecast: Bullish
The price is testing a key support 147.450.
Current market trend & oversold RSI makes me think that buyers will push the price. I will anticipate a bullish movement at least to 148.568 level.
P.S
We determine oversold/overbought condition with RSI indicator.
When it drops below 30 - the market is considered to be oversold.
When it bounces above 70 - the market is considered to be overbought.
Like and subscribe and comment my ideas if you enjoy them!

#030: Long Investment Opportunity on CHF/JPY
I'm monitoring CHF/JPY for a potential long entry with a Buy Limit at 184,800, with a stop loss at 184,100 and a take profit at 186,200. Hello, I'm Forex Trader Andrea Russo, an independent trader and prop trader with $200,000 in capital under management. Thank you in advance for your time.
The trade is based on technical-behavioral analysis, with particular attention to:
price structure,
sentiment dynamics,
and price behavior in key zones.
🔍 Why 184,800?
This area has acted as a dynamic and technical support zone in the past. After a decline from local highs, the price began to build a base in the 184,300–185,000 range, signaling potential absorption by stronger buyers.
Placing a buy limit at 184,800 allows traders to enter on a potential institutional reaction without chasing the price. If the market retests this area, we could see a reversal pattern and a rebound toward the highs.

EUR/USD BEST PLACE TO BUY FROM|LONG
Hello, Friends!
We are now examining the EUR/USD pair and we can see that the pair is going down locally while also being in a downtrend on the 1W TF. But there is also a powerful signal from the BB lower band being nearby indicating that the pair is oversold so we can go long from the support line below and a target at 1.175 level.
Disclosure: I am part of Trade Nation's Influencer program and receive a monthly fee for using their TradingView charts in my analysis.
✅LIKE AND COMMENT MY IDEAS✅

USDCHF: Growth & Bullish Forecast
It is essential that we apply multitimeframe technical analysis and there is no better example of why that is the case than the current USDCHF chart which, if analyzed properly, clearly points in the upward direction.
Disclosure: I am part of Trade Nation's Influencer program and receive a monthly fee for using their TradingView charts in my analysis.
❤️ Please, support our work with like & comment! ❤️

AUDNZD: Will Keep Growing! Here is Why:
The analysis of the AUDNZD chart clearly shows us that the pair is finally about to go up due to the rising pressure from the buyers.
❤️ Please, support our work with like & comment! ❤️
