GBPCHF Will Move Higher! Buy!
Here is our detailed technical review for GBPCHF.
Time Frame: 12h
Current Trend: Bullish
Sentiment: Oversold (based on 7-period RSI)
Forecast: Bullish
The market is testing a major horizontal structure 1.071.
Taking into consideration the structure & trend analysis, I believe that the market will reach 1.080 level soon.
P.S
Please, note that an oversold/overbought condition can last for a long time, and therefore being oversold/overbought doesn't mean a price rally will come soon, or at all.
Like and subscribe and comment my ideas if you enjoy them!
Long!!!!

EURUSD Pullback Toward 1.17400 as DXY Struggles Below 99Hey Traders, in today's trading session we are monitoring EURUSD for a buying opportunity around the 1.17400 zone. The pair is trading in an uptrend, with price currently correcting toward this key support/resistance level.
Structure: The broader bias remains bullish, but price is pulling back after recent highs.
Key level in focus: 1.17400 — a significant zone where buyers may look to rejoin the trend.
Fundamentals: The U.S. Dollar Index (DXY) remains in a downtrend and is correcting toward the 99.000 resistance area. If DXY fails to break higher, it could reinforce USD weakness and support a bullish continuation in EURUSD.
Trade safe,
Joe.

AUD/CHF BULLS ARE GAINING STRENGTH|LONG
Hello, Friends!
The BB lower band is nearby so AUD-CHF is in the oversold territory. Thus, despite the downtrend on the 1W timeframe I think that we will see a bullish reaction from the support line below and a move up towards the target at around 0.525.
Disclosure: I am part of Trade Nation's Influencer program and receive a monthly fee for using their TradingView charts in my analysis.
✅LIKE AND COMMENT MY IDEAS✅

BTCUSD: Rally Back to 116000 ResistanceHello everyone, here is my breakdown of the current Bitcoin setup.
Market Analysis
The market for Bitcoin has seen a structural shift after breaking down from its prior Upward Channel. This event signaled a loss of bullish momentum and led to a sharp decline down to the major horizontal Support at the 112000 level.
Currently, the price has found significant support in the 111500 - 112000 Support zone and has initiated a bounce. The market is now in a potential reversal phase, but I believe the conviction of the buyers still needs to be confirmed with one final test.
My Scenario & Strategy
My scenario is built on the idea that the 112000 Support is a major area of demand that will ultimately hold. I'm looking for a strong and confirmed bounce from Support zone. This would be the key signal that the corrective low is in place and the market is ready to reverse its course and begin a new rally.
Therefore, the strategy is to watch for this successful retest. It would validate the long scenario, with the price then expected to rally back up to the point of the initial breakdown. The primary target for this move is the 116000 Resistance level, which also aligns with the Resistance Zone.
That's the setup I'm tracking. Thank you for your attention, and always manage your risk.

EIGEN Long TryEIGEN acting like it still wants to 1.98 it recovered very quickly unlike the market.
1.98 is a far target MM maybe left it for the next rally's liqudity I am going to give it a try

FAST / FASTENAL / Long scenario / Fractal & SeasonalityMy view from a seasonality standpoint:
Bullish time ahead until around mid of december. Maybe one little dip lower before the action starts.
my view basted on a fractal analysis:
uncertain about on emore breaking the low but then upside at least to the former high.
*this is not a trade vall nor is it financial advice. think and trade for yourself and on your own discretion and risk

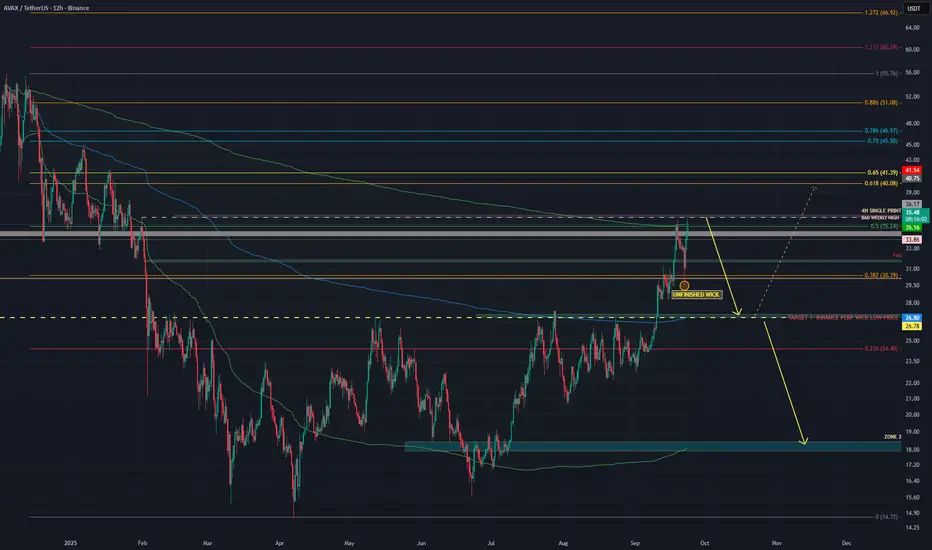
$AVAX – ARBITRAGE DUMP DETECTED – READY TO BALANCE?Traders,
Last time we nailed CRYPTOCAP:AVAX from 22.80 → 30 → 35 almost pixel perfect.
Now the setup may be flipping. Let’s break it down with the THETA method:
🔹 Imbalances
Perps vs Spot: Binance Perps wicked down to $26.83, Spot hasn’t filled it yet → liquidity gap below.
Market Profile: Price swept the 31 Jan weekly high, a “bad high” (too much excess, unstable).
Oscillators: RSI shows bearish divergences on multiple timeframes → momentum fading.
Context: Market is repairing imbalance above to build liquidity, which can later be used to fix the unfinished business below.
🔹 Order Flow & AVWAP
Aggressive buyers stepping in at $34–36 (since CME open).
Price is now trading at the upper band of the HTF AVWAP, a zone that often signals overextension vs volume-weighted positioning.
The unfilled wick imbalance at $26.83 is also the price of the HTF AVWAP itself (blue line) → strong confluence for a revisit.
If downside continues, those aggressive buyers will be trapped, fueling the move lower.
Next key check: At $26.90, we need to watch data + price action to define if AVAX stabilizes there or breaks further.
✅ Conclusion
Price is showing signs of distribution at the HTF AVWAP upper band. Liquidity is being absorbed above, and the confluence of the wick imbalance + HTF AVWAP at $26.83 strengthens the case for a downside move.
👉 Key takeaway: Longs chasing into AVWAP extremes = potentially trapped buyers, with the market likely rotating back to $26.90–26.83 before the next decision point.
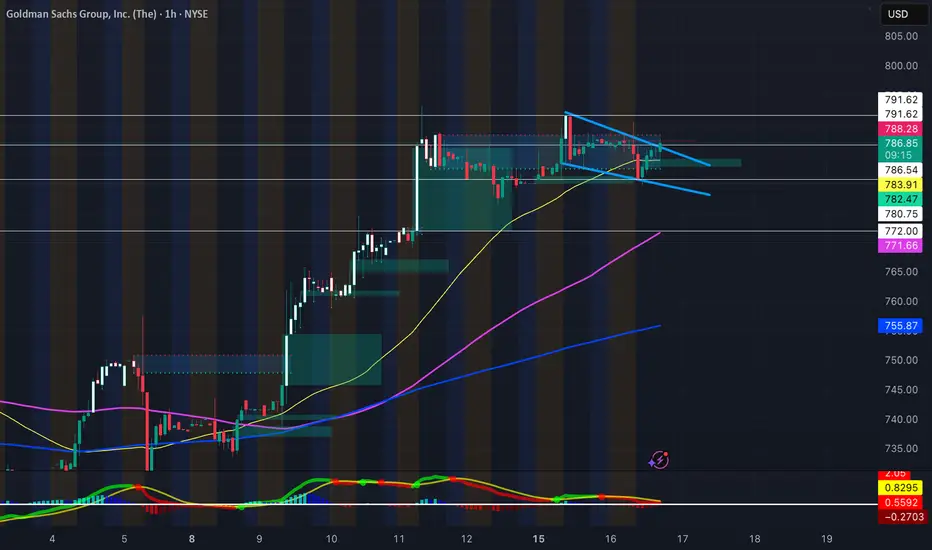
Long GS Falling Wedge FormingFalling wedge forming on NYSE:GS hourly, with NYSE:GS bouncing off its 50-day SMA. It's EMA's are curling upwards, and a bullish FVG formed as support. With pending FOMC conference tomorrow and potential rate cuts, certainly will be watching NYSE:GS
PT1 - 790.40
PT2 - 794.50
PT3 - 798.90
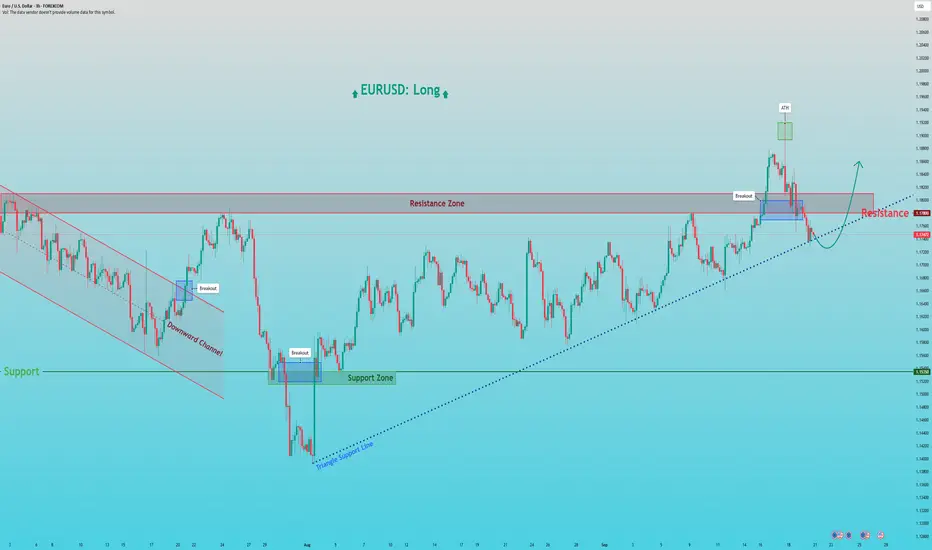
EURUSD: Dip and Bounce from Triangle SupportHello everyone, here is my breakdown of the current Euro setup.
Market Analysis
After reversing from a prior Downward Channel, EURUSD has been consolidating in a large Upward Triangle. This pattern is typically bullish and is defined by a flat horizontal Resistance at the 1.1780 level and an ascending support line, showing that buyers are becoming progressively more aggressive on each dip.
An interesting part of this pattern's history is the 'fake breakout' we saw previously, where the price spiked to a local ATH at 1.1920 before falling back inside. Currently, the price is again in a corrective pullback, heading towards the ascending Triangle Support Line for another test.
My Scenario & Strategy
My scenario is based on the expectation that this Upward Triangle will eventually resolve to the upside. I'm looking for the price to complete its downward movement and find strong support on the ascending Triangle Support Line. A confirmed bounce from this line would be the key signal that buyers are stepping in to defend the trend.
Therefore, the strategy is to watch for this bounce. A successful rebound that finally leads to a decisive breakout above the Resistance Zone would validate the long scenario. The primary target for the subsequent expansion is 1.1860, a logical objective for the move that would follow.
That's the setup I'm tracking. Thank you for your attention, and always manage your risk.
EURAUD Sellers In Panic! BUY!
My dear subscribers,
My technical analysis for EURAUD is below:
The price is coiling around a solid key level - 1.7856
Bias - Bullish
Technical Indicators: Pivot Points Low anticipates a potential price reversal.
Super trend shows a clear buy, giving a perfect indicators' convergence.
Goal - 1.7886
My Stop Loss - 1.7834
About Used Indicators:
By the very nature of the supertrend indicator, it offers firm support and resistance levels for traders to enter and exit trades. Additionally, it also provides signals for setting stop losses
Disclosure: I am part of Trade Nation's Influencer program and receive a monthly fee for using their TradingView charts in my analysis.
———————————
WISH YOU ALL LUCK

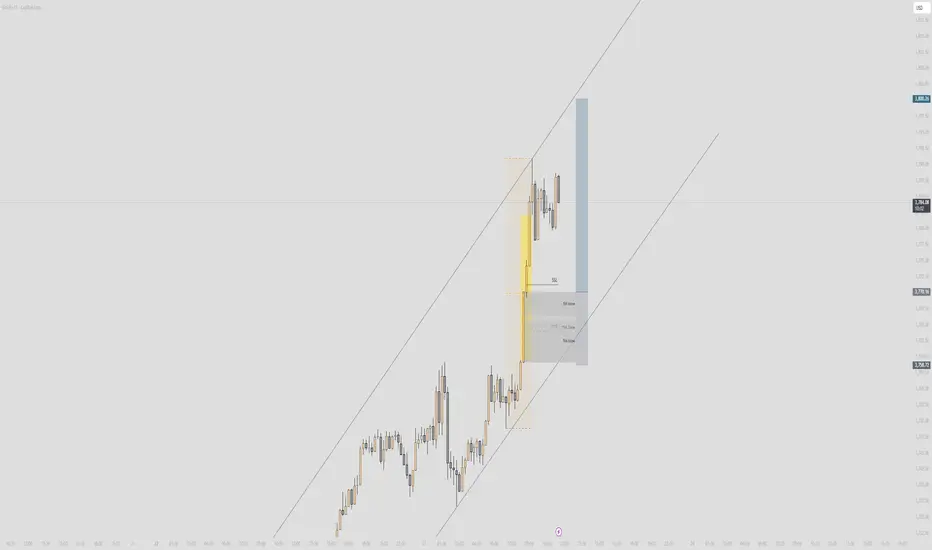
Gold - Quick Move!⚡ GOLD – Quick Forecast ⚡
⏱ 5M View (Lower TF)
Price is riding an ascending channel, respecting both trendlines.
Strong impulsive leg (yellow highlight) → market broke higher with momentum.
Now consolidating just under the upper channel line, cooking for the next move.
🔑 Liquidity & Zones
SSL (sell-side liquidity) marked below — prime magnet if price wants a quick dip.
Confluence reload area: Fib 71% + Imbalance fill + SSL zone around 3770–3765.
If tapped, buyers likely reload here for another rocket.
🎯 Play of the Day
Hold current structure = direct push toward 3805–3810 🚀.
Deeper retrace into SSL/71% zone = better entry for continuation long.
Break below channel low? ❌ Idea cooked, bears reclaim flow.
📝 Forecast Summary
📍 Bias : Bullish (buy dips)
🎯 Target : 3805–3810
🪙 Reload Zone: 3765–3770
❌ Invalidation : Break below channel low
NZDUSD Is Very Bullish! Long!
Please, check our technical outlook for NZDUSD.
Time Frame: 12h
Current Trend: Bullish
Sentiment: Oversold (based on 7-period RSI)
Forecast: Bullish
The market is approaching a significant support area 0.586.
The underlined horizontal cluster clearly indicates a highly probable bullish movement with target 0.596 level.
P.S
We determine oversold/overbought condition with RSI indicator.
When it drops below 30 - the market is considered to be oversold.
When it bounces above 70 - the market is considered to be overbought.
Like and subscribe and comment my ideas if you enjoy them!

NZDUSD: Long Trading Opportunity
NZDUSD
- Classic bullish pattern
- Our team expects retracement
SUGGESTED TRADE:
Swing Trade
Buy NZDUSD
Entry - 0.5858
Stop - 0.5854
Take - 0.5864
Our Risk - 1%
Start protection of your profits from lower levels
Disclosure: I am part of Trade Nation's Influencer program and receive a monthly fee for using their TradingView charts in my analysis.
❤️ Please, support our work with like & comment! ❤️

#027: LONG GBP/USD Investment Opportunity
I have chosen to go LONG on this pair. The recent bearish movement has unloaded much of the excess, and the price is now showing clear signs of accumulation in key areas. Hello, I'm Forex Trader Andrea Russo, an independent trader and prop trader with $200,000 in capital under management. Thank you in advance for your time.
Price action has respected important structural levels, with a clear reaction after testing dynamic support.
Volumes indicate an absorption phase, typical of institutional preparatory moves.
Relative strength is starting to turn in our favor, while retail data shows the majority leaning in the opposite direction: exactly the situation I'm looking for to position myself against the retail market.
The cyclical trend suggests the end of the corrective leg and the start of a new directional momentum.
The plan therefore remains bullish: I follow the institutional flow, with the idea that the next expansionary movement could develop in continuity with the dominant structure.

GOLD only BullishIn my last gold post, I had updated a few psychological levels; today's trade is based on the simple breakout level of those psychological levels.
i have also marked how perfectly these levels are working.
Thank you for following me and showing support, hope you guys are learning from my post.

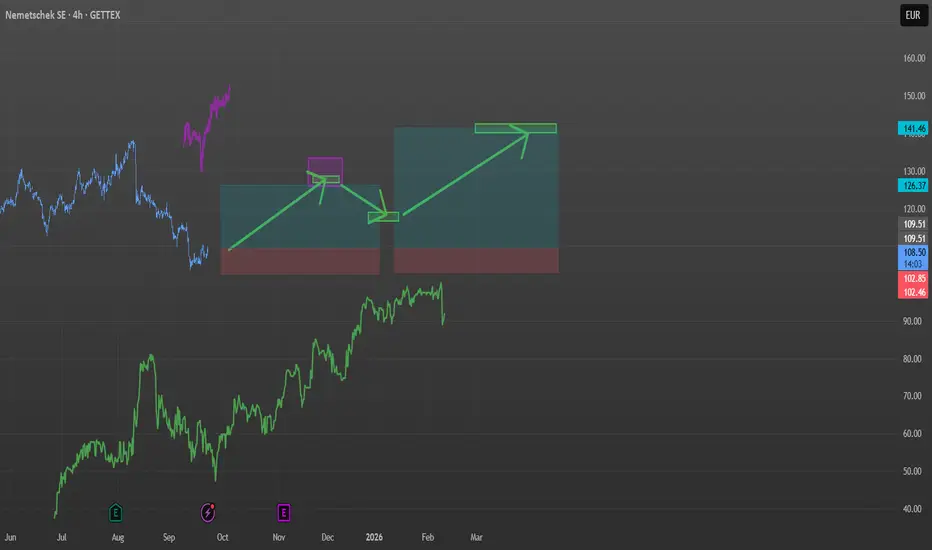
Nemetschek / Fractal and Seasonality / LongHere is my view on that stock:
Until end of november we should see a bullish seasonal move.
There might be some retracements but a drastic extended bearish period I expect to start June 2026 (PE+2).
The target areas are derived from the spotted fractal. Did I pick the right one? Did I alling it right? Let's discuss.
AUDJPY: Long Trade Explained
AUDJPY
- Classic bullish formation
- Our team expects pullback
SUGGESTED TRADE:
Swing Trade
Long AUDJPY
Entry - 97.434
Sl - 97.350
Tp - 97.587
Our Risk - 1%
Start protection of your profits from lower levels
Disclosure: I am part of Trade Nation's Influencer program and receive a monthly fee for using their TradingView charts in my analysis.
❤️ Please, support our work with like & comment! ❤️

BTCUSD - Nothing broken - so farUp where the 0 (zero) is, at the white Centerline, BTC was trying to re-test it, when it came from the white 1/4 line. So a larger Hagopian kicked in, projecting price to go further down than from where it originally came.
Price did what was projected by the Hagopian and cracked the low of 111'920.
Then from Point 1, Bitcoin made it up to the red U-MLH.
It was just natural resistance up there.
Now we see a pullback to the south, which I had not expected last week.
Even if we stop in the buyers zone, chances that BTC is trading down to the Centerline are around 80%.
And down there we will find out if the white L-MLH will hold or not.
If not, then we are in a 0 to 5 count to the south and we will see much lower prices.
But as long as price can stay within the white Fork, we are still projecting it's most probable path to the upside in the long term timeframe.
Happy new week and stay tuned for the news §8-)

BTCUSD Short Setup After Trendline BreakBTCUSD just made a decisive break below the main trendline, a clear signal that bearish momentum is building. Sellers have stepped up, and the tone of the market has shifted — control is now in their hands.
In the short term, I’m watching for a retest of the broken level. What used to be support may now act as resistance. If buyers can’t push price back above that zone, it confirms weakness and opens the door for continuation lower, with 112,000 as the next key target.
Traders should keep an eye on bearish signals like rejection wicks, bearish engulfing candles, or strong sell volume. A clean reclaim above resistance would invalidate the bearish bias, but until then, sellers remain in control. Let’s see how this unfolds.

EURUSD Long: Rally Continues in Ascending ChannelHello, traders! The prior price auction for EURUSD was dominated by a wide consolidation range, bounded by the demand zone 2. Within this range, a new bullish structure began to form as an ascending channel, which eventually gathered enough momentum to break out and confirm a new uptrend, shifting market control to the buyers.
Currently, the price action continues to be guided by this ascending channel. Following a recent test of the upper price levels, the market has entered a corrective phase. The auction is now pulling back towards a significant confluence of support, located near the 1.1740 DEMAND level, which also aligns with the channel's dynamic support line.
My scenario for the development of events is a continuation of the uptrend after this correction completes. I expect the price to find strong support at the confluence of the channel's demand line and the 1.1740 - 1.1760 DEMAND ZONE. In my opinion, a confirmed bounce from this area will signal the end of the pullback and trigger the next impulsive move higher. The take-profit is therefore set at 1.1865, an intermediate target within the channel's structure. Manage your risk!

AUDUSD: Bulls Will Push Higher
It is essential that we apply multitimeframe technical analysis and there is no better example of why that is the case than the current AUDUSD chart which, if analyzed properly, clearly points in the upward direction.
Disclosure: I am part of Trade Nation's Influencer program and receive a monthly fee for using their TradingView charts in my analysis.
❤️ Please, support our work with like & comment! ❤️

GBPUSD Massive Long! BUY!
My dear subscribers,
GBPUSD looks like it will make a good move, and here are the details:
The market is trading on 1.3500 pivot level.
Bias - Bullish
Technical Indicators: Both Super Trend & Pivot HL indicate a highly probable Bullish continuation.
Target - 1.3561
About Used Indicators:
The average true range (ATR) plays an important role in 'Supertrend' as the indicator uses ATR to calculate its value. The ATR indicator signals the degree of price volatility.
Disclosure: I am part of Trade Nation's Influencer program and receive a monthly fee for using their TradingView charts in my analysis.
———————————
WISH YOU ALL LUCK

EURJPY Massive Long! BUY!
My dear subscribers,
My technical analysis for EURJPY is below:
The price is coiling around a solid key level - 173.67
Bias - Bullish
Technical Indicators: Pivot Points Low anticipates a potential price reversal.
Super trend shows a clear buy, giving a perfect indicators' convergence.
Goal - 174.03
My Stop Loss - 173.52
About Used Indicators:
By the very nature of the supertrend indicator, it offers firm support and resistance levels for traders to enter and exit trades. Additionally, it also provides signals for setting stop losses
Disclosure: I am part of Trade Nation's Influencer program and receive a monthly fee for using their TradingView charts in my analysis.
———————————
WISH YOU ALL LUCK
