EURUSD Long: Correction Before Impulse UpHello, traders! A large upward wedge pattern has defined the price auction for EURUSD. This bullish structure has been formed by a series of higher highs and higher lows, with key pivot points establishing the diverging supply and demand lines. The auction has been rotating between the demand zone 2 and the supply zone near the 1.1780 level.
Currently, following a rejection from the wedge's upper supply line, the price has entered a corrective phase. This pullback is guiding the auction towards a significant confluence of support. The price is now approaching the ascending demand line, a key area where buyers have previously shown initiative and are expected to defend the trend.
The primary scenario anticipates a successful defense of this ascending demand line. A confirmed bounce from this dynamic support would validate the integrity of the upward wedge and signal that the bullish initiative is ready to resume. This is expected to trigger a full rotation back to the top of the pattern, breaking through the 1.1780 demand level. The take-profit is therefore set at 1.1810, targeting the upper supply line of the wedge. Manage your risk!
Long!!!!

EURUSD Expected Growth! BUY!
My dear friends,
Please, find my technical outlook for EURUSD below:
The price is coiling around a solid key level - 1.1807
Bias - Bullish
Technical Indicators: Pivot Points Low anticipates a potential price reversal.
Super trend shows a clear buy, giving a perfect indicators' convergence.
Goal - 1.1826
Safe Stop Loss - 1.1797
About Used Indicators:
The pivot point itself is simply the average of the high, low and closing prices from the previous trading day.
Disclosure: I am part of Trade Nation's Influencer program and receive a monthly fee for using their TradingView charts in my analysis.
———————————
WISH YOU ALL LUCK

BTC: Fed Fuel Ignites the Next Leg UpBTC's coiling like a spring between $116.5k support and $118.5k resistance, with smart money reloading post-rate cut while retail chases shadows. The Fed's 25bps trim is the cheat code here—liquidity's flowing, on-chain whales are backing the truck, and technicals scream bounce to $119k as DXY dips.
Entry zone: $117k-$117.5k for that low-risk long. TP1 at $118.5k (quick scalp), TP2 $119.5k if momentum sticks. SL tight at $116.5k to avoid the flush.
This setup's classic: Crowd's neutral-greedy, but we're thinking like institutions—patience shakes out the weak hands before the real move. Don't FOMO the chop; scoop the dip.

AUDUSD Is Very Bullish! Long!
Please, check our technical outlook for AUDUSD.
Time Frame: 12h
Current Trend: Bullish
Sentiment: Oversold (based on 7-period RSI)
Forecast: Bullish
The market is approaching a significant support area 0.662.
The underlined horizontal cluster clearly indicates a highly probable bullish movement with target 0.668 level.
P.S
Please, note that an oversold/overbought condition can last for a long time, and therefore being oversold/overbought doesn't mean a price rally will come soon, or at all.
Like and subscribe and comment my ideas if you enjoy them!

NZDUSD Is Going Up! Buy!
Here is our detailed technical review for NZDUSD.
Time Frame: 9h
Current Trend: Bullish
Sentiment: Oversold (based on 7-period RSI)
Forecast: Bullish
The market is on a crucial zone of demand 0.589.
The oversold market condition in a combination with key structure gives us a relatively strong bullish signal with goal 0.594 level.
P.S
The term oversold refers to a condition where an asset has traded lower in price and has the potential for a price bounce.
Overbought refers to market scenarios where the instrument is traded considerably higher than its fair value. Overvaluation is caused by market sentiments when there is positive news.
Like and subscribe and comment my ideas if you enjoy them!

NZD/USD - Forecast Update 🕰 Weekly Structure
Price has been holding above 0.58 strong support.
Currently ranging between 0.58 – 0.62.
A break above 0.60 – 0.605 could open the door for a run into 0.62 supply.
Failure here and a drop below 0.58 would confirm deeper downside.
📉 Daily View
Price is testing 0.5950 key zone.
Strong liquidity sits above 0.60, while demand has been respected around 0.585 – 0.59.
Daily structure favors a push higher toward 0.61 – 0.62, unless sellers reclaim 0.585.
⏱ 8H Structure
Bounce seen from major buyer level at 0.59.
Short-term target is 0.60 – 0.605 resistance.
If that zone breaks, upside continuation into 0.617 – 0.62 is next.
📌 Outlook
Short-term bullish bounce → Watching 0.60 – 0.605 for reaction.
Break higher → rally toward 0.62.
Rejection here → possible retrace back into 0.585 – 0.59 support.
Bias : Short-term bullish 🔼 → Mid-term depends on 0.60/0.605 breakout.

USD/CHF - Forecast (Update)🕰 Weekly Structure
Price is sitting just above 0.78 – 0.79 support zone.
The broader weekly trend is still bearish, but we’re showing signs of forming a wedge base.
If 0.78 holds, a bounce toward 0.84 resistance is likely.
📉 Daily View
Clear rejection from 0.79 demand zone.
Market structure suggests a potential short-term bullish correction.
First upside target is 0.805 – 0.81, with room toward 0.84 supply if momentum continues.
⏱ 4H / 8H Structure
Price recently swept liquidity below 0.79 and bounced.
Expecting a push higher into 0.80 – 0.805 resistance.
Break above 0.805 could fuel continuation toward 0.82+.
📌 Outlook
Short-term bullish bounce → watching for a rally into 0.80 – 0.81.
Mid-term path depends on reaction at 0.84 supply.
Bias : Short-term bullish 🔼 → Mid-term depends on 0.84 test.

USD/CAD - Forecast🚨 USD/CAD – Key Levels in Play 🚨
🕰 Weekly View:
Price is trapped inside a 1.36 – 1.40 swing range.
Break above 1.40 → clean run into 1.44 – 1.46 supply.
Fail here → liquidity below 1.34 – 1.35 becomes the target.
📉 Daily Structure:
We’re moving inside a parallel channel, sitting mid-range at 1.38 – 1.39. Liquidity is building under 1.37 — sellers might want to grab that first.
⏱ 8H Play:
Rejection spotted at 1.38 – 1.385 supply.
➡️ Short-term pullback toward 1.37 demand looks likely.
➡️ If buyers defend that, we could see another push into 1.39 – 1.40.
📌 Outlook:
Short-term pullback 🔽 → Mid-term bullish if 1.37 holds.
Break under 1.37? Bears take control toward 1.35.
Follow for more

Silver Gonna Jump Hereuptrend to continue on silver after rejections from support level.
scaling in entries on LTFs.

Gold - Everything is Possible, as Always🚀 FX_IDC:XAUUSD Gold's Wild Ride: What's Brewing After the $3674 High? 🤯
Hey Goldbugs! 🤩 Our shiny friend, XAUUSD, has been on an absolute tear lately. Market makers did their magic, nudging Gold to a comfy spot around $3640, just shy of its ALL-TIME HIGH of $3674! 🚀 But now... crickets. What's next for our "always up" precious metal? Let's decode this mystery in a flash! 👇
The Lowdown: Why Gold's Taking a Breather 😴
1. The "Less Bad" News Effect:
Recent U.S. data has been... well, "less bad". Inflation/deflation drama is cooling off, and markets are starting to think things aren't as grim as they were. This makes some traders less keen on Gold, but don't forget the big players (institutions!) still need their fix. So, a tug-of-war begins! ⚔️
2. Overheated Engine Syndrome! 🌡️
Gold's run from $3321 to $3674 was a whopping +10.5% ($353!) at an almost 45-degree angle! That's impressive, but even the best engines need to cool down. Our daily RSI values have been chilling above 75% – that's "overheated" territory! 🔥 A correction is basically Gold taking a well-deserved nap.
The "C" Word: What Correction Looks Like 📉
Forget complicated math! A correction is usually a 10-20% price dip. Given Gold's recent sprint, we could be looking at a 20-30% pullback from that $353 gain, meaning a possible $70-$105 drop. 📉
Target Zones?
Many eyes are on $3580. But hey, Gold likes surprises! It could go lower, perhaps even test $3550 or more!
Your Trader's Toolkit:
Don't Get Caught Napping! 🛠️
Want to predict Gold's next move? Here's your cheat sheet:
Candlestick Clues: Watch for Shooting Stars 🌠, Hanging Men 🕯️, Spinning Tops, and Dojis. These are like little whispers telling you the trend might be tired.
EMA Lines: These are your trend compasses!
Fibonacci, Baby! 💫 Seriously, if you haven't, dive into Fibonacci Channels and Circles. They're like a crystal ball for price moves!
Economic Calendar: 🗓️ CPI, PPI, NFP, and U.S. Inflation Data are Gold's daily bread and butter. Know them!
🧠 ICT Insights: What the Pros Are Seeing 📊
Market Structure Shift (MSS): After hitting $3674, Gold's current wiggles (Lower Highs & Lower Lows) within this consolidation hint at a short-term shift in order flow. It's not a full reversal, but a pause for thought. If you look closely, you can see a Bull Flag Pole exists and the Flag is forming, currently a triangle, a good sign before the liquidity needs to get taken out from the bottom.
Liquidity Magnets:
Buy-Side Liquidity (BSL): Loads of orders (and stop losses!) waiting above $3674. That's a juicy target if Gold decides to moon again!
Sell-Side Liquidity (SSL): Plenty below the recent low around $3590-$3600. A dip here could be a "stop hunt" before bouncing.
Fair Value Gaps (FVG) & Order Blocks (OB): Those rapid green candles left "gaps" and "blocks" during the ascent. Gold loves to retrace and "fill" these gaps or retest these blocks ($3590-$3600 is a key OB zone!) before its next big move.
The Verdict? Gold's Not Done Yet! ✨
Is Gold heading for $3700+? YES! But probably not right now. A little cooldown, a bit of retracement to those key support levels and ICT zones, seems inevitable.
So, what to do? Be patient, be responsible with your capital, and keep your eyes peeled for those technical clues. Gold's next big move could be around the corner!
Next Week's Radar (ignoring the news for a sec):
Bullish Target: $3800 🚀
Bearish Target: $3550 🐻
Significant large orders are on
Sell Stop: 3611
Sell Limit_ 3657, 3659
Buy Limit: 3600, 3580, 3500
Buy Stop: 4497
-------------------------------------------------------------------------
This is just my personal market idea and not financial advice! 📢 Trading gold and other financial instruments carries risks – only invest what you can afford to lose. Always do your own analysis, use solid risk management, and trade responsibly.
Good luck and safe trading! 🚀📊

EURCHF: Bulls Will Push Higher
The charts are full of distraction, disturbance and are a graveyard of fear and greed which shall not cloud our judgement on the current state of affairs in the EURCHF pair price action which suggests a high likelihood of a coming move up.
Disclosure: I am part of Trade Nation's Influencer program and receive a monthly fee for using their TradingView charts in my analysis.
❤️ Please, support our work with like & comment! ❤️

AUDUSD Trading Opportunity! BUY!
My dear friends,
My technical analysis for AUDUSD is below:
The market is trading on 0.6663 pivot level.
Bias - Bullish
Technical Indicators: Both Super Trend & Pivot HL indicate a highly probable Bullish continuation.
Target - 0.6672
Recommended Stop Loss - 0.6658
About Used Indicators:
A pivot point is a technical analysis indicator, or calculations, used to determine the overall trend of the market over different time frames.
Disclosure: I am part of Trade Nation's Influencer program and receive a monthly fee for using their TradingView charts in my analysis.
———————————
WISH YOU ALL LUCK

NZDUSD: Long Signal with Entry/SL/TP
NZDUSD
- Classic bullish setup
- Our team expects bullish continuation
SUGGESTED TRADE:
Swing Trade
Long NZDUSD
Entry Point - 0.5969
Stop Loss - 0.5965
Take Profit - 0.5979
Our Risk - 1%
Start protection of your profits from lower levels
Disclosure: I am part of Trade Nation's Influencer program and receive a monthly fee for using their TradingView charts in my analysis.
❤️ Please, support our work with like & comment! ❤️

Zinc & Copper Correlation is very healthyZinc and copper markets are closely related because both metals are used heavily in construction, manufacturing, and electrical applications, so demand often rises and falls together with industrial activity.
They’re also frequently mined from the same deposits, meaning supply-side disruptions can affect both. As a result, prices for zinc and copper tend to show a high degree of correlation, moving in similar cycles tied to global economic growth and infrastructure.
Comparing the Charts (Zinc on the left on a Monhtly TF), we see that Zinc has a lot of room left to the upside. Because it's goal is to go back to balance, which is the Centerline.
And because of the close correlation, I think the Chart of Copper HG1! is still OK.
So, in Copper, the Centerline target is still in play.

Gold will correct to support area and then continue to growHello traders, I want share with you my opinion about Gold. The market context for Gold has been firmly bullish, with the price action being guided by a well-established upward channel that has defined the trend for a significant period. The structure of this channel has been confirmed by multiple rotations between its support and resistance lines, originating from the deep 3370 - 3390 buyer zone. Currently, after a rejection from the channel's highs, the price of XAU is undergoing a healthy corrective phase. This pull-back has brought the asset into a critical confluence of support, defined by the 3635 - 3615 support zone and the ascending support line of the channel itself. The primary working hypothesis is a long, trend-continuation scenario, which anticipates that buyers will step in to defend this key support cluster. A confirmed bounce from this area would signal the conclusion of the corrective move and the resumption of the dominant upward trend. This would likely initiate the next impulsive wave higher within the channel's structure. Therefore, the TP is logically placed at 3740 points, representing a new potential structural high and a measured objective for the next impulsive wave. Please share this idea with your friends and click Boost 🚀

GOLD What Next? BUY!
My dear subscribers,
GOLD looks like it will make a good move, and here are the details:
The market is trading on 3674.9 pivot level.
Bias - Bullish
My Stop Loss - 3669.3
Technical Indicators: Both Super Trend & Pivot HL indicate a highly probable Bullish continuation.
Target - 3685.6
About Used Indicators:
The average true range (ATR) plays an important role in 'Supertrend' as the indicator uses ATR to calculate its value. The ATR indicator signals the degree of price volatility.
Disclosure: I am part of Trade Nation's Influencer program and receive a monthly fee for using their TradingView charts in my analysis.
———————————
WISH YOU ALL LUCK

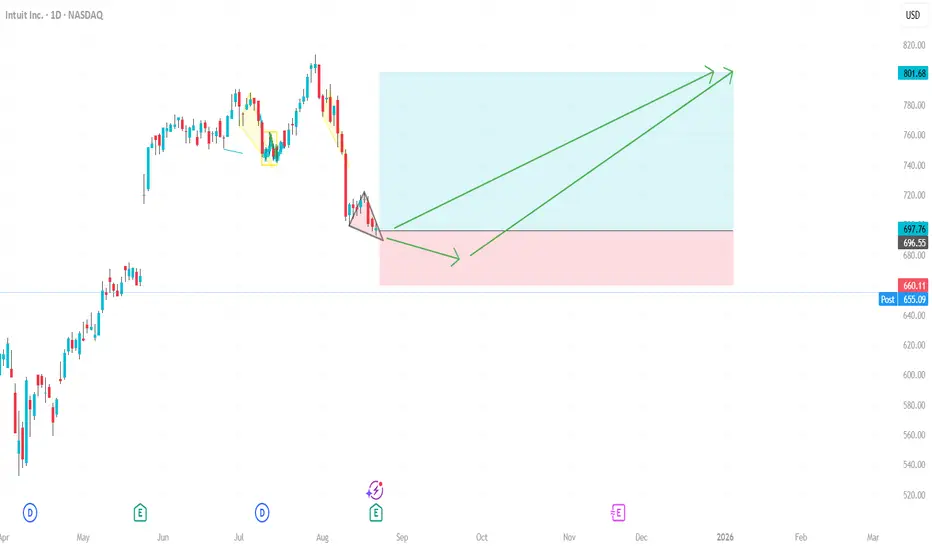
A dive into INTU (Intuit Inc.) seasonality and fractal analysisinto <> intu .... haha. me funny dude...
Here you can see my prjection for the price upmove.
It is based on seasonality which should give us some positive boost with high propability for the rest of the year.
In addition I how to have identified 2 fractals correctly which support the idea of an upmove from at least 15%.
Upmove going to start now or after closing the gap (see chart)
Feel free to contact me, to like/support the idea or discuss in the comments.
Cheers!
*this is not a trade call and no financial advice in any way. just for educational purpose...
CRM / SALESFORCE / Fractal inspired trade LONGFrom my nooby fractal understanding we have made a low and should head to some 13% gain.
From my seasonality understanding we are expecting some same upmove until the end of the year.
There was an insider buy (spotted via openinsider website) which gives more support to the general bullish feeling.
Risk to reward for the trade is not bad a all considering the confluence for a bullihs view.
CRM is in general a stock to have on watchlist or in a longerterm portfolio, so the stopploss could even be bigger or ignored, depneding on your investment horizon.
(this is not financial advice, trade at your own risk of course....)

GBP/CHF BULLS ARE STRONG HERE|LONG
Hello, Friends!
GBP/CHF pair is in the uptrend because previous week’s candle is green, while the price is evidently falling on the 3H timeframe. And after the retest of the support line below I believe we will see a move up towards the target above at 1.077 because the pair is oversold due to its proximity to the lower BB band and a bullish correction is likely.
Disclosure: I am part of Trade Nation's Influencer program and receive a monthly fee for using their TradingView charts in my analysis.
✅LIKE AND COMMENT MY IDEAS✅

EUR/CHF LONG FROM SUPPORT
Hello, Friends!
EUR/CHF pair is trading in a local downtrend which we know by looking at the previous 1W candle which is red. On the 3H timeframe the pair is going down too. The pair is oversold because the price is close to the lower band of the BB indicator. So we are looking to buy the pair with the lower BB line acting as support. The next target is 0.935 area.
Disclosure: I am part of Trade Nation's Influencer program and receive a monthly fee for using their TradingView charts in my analysis.
✅LIKE AND COMMENT MY IDEAS✅

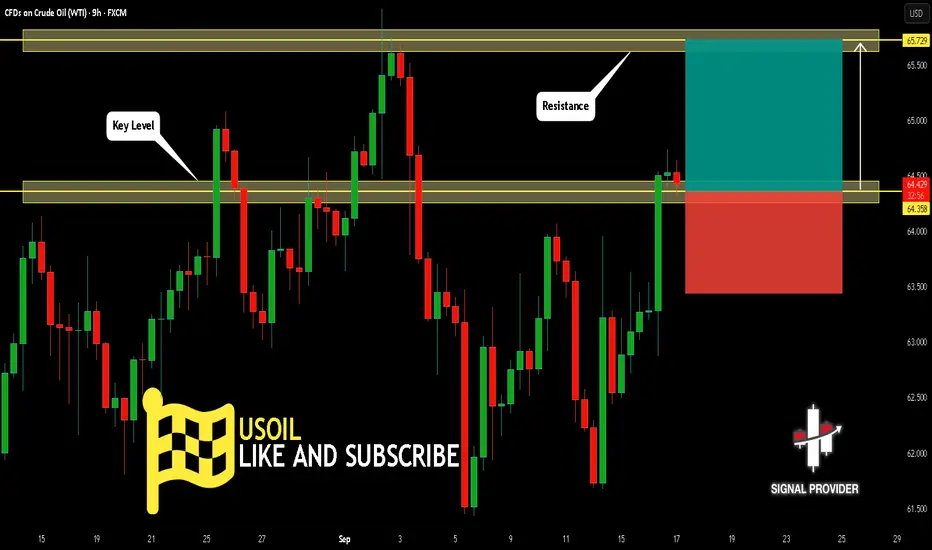
USOIL Will Grow! Long!
Take a look at our analysis for USOIL.
Time Frame: 9h
Current Trend: Bullish
Sentiment: Oversold (based on 7-period RSI)
Forecast: Bullish
The price is testing a key support 64.358.
Current market trend & oversold RSI makes me think that buyers will push the price. I will anticipate a bullish movement at least to 65.729 level.
P.S
We determine oversold/overbought condition with RSI indicator.
When it drops below 30 - the market is considered to be oversold.
When it bounces above 70 - the market is considered to be overbought.
Like and subscribe and comment my ideas if you enjoy them!
GBPCHF Will Go Up! Buy!
Take a look at our analysis for GBPCHF.
Time Frame: 3h
Current Trend: Bullish
Sentiment: Oversold (based on 7-period RSI)
Forecast: Bullish
The market is approaching a key horizontal level 1.073.
Considering the today's price action, probabilities will be high to see a movement to 1.077.
P.S
The term oversold refers to a condition where an asset has traded lower in price and has the potential for a price bounce.
Overbought refers to market scenarios where the instrument is traded considerably higher than its fair value. Overvaluation is caused by market sentiments when there is positive news.
Like and subscribe and comment my ideas if you enjoy them!

USDCHF My Opinion! BUY!
My dear subscribers,
My technical analysis for USDCHF is below:
The price is coiling around a solid key level - 0.7863
Bias - Bullish
Technical Indicators: Pivot Points Low anticipates a potential price reversal.
Super trend shows a clear buy, giving a perfect indicators' convergence.
Goal - 0.7911
About Used Indicators:
By the very nature of the supertrend indicator, it offers firm support and resistance levels for traders to enter and exit trades. Additionally, it also provides signals for setting stop losses
Disclosure: I am part of Trade Nation's Influencer program and receive a monthly fee for using their TradingView charts in my analysis.
———————————
WISH YOU ALL LUCK
