GOLD Trading Opportunity! BUY!
My dear followers,
I analysed this chart on GOLD and concluded the following:
The market is trading on 4062.9 pivot level.
Bias - Bullish
Technical Indicators: Both Super Trend & Pivot HL indicate a highly probable Bullish continuation.
Target - 4083.0
Safe Stop Loss - 4050.2
About Used Indicators:
A super-trend indicator is plotted on either above or below the closing price to signal a buy or sell. The indicator changes color, based on whether or not you should be buying. If the super-trend indicator moves below the closing price, the indicator turns green, and it signals an entry point or points to buy.
Disclosure: I am part of Trade Nation's Influencer program and receive a monthly fee for using their TradingView charts in my analysis.
———————————
WISH YOU ALL LUCK
Long!!!!

BITCOIN Is Bullish! Long!
Here is our detailed technical review for BITCOIN.
Time Frame: 9h
Current Trend: Bullish
Sentiment: Oversold (based on 7-period RSI)
Forecast: Bullish
The market is on a crucial zone of demand 91,866.60.
The oversold market condition in a combination with key structure gives us a relatively strong bullish signal with goal 98,030.74 level.
P.S
The term oversold refers to a condition where an asset has traded lower in price and has the potential for a price bounce.
Overbought refers to market scenarios where the instrument is traded considerably higher than its fair value. Overvaluation is caused by market sentiments when there is positive news.
Like and subscribe and comment my ideas if you enjoy them!

GBPUSD Is Very Bullish! Buy!
Take a look at our analysis for GBPUSD.
Time Frame: 6h
Current Trend: Bullish
Sentiment: Oversold (based on 7-period RSI)
Forecast: Bullish
The price is testing a key support 1.306.
Current market trend & oversold RSI makes me think that buyers will push the price. I will anticipate a bullish movement at least to 1.314 level.
P.S
We determine oversold/overbought condition with RSI indicator.
When it drops below 30 - the market is considered to be oversold.
When it bounces above 70 - the market is considered to be overbought.
Like and subscribe and comment my ideas if you enjoy them!

GBPJPY Will Grow! Long!
Please, check our technical outlook for GBPJPY.
Time Frame: 1h
Current Trend: Bullish
Sentiment: Oversold (based on 7-period RSI)
Forecast: Bullish
The market is approaching a significant support area 203.989.
The underlined horizontal cluster clearly indicates a highly probable bullish movement with target 204.805 level.
P.S
Please, note that an oversold/overbought condition can last for a long time, and therefore being oversold/overbought doesn't mean a price rally will come soon, or at all.
Like and subscribe and comment my ideas if you enjoy them!

GBP/USD LONG FROM SUPPORT
Hello, Friends!
GBP/USD pair is trading in a local uptrend which know by looking at the previous 1W candle which is green. On the 9H timeframe the pair is going down. The pair is oversold because the price is close to the lower band of the BB indicator. So we are looking to buy the pair with the lower BB line acting as support. The next target is 1.319 area.
Disclosure: I am part of Trade Nation's Influencer program and receive a monthly fee for using their TradingView charts in my analysis.
✅LIKE AND COMMENT MY IDEAS✅

GOLD BULLISH BIAS RIGHT NOW| LONG
GOLD SIGNAL
Trade Direction: long
Entry Level: 4,023.35
Target Level: 4,101.64
Stop Loss: 3,971.15
RISK PROFILE
Risk level: medium
Suggested risk: 1%
Timeframe: 6h
Disclosure: I am part of Trade Nation's Influencer program and receive a monthly fee for using their TradingView charts in my analysis.
✅LIKE AND COMMENT MY IDEAS✅

Gold Analysis - Channel Decline Toward Key Support LevelsGold is currently trading inside a descending channel, showing sustained short-term bearish momentum. Price continues to respect both the upper and lower channel boundaries, forming lower highs and lower lows.
We have three key support zones highlighted below current price:
• Support Level 1: Minor liquidity zone where a short-term reaction is possible
• Support Level 2: Stronger demand area, likely to generate a corrective bounce
• Support Level 3: Major support and potential reversal zone at the channel bottom
The projected path shows price potentially continuing lower within the channel toward the deeper support levels before forming a bullish reversal. If price reacts at the lower boundary of the channel + major support, a breakout to the upside could target the 4,100+ area, aligning with the marked TARGET zone.
Key Points:
• Trend on 15m remains bearish until a channel breakout
• EMA 9 and EMA 50 show downward pressure
• Watching for bullish structure shift near lower support zone
• Break and retest above the channel could confirm trend reversal
Bias: Bearish short-term → Bullish reversal potential at deeper support.

USDZAR SWING LONGStrong MACD Divergence is building.
I plan to dollar-cost-average my buys as the price declines.
Long term target is above 20 🚀
Will start reducing position and taking semi profits @ 18 @18.3 and @ 19, after that I will let my remaining buy orders run.
Keep an eye on fundamentals and market behavior 👀
This trade idea will take a long time ⌚
Patience is key 🧘♀️
DISCLAIMER❗
My strategy is considered risky; I will continue to average into my position no matter how low the price goes.
Follow your own plan and emphasis on Money Management 💸

BTC Long if this happenBTC breaked trendline and every buyer is here to trade
if smart money want to Buy btc this trades should SL
then whales will enter

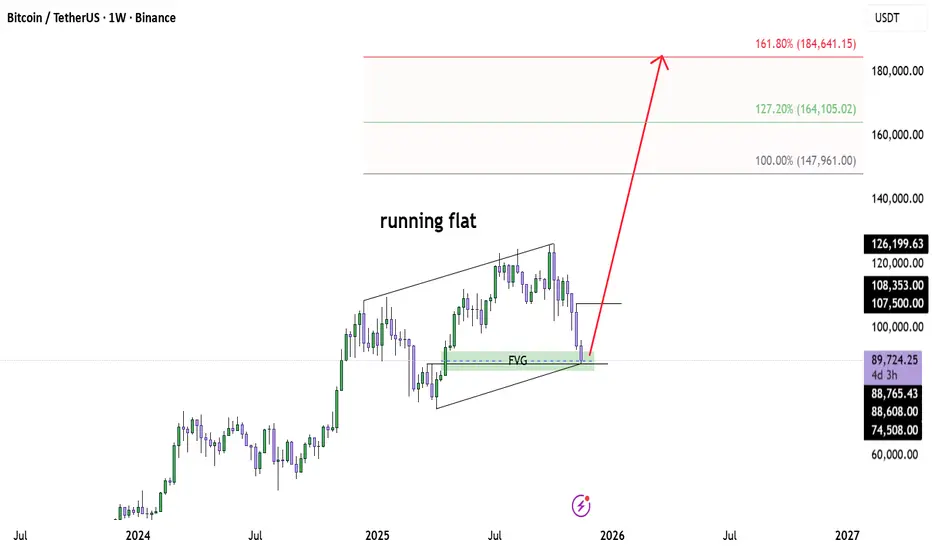
Bitcoin Macro Support Hit — Bull Cycle Ready to ExtendBINANCE:BTCUSD BINANCE:BTCUSDT
Bitcoin just tapped the weekly FVG + channel support, completing what looks like a running flat correction.
This zone has acted as a major demand area, and price reacted exactly where a higher-timeframe Wave 2 should finalise.
As long as BTC holds above this green support block, the bullish macro structure stays intact.
Upside targets for the next impulsive leg are:
147,961 (1.0 extension)
164,105 (1.27 extension)
184,641 (1.618 extension)
If this running flat is confirmed, Bitcoin may be entering a large Wave 3 — historically the most explosive phase.
Still watching weekly close for validation, but momentum is shifting.
⚠️ Disclaimer
This analysis reflects my personal view based on market structure and Elliott Wave principles.
It is not financial advice.
Always do your own research and manage your risk — the market doesn’t forgive careless entries.
BITCOIN – THE TIDES ARE TURNING Traders,
On November 5 I mapped out a scenario where Bitcoin would push into 107k to 108k and then decline to 98k first and 89k second.
This entire scenario has now played out perfectly to the pixel. We swept 108k, we dumped to 98k, and then we flushed into 89k. Where I expected price to retrace from exactly this level: $88.912
So the real question now is simple. What now? Do we break lower, or do we go up?
Let’s break Bitcoin down cleanly, without bias, and only by reading structure, levels, and order flow.
Levels, Structure and Order Flow
AVWAP at the core of the structure
Bitcoin is currently trading right near the AVWAP from the 06 August 24 anchor. This is the blue line on your chart and the exact level is 90.881. This anchor began with a large volume impulse.
When heavy volume kicks off a leg, the AVWAP from that point becomes a core reference level for the entire future auction. We are now sitting right on top of it, which is exactly where you would expect absorption or a strong reaction.
The market is basically deciding if this AVWAP will hold or break.
AB=CD completion
The full AB=CD measured move has completed exactly into the AVWAP zone. This is a clean harmonic completion and adds confluence to why price reacted here. AB=CD means the downside leg is symmetrical and usually marks exhaustion inside a trend.
Fixed Range Volume Profile
Using a FRVP from the start of the current HTF auction (07 April until now), we see price wicked directly into the LVN that sits inside the weekly FVG. This area had imbalance and low participation. A wick into an LVN inside an FVG often means that the inefficiency is now cleaned and the auction has reached completion for that side of the range.
Wedge breakout
Bitcoin technically broke out of the falling wedge, but the breakout does not look clean.
We are outside the wedge, but momentum on the breakout is weak. True confirmation would come if price re-enters the wedge from the outside and climbs back through the wedge body.
Re-entering the wedge tells you that the breakdown was liquidity and not a structural continuation. If we reclaim it, upside targets become more likely.
Order Flow – What the data shows
Spot and Futures CVD
Across the 15m, 30m and 1h charts, Spot CVD is forming a bullish divergence. Price keeps making lower lows, but Spot CVD is holding higher. This shows that spot buyers are stepping in at the lows and absorbing sell pressure.
Futures CVD on both stablecoin margined and coin margined contracts continues to push lower.
Price is not following these lower lows. This creates hidden bullish divergence and confirms that aggressive sellers are hitting the market while limit buyers are absorbing the pressure.
This is a classic sign of absorption. Selling continues, but the market is refusing to break lower with the same intensity.
Open Interest – A shift
Earlier in the dump, Open Interest was falling. This means positions were being closed.
Most of this was shorts taking profit or exiting the move. When OI drops during a downtrend, continuation becomes harder because the move loses fuel.
Near the end of the screenshots, there is a shift. Both stablecoin margined and coin margined OI start to rise again.
This rise in OI happens while:
CVD continues to make lower lows
Price stops making new lows
Price begins to stabilize
This tells us that new positions are being opened at the lows. Given the CVD behavior, most of these are new shorts entering the market.
When new shorts enter and price does not break, the probability of those shorts becoming trapped increases. If buyers step in, this setup often leads to a short squeeze.
This is how reversals form in a controlled market.
Funding rate – Binance
Funding is positive but very small. This means there is no extreme long pressure. There is no overcrowding on the long side. The market is not stretched. With fresh shorts entering at the lows and funding staying neutral, the market can turn quickly if support holds.
What this means
The combination of:
Spot CVD divergence
Hidden bullish divergence on futures CVD
Rising Open Interest at the lows
Neutral funding
Price refusing to break down - So price needs to hold.
shows that the market is absorbing aggressive selling at a key level. If buyers defend the current level, this can force newly opened shorts to cover, which would fuel the next move up.
Targets
109k
This is the first upside objective.
There is a CME ETH gap resting at this level and gaps of this type tend to get filled.
109k also aligns with the 1.113 Fibonacci extension of the latest wave.
This makes it the first logical level if price continues to hold the AVWAP and absorb selling pressure.
112k
The next major level is 112k.
This area contains single prints on CME and matches an AVWAP level on the BTC CME chart.
112k also lines up with the 1.272 extension of the wave.
From a Fibonacci rotation perspective, 1.272 is the next stop after 1.113 and often acts as a mid-cycle continuation target.
118.800
The final target sits at 118.800.
This is the full 1.618 extension of the wave and mathematically completes the auction.
If the market rotates from AVWAP support, this level becomes the natural endpoint of the move.
As long as price continues to hold the AVWAP at 90.881 and the market keeps absorbing futures selling, all three upside targets remain in play.
Invalidation
The structure changes only if price breaks below 88k. A clean drop under 88k opens the door for the next major high timeframe support at 85k.
85k carries strong confluence. It aligns with the 0.786 Fibonacci retracement on the HTF move and sits directly on a Point of Control zone within the Fixed Range Volume Profile.
Below that level, the auction shifts into a lower structure entirely.
TLDR
Bitcoin completed the downside scenario perfectly.
Price is now sitting directly on the AVWAP at 90.881.
AB=CD is complete.
LVN inside weekly FVG has been cleaned.
Futures CVD is still pressing lower but price is not. That is absorption.
But the key update is OI. OI was dropping earlier on the LTF, but now OI is rising again, and this is happening while CVD continues down and price holds steady.
That means new shorts are entering the market and getting absorbed.
If AVWAP holds, expect a bounce.
Targets:
109k
112k
118.8k
If 88k breaks, 85k is next.
--------
Abbreviation List
AVWAP
Anchored Volume Weighted Average Price. A dynamic support or resistance level based on volume since a chosen anchor.
AB=CD
A harmonic measured move where AB equals CD.
FRVP
Fixed Range Volume Profile. Shows where volume was traded inside a chosen range.
LVN
Low Volume Node. A low interest level where price often rejects strongly.
FVG
Fair Value Gap. An imbalance left by aggressive price moves.
CVD
Cumulative Volume Delta. Tracks buying vs selling pressure.
OI
Open Interest. The amount of open futures positions.
POC
Point of Control. Level with the highest traded volume.
--------
If you like this kind of analysis, drop a like and leave a comment. Everything here is shared for free so more people can cut through the noise and finally see what is actually happening under the surface. No hopium. No fear. Just real data, real structure, and real order flow.
The goal is simple. To help traders stop guessing and start understanding what the market is actually saying.
Stay sharp.
Stay objective.
And remember… the chart whispers long before it speaks.
- ThetaNomad

NZDUSD: Expecting Bullish Movement! Here is Why:
The charts are full of distraction, disturbance and are a graveyard of fear and greed which shall not cloud our judgement on the current state of affairs in the NZDUSD pair price action which suggests a high likelihood of a coming move up.
Disclosure: I am part of Trade Nation's Influencer program and receive a monthly fee for using their TradingView charts in my analysis.
❤️ Please, support our work with like & comment! ❤️

NZDCHF: Long Trade Explained
NZDCHF
- Classic bullish pattern
- Our team expects retracement
SUGGESTED TRADE:
Swing Trade
Buy NZDCHF
Entry - 0.4504
Stop - 0.4498
Take - 0.4515
Our Risk - 1%
Start protection of your profits from lower levels
Disclosure: I am part of Trade Nation's Influencer program and receive a monthly fee for using their TradingView charts in my analysis.
❤️ Please, support our work with like & comment! ❤️

AUDUSD What Next? BUY!
My dear friends,
AUDUSD looks like it will make a good move, and here are the details:
The market is trading on 0.6461 pivot level.
Bias - Bullish
Technical Indicators: Supper Trend generates a clear long signal while Pivot Point HL is currently determining the overall Bullish trend of the market.
Goal - 0.6485
Recommended Stop Loss - 0.6451
About Used Indicators:
Pivot points are a great way to identify areas of support and resistance, but they work best when combined with other kinds of technical analysis
Disclosure: I am part of Trade Nation's Influencer program and receive a monthly fee for using their TradingView charts in my analysis.
———————————
WISH YOU ALL LUCK

GOLD The Target Is UP! BUY!
My dear friends,
My technical analysis for GOLD is below:
The market is trading on 4038.3 pivot level.
Bias - Bullish
Technical Indicators: Both Super Trend & Pivot HL indicate a highly probable Bullish continuation.
Target - 4059.3
Recommended Stop Loss - 4026.8
About Used Indicators:
A pivot point is a technical analysis indicator, or calculations, used to determine the overall trend of the market over different time frames.
Disclosure: I am part of Trade Nation's Influencer program and receive a monthly fee for using their TradingView charts in my analysis.
———————————
WISH YOU ALL LUCK

GOLD: Long Trade with Entry/SL/TP
GOLD
- Classic bullish setup
- Our team expects bullish continuation
SUGGESTED TRADE:
Swing Trade
Long GOLD
Entry Point - 4089.3
Stop Loss - 4079.3
Take Profit - 4109.5
Our Risk - 1%
Start protection of your profits from lower levels
Disclosure: I am part of Trade Nation's Influencer program and receive a monthly fee for using their TradingView charts in my analysis.
❤️ Please, support our work with like & comment! ❤️

EURUSD My Opinion! BUY!
My dear friends,
Please, find my technical outlook for EURUSD below:
The instrument tests an important psychological level 1.1546
Bias - Bullish
Technical Indicators: Supper Trend gives a precise Bullish signal, while Pivot Point HL predicts price changes and potential reversals in the market.
Target - 1.1579
About Used Indicators:
Super-trend indicator is more useful in trending markets where there are clear uptrends and downtrends in price.
Disclosure: I am part of Trade Nation's Influencer program and receive a monthly fee for using their TradingView charts in my analysis.
———————————
WISH YOU ALL LUCK

XAUUSD Long: Buyers Eye Push Toward $4,100 ResistanceHello traders! XAUUSD is developing a clear technical structure after reacting multiple times to both the Supply and Demand zones, forming a well-defined pattern of price behavior. Recently, Gold rejected the Supply Line after creating a new Pivot Point near the $4,230 area — the same region where a previous strong rejection occurred. This confluence confirms that sellers remain active at the upper boundary of the market. Earlier, the market formed a Double Top pattern near the same Supply Zone, which triggered a strong bearish reversal. After the breakdown, price retested the $4,100 level several times, turning it into a meaningful local resistance. Multiple breakout attempts above this level failed, signaling strong selling pressure from the supply area.
Currently, XAUUSD is testing the Demand Line that has been respected consistently throughout the recent bullish leg. Each touch of this trendline resulted in a higher pivot point, confirming active buyers stepping into the market. This area aligns with the $4,000–$4,010 Demand Zone — a key support cluster where price has reacted with strong bullish impulses before.
My scenario as long as XAUUSD holds above the Demand Line and the $4,000–$4,010 support, the bullish structure remains valid. A rebound from this zone may initiate a fresh move toward the $4,100 Supply Zone (TP1), where the next important reaction is expected. A clean breakout above $4,100 would strengthen the bullish scenario and open the path toward $4,150–$4,170, aligning with the upper Supply Line. If Gold fails to hold above the Demand Zone, sellers may regain control and push the price lower toward the $3,960 support, signaling a deeper correction phase. For now, the market favors buying pullbacks near demand while monitoring price action closely around the $4,100 resistance. Manage your risk!

GBPUSD Correction Could Trigger Fresh Longs at 1.31200Hey Traders,
In today’s trading session we are monitoring GBPUSD for a potential buying opportunity around the 1.31200 zone.
The pair remains in a clear uptrend, and price is currently in a corrective phase, retracing back toward the 1.31200 support–resistance confluence aligned with the ascending structure.
This level has acted as a key reaction zone in previous swings, and a bullish response here could open the door for continuation toward recent highs.
Trade safe,
Joe.

XAUUSD: Bullish Rebound Setup as Price Holds Above Wedge SupportHello everyone, here is my breakdown of the current Gold setup.
Market Analysis
XAUUSD is currently maintaining a bullish market structure after rebounding from the key Wedge Support Line, which continues to act as a major dynamic support for the ongoing uptrend. The chart shows that Gold previously formed a broad Range at the top, followed by a sharp rejection from the Resistance Area near $4,170–$4,200, where strong sellers stepped in. This zone remains the primary supply region and aligns closely with the Wedge Resistance Line, creating a strong confluence barrier. After the rejection, price moved back into a correction phase, retesting both the Support Zone around $4,040–$4,070 and the ascending wedge structure. Notably, the recent bullish reaction inside this zone indicates that buyers are still defending this area effectively. Multiple breakouts and a prior fake breakout highlight that sellers are struggling to maintain downward momentum, while buyers continue to accumulate at lower levels.
Currently, XAUUSD is stabilizing just above the Support Zone, forming early signs of a potential upward continuation. As long as the price respects the wedge support and holds above $4,070, the bullish structure remains intact. The market behavior suggests increasing buyer interest, especially during retests of lower support.
My Scenario & Strategy
I expect Gold to continue its upward movement from the current support area and retest the $4,170–$4,200 Resistance Zone once again. This level will be the next major decision point; a successful breakout above this zone could open the path toward higher highs and potentially signal a continuation of the broader bullish trend.
However, if XAUUSD breaks below the Wedge Support Line, the bullish outlook would weaken, and the price could revisit deeper support levels before buyers attempt another recovery. For now, bullish continuation remains the most probable scenario as long as the support structure holds. Pullback-based long entries remain the best approach while price continues to trade above the key support zone and upward trendline.
That's the setup I'm tracking. Thank you for your attention, and always manage your risk.

EURUSD Will Go Higher! Long!
Please, check our technical outlook for EURUSD.
Time Frame: 9h
Current Trend: Bullish
Sentiment: Oversold (based on 7-period RSI)
Forecast: Bullish
The market is approaching a significant support area 1.158.
The underlined horizontal cluster clearly indicates a highly probable bullish movement with target 1.165 level.
P.S
We determine oversold/overbought condition with RSI indicator.
When it drops below 30 - the market is considered to be oversold.
When it bounces above 70 - the market is considered to be overbought.
Like and subscribe and comment my ideas if you enjoy them!

BTCUSD Rebounds From Channel Support — Targeting $93K PullbackHello traders! Let’s break down the current BTCUSD market structure. Bitcoin continues to move within a well-defined descending channel, where price has repeatedly respected both the resistance and support lines. Every touch of the upper boundary resulted in a Turned Around reaction, confirming strong seller dominance throughout the downtrend. After breaking below a key local support, BTCUSD shifted into a deeper bearish phase and moved toward the broader Support Zone beneath $90,000. This level aligns with the lower boundary of the descending channel and has acted as a strong reaction area in previous price swings. Recently, price reached the channel’s support line, where buyers stepped in and formed an early rebound attempt. BTCUSD is now showing signs of a potential short-term correction, with price aiming toward the nearest resistance cluster at $93,000–$96,000, which also represents the mid-channel region and a key retest zone. As long as Bitcoin stays below the descending resistance line, the broader trend remains bearish. However, a corrective move toward TP1 near $93,000 is likely if the current support continues to hold. A rejection from the resistance area could send the price back toward the channel bottom for another test. A confirmed breakout above the descending resistance line would be the first signal of a potential shift in momentum and could open the way for a stronger recovery. Until then, BTCUSD remains in a bearish structure with a possible short-term bullish pullback. Please share this idea with your friends and click Boost 🚀

BITCOIN BULLS WILL DOMINATE THE MARKET|LONG
BITCOIN SIGNAL
Trade Direction: long
Entry Level: 91,611.86
Target Level: 109,265.02
Stop Loss: 79,807.17
RISK PROFILE
Risk level: medium
Suggested risk: 1%
Timeframe: 12h
Disclosure: I am part of Trade Nation's Influencer program and receive a monthly fee for using their TradingView charts in my analysis.
✅LIKE AND COMMENT MY IDEAS✅
