GBP/CHF BULLISH BIAS RIGHT NOW| LONG
Hello, Friends!
Previous week’s red candle means that for us the GBP/CHF pair is in the downtrend. And the current movement leg was also down but the support line will be hit soon and lower BB band proximity will signal an oversold condition so we will go for a counter-trend long trade with the target being at 1.050.
Disclosure: I am part of Trade Nation's Influencer program and receive a monthly fee for using their TradingView charts in my analysis.
✅LIKE AND COMMENT MY IDEAS✅
Long!!!!

HK50 Long Setup at 25,875Crab pattern completes on M30 and H1, marking a potential reversal zone near current price.
Triple bottom visible on M30 and H1, reinforcing a well defined support shelf.
RSI is rising as the triple bottom forms, which supports the idea of accumulation rather than a weak bounce.
Daily trend remains up, so a rebound aligns with the higher time frame bias.
Timeframes up to H4 are oversold, which suggests short term selling pressure is stretched and vulnerable to mean reversion.
Stay alert to a possible regime shift toward bearish conditions. If market tone deteriorates, prioritise defense and faster exit.
RSI divergence of about 18 points on M30, indicating buyers are stepping in while downside momentum fades.
Look for a momentum confirmation trigger, for example, an M30 higher low or an H1 close above the most recent swing high.
Entry: 25,875 at or just above the reversal zone.
Stop loss: 25,650 to avoid crowding structure while cleanly invalidating the setup if broken.
First target: 26,475, which aligns with nearby resistance and a conservative mean reversion objective.
Secondary decision point: monitor price behavior as M15 and M30 approach overbought. If thrust is weak, scale partials and tighten risk.

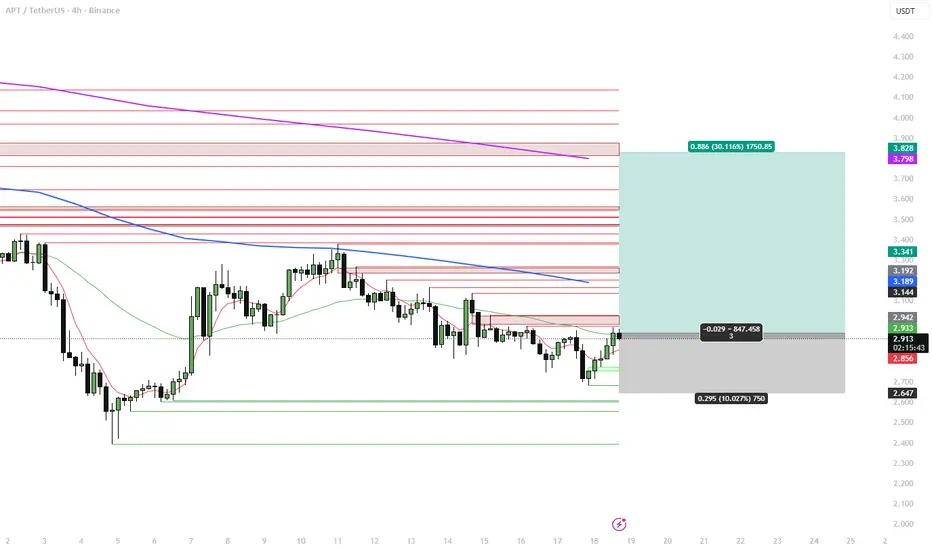
APT 4H – Stablecoin-heavy L1, swing long from local baseAptos is trading around $2.9 with a market cap near $2.1B, still down ~85% from the $19.9 ATH. At the same time the chain carries ~$512M TVL and ~$1.27B in stablecoins (almost half of that in the RWA token BUIDL). That’s a lot of liquidity for a token this depressed.
Over the last month APT is up ~+10%, and on several recent days Aptos briefly beat both Ethereum and Solana by net stablecoin inflows. The main fundamental driver is the Aave V3 launch on Aptos (first non-EVM deployment) plus an institutional staking narrative (Everstake + Paribu Custody). The big overhang is still tokenomics: ~11–12M APT unlocks each month in 2025 and generally high inflation vs current on-chain demand, plus the controversial “freeze” function at protocol level.
Technical view (#4h)
On the 4H chart APT has been in a controlled downtrend from the 3.7–3.8 area and recently put in a local low near 2.63–2.65, right on my lower ATR / demand zone.
Now:
Price is reclaiming the short EMA and pressing into the 4H EMA band from below around 2.9–3.0.
Below sits a well-defined support shelf at 2.60–2.65; above are stacked supply/FVG levels around 3.16–3.20 and a larger cluster near 3.8–3.9, which coincides with higher-TF EMA and previous breakdown zone.
My 4H system has flipped from pure deviation mode to an early trend-reversal long: oversold extension + first reclaim of the EMA band.
I treat this as a swing-long attempt from a local base inside a bigger bearish cycle, targeting a move back into the prior distribution zone.
Trade plan (swing 3–10 days)
Entry: around 2.90–2.95 (current price area).
Main target: 3.30–3.35 – first 4H supply band and old support.
Extended target: 3.80–3.85 – upper supply zone and confluence with higher-TF resistance.
Stop / invalidation: below 2.63–2.65. A confirmed 4H close under this level would mean the current base failed and I step aside instead of averaging down.
This gives roughly 3:1 R:R toward the extended target.
Fundamental context
Aptos is a Move L1 with strong stablecoin presence: ~$1.27B in stables and ~$512M TVL, plus meaningful RWA share (BUIDL ≈44% of stablecoin cap).
Aave V3 on Aptos is the first non-EVM deployment for Aave, anchoring a more “institutional” DeFi narrative on this chain.
Institutional staking partnerships (Everstake + Paribu Custody) support the idea of APT as a staking asset, but not yet as a clear “number go up” token.
Main risks: continuous monthly unlocks (~11M+ APT), inflationary supply vs demand, and competition from larger L1s (Sui, Solana) with bigger TVL and higher chain revenue.
Alternative scenario
If APT loses 2.63–2.65 and starts closing 4H candles below this zone on rising volume, I’ll consider the current long thesis invalid and look for a deeper capitulation / deviation toward 2.4–2.2 before reassessing. No averaging into unlock-driven selling.
Not financial advice – just how I’m structuring a 4H swing long on APT around strong on-chain liquidity and Aave V3, while respecting the heavy tokenomics overhead.
BITCOIN | LONG BIAS | POTENTIAL REVERSAL AND KEY LEVELS TO WATCHTraders,
Bitcoin is now sitting inside a large falling wedge structure on the daily chart. Wedges of this type often form during trend exhaustion and can precede significant reversals when the lower boundary is reached. This pattern sets the stage for everything that follows in this analysis.
Below is the full breakdown of why I believe Bitcoin is positioned for a potential reaction and where the most important levels are located.
Recap of the Previous Bitcoin Analysis
In the previous IG:BITCOIN analysis
I mentioned two scenarios. Scenario one outlined the following sequence:
• Price pushes into 107k to 108k
• That move sweeps the weak high and taps the AVWAP anchor
• If spot CVD slows or perps shift into net selling, a rejection becomes likely
• That rejection sends price back toward the mid range and possibly into 101k to 102k
• Continuation into the higher timeframe LVN at 98k becomes possible
Every single step unfolded almost perfectly.
Current State of Bitcoin
Bitcoin is now sitting directly on the lower band of the AVWAP anchored from 7 April 2025.
What this means
AVWAP stands for Anchored Volume Weighted Average Price. It calculates the average position of market participants beginning from the chosen anchor point. The April low marked a major shift in trend structure. When price reaches the lower band of an AVWAP anchored to such a significant low, it often acts as dynamic support. This is because it reflects the average entry of early cycle buyers.
If price holds and begins reclaiming from this area, it signals that the strongest hands are defending their positions. If it fails, the market risks a deeper flush into lower demand clusters.
Value Zone Analysis with Fixed Range Volume Profile
To determine whether Bitcoin is inside a significant value region, we use a Fixed Range Volume Profile (FRVP). The range is anchored from the April low to the October high.
Zooming into the profile on the left, price has now re-entered the core value area of this entire swing. The red horizontal line marks the Point of Control, which is the level with the highest traded volume in the entire range. The current low sits almost exactly on this level.
Pixel perfect confluence.
Why this matters
When price returns to the value area after a distribution phase, two possible outcomes appear:
1. Reversal
Buyers defend value and price rotates back toward high volume nodes above.
2. Continuation breakdown
Price accepts below value, meaning even previous buyers are unwilling to re accumulate here. This opens the door to the next low volume pocket and lower demand zones.
Right now, the reaction at this level is critical because we have perfect alignment between the lower AVWAP band and the FRVP Point of Control.
Mathematical Levels and Fibonacci Structure
Now we collect the mathematical evidence. We are sitting at a core AVWAP level and a core FRVP level. Now we check if the market is stretched mathematically.
Bitcoin at the 1.618 Extension
On the four hour spot chart, I apply a Trend Based Fibonacci Extension from A to B and project it from C.
The placement rule
Ask yourself:
What was the last meaningful swing high that ended the previous trend and started the current reversal?
That swing becomes A to B. The first corrective lower high after that becomes C.
Using this structure, Bitcoin has now extended perfectly into the 1.618 level. The 1.618 Fibonacci extension is historically associated with exhaustion. Sharp downlegs often pause, take liquidity, or reverse at this point.
TOTAL at the 2.0 Extension
To confirm that this move is not isolated to Bitcoin, we check the CRYPTOCAP:TOTAL crypto market.
TOTAL reflects the entire crypto market and shows equilibrium conditions.
When Bitcoin and TOTAL stretch at the same time, reaction probability increases.
Start with a retracement from A to B:
Price nearly hit the fifty percent mark but not entirely. Then reverse the tool from B to A. Doing so reveals the extension levels below. Price is now sitting exactly at the 2.0 extension.
Why the 50 percent connects to the 2.0
If a move retraces halfway, the remaining distance becomes the basis of the flipped extension. Doubling that distance gives the 2.0 level.
Because TOTAL did not fully reach the fifty percent retracement, there is a small missing portion. To visualise this, I draw a box between the actual retracement and the fifty percent level. Then I duplicate the box under the 2.0 extension.
The duplicated box lands perfectly on the current low, showing mathematical symmetry.
Additional Mathematical Check
I also check the structure that began after the 10 October crash.
By extending from B to A, the downside projections appear. Price tagged the 1.618 level perfectly.
Full symmetry
Bitcoin at the 1.618
TOTAL at the 2.0
Internal structure at the 1.618
When all three align, the move has reached market wide symmetry. These zones commonly produce strong reactions or reversals.
Summary so far
We now have confluence in four categories:
• AVWAP support
• FRVP Point of Control support
• Fibonacci extensions on BTC and TOTAL
• Mathematical symmetry across multiple swings
Next, we check the internal fuel of the move: order flow.
Order Flow Analysis
Spot CVD Divergence
On both the one hour and thirty minute charts, Spot CVD continues making lower lows while price holds steady. This means aggressive sellers are pushing market sell but price refuses to break down. This can only occur when passive limit buyers absorb the flow.
This is hidden absorption.
Coin Margined Futures CVD
Coin margined CVD shows the same pattern: lower lows while price stays flat.
This indicates aggressive shorting with no continuation.
Why coin margined matters
Coin margined futures use BTC as collateral. When price declines, the collateral loses value. When price rises, shorts lose even more because both their collateral and their position move against them. Coin margined shorts get squeezed harder and faster.
Open Interest
• Stablecoin margined OI: holding steady. Traders continue to open or maintain positions during sell pressure.
• Coin margined OI: compressed during the dump and is now flat. This means shorts are sitting in the market and can be forced out.
Summary
Price stable
CVD falling
OI steady
This is absorption combined with short build-up.
This often leads to a sharp reversal when price begins to lift.
Volume Analysis
Chart:
Accumulation and Distribution (A D Indicator)
The A D indicator shows whether volume flows into candles or out of them.
On the one hour chart, the A/D is trending up while price stays flat. This means buyers are stepping in during down-wicks and absorbing sell pressure. Price is not showing this strength yet, which is typical for accumulation phases.
On Balance Volume (OBV)
OBV measures directional volume flow.
On the last wick down, OBV actually moved up.
This means buyers absorbed the move rather than sellers pushing price down.
This is the classic bullish volume divergence after a liquidity sweep. Both Spot and Perps Confirm
These divergences appear on both spot and perpetual futures. Spot confirmation is the strongest form of validation because it represents real buying without leverage distortion.
The combination of A/D rising, OBV diverging, Spot CVD falling, and Futures CVD falling strongly supports that the sell pressure is being absorbed.
What Happens Next
Based on everything above, I expect Bitcoin to start by taking the weak local high at 99,862. Weak highs form when the wick structure is sloppy and no real sellers defended the level. On fine tick data, this high looks even weaker.
Taking that high breaks the current local structure and potentially triggers a short squeeze. If Bitcoin begins closing four hour candles above 106,200, the next important level is 108,500.
Main Thesis
Bitcoin pushes into the first target zone and performs a Swing Failure Pattern around 115,700. With strong momentum, the move could extend into the 17,300 to 18,000 region.
Invalidation and Downside
If Bitcoin loses support and spends meaningful time below 93,000, the next major support is 84,617. This is the next Point of Control from the AVWAP auction and an extremely important level to watch.
All relevant levels are marked on the charts.
Trade safe and manage risk.
From the depths of the sands,
ThetaNomad
-------------------
If you like my analysis, give it a like and leave a comment so more people can see real analysis without the noise.

UNI 4H – Post-UNIfication consolidation longUniswap remains one of the key DEX protocols: TVL is around $4.5B and 30-day DEX volume is roughly $94.6B, which keeps Uniswap at the top of the sector by liquidity and fee generation.
Over the last 30 days UNI is up ~+22%, with a sharp acceleration in November (70%+ week) after the UNIfication proposal: enabling protocol fees and burning up to 100M UNI (~16% of supply). That fundamentally changes expectations for UNI as a value-accrual token rather than “governance only”.
On derivatives, UNI trades with deep liquidity: OI ≈ $560M, ~ $1.16B futures volume and ~$220M spot per 24h, so larger positions can enter/exit without severe slippage. Regulatory tail risk also eased earlier this year when the SEC closed its investigation into Uniswap Labs without charges.
Technical setup (#4h)
After the vertical post-UNIfication spike into the 10–11 area, UNI has been digesting the move in a sideways 4H range roughly between 7.3 and 8.1:
Price is hovering around the 4H EMA band; on higher TFs (1D–3D) UNI still trades above the main EMAs, keeping the broader uptrend intact.
Multiple tests of the lower part of the range (7.3–7.5) have been bought back, with my PRICE_EMA long signals firing near the lower deviation/ATR zone.
Overhead, a major supply/OB cluster sits around 10–10.5, which also matches the prior spike highs and HTF resistance.
I view this as a post-news consolidation above support within an emerging bullish trend.
Strategy context
This trade comes from my 4H EMA-based swing system (trend-following mode):
The system focuses on buying pullbacks to the EMA band during strong momentum phases and targeting prior liquidity zones.
Sample of 30+ trades on alts shows roughly ~70% win rate with average winners larger than losers, at the cost of relatively wide stops and multi-day holding times.
UNI currently fits the “momentum + consolidation on EMAs” template for this system.
Trade plan (swing 3–10 days)
Entry zone: ~7.5–7.7 (current spot around 7.6–7.7).
Main target: 10.2–10.3 – retest of the post-UNIfication spike high and upper supply block.
Stop / invalidation: below 6.8–6.9 (under the lower ATR band and recent local lows). A 4H close below this zone would mean the consolidation broke down and the “second leg” scenario is off.
This gives a rough R:R of ~3.5:1 from entry to the 10.2–10.3 target.
I’ll look to trail partial size if price breaks and holds above 8.5 (orange level) with strong volume, but the core idea is to catch one clean extension from the current range into the upper resistance cluster.
Fundamental snapshot
Key bullish points:
UNIfication: proposal to turn on protocol fees and burn up to 100M UNI (~16% supply), aligning Labs, Foundation and DAO economics and finally connecting UNI to protocol cash flows.
Strong fee engine: Uniswap generates ~$1.25B annualized fees, ~$100M in the last 30 days, currently all going to LPs – a large “pool of value” that fee switch can redirect partially to UNI.
Sector leadership: ~$94.6B 30-day DEX volume and deep liquidity in UNI markets (tens of millions in depth), making it one of the core DeFi blue chips.
SEC case closed: investigation into Uniswap Labs ended without charges, cutting a major tail risk.
Key risks:
UNIfication is not fully implemented yet – parameters of fee switch and burn (LP share vs DAO vs burn) can still change and may trigger LP outflows.
DeFi / DEX tokens as a group still trade at a discount vs L1s, and Fear & Greed is in Extreme Fear territory.
UNI is still ~−80% below its $44 ATH, so structurally it’s early in any potential new DeFi cycle.
Alternative scenario
If UNI breaks down and starts closing 4H candles below 6.8–6.9 with no new positive catalysts on UNIfication or DeFi sentiment, I’ll treat this setup as invalid and stand aside, watching the 6.0–5.5 area for a deeper retrace and fresh structure before considering new longs.
Not financial advice — just my structured 4H EMA swing long on UNI, combining the current consolidation pattern with system stats and the UNIfication fundamental narrative.

EURUSD: Market of Buyers
The recent price action on the EURUSD pair was keeping me on the fence, however, my bias is slowly but surely changing into the bullish one and I think we will see the price go up.
Disclosure: I am part of Trade Nation's Influencer program and receive a monthly fee for using their TradingView charts in my analysis.
❤️ Please, support our work with like & comment! ❤️

AUDCAD Set To Grow! BUY!
My dear subscribers,
My technical analysis for AUDCAD is below:
The price is coiling around a solid key level - 0.9117
Bias - Bullish
Technical Indicators: Pivot Points Low anticipates a potential price reversal.
Super trend shows a clear buy, giving a perfect indicators' convergence.
Goal - 0.9143
About Used Indicators:
By the very nature of the supertrend indicator, it offers firm support and resistance levels for traders to enter and exit trades. Additionally, it also provides signals for setting stop losses
Disclosure: I am part of Trade Nation's Influencer program and receive a monthly fee for using their TradingView charts in my analysis.
———————————
WISH YOU ALL LUCK

GBPCAD Will Explode! BUY!
My dear friends,
Please, find my technical outlook for GBPCAD below:
The price is coiling around a solid key level - 1.8446
Bias - Bullish
Technical Indicators: Pivot Points High anticipates a potential price reversal.
Super trend shows a clear buy, giving a perfect indicators' convergence.
Goal - 1.8468
Safe Stop Loss - 1.8434
About Used Indicators:
The pivot point itself is simply the average of the high, low and closing prices from the previous trading day.
Disclosure: I am part of Trade Nation's Influencer program and receive a monthly fee for using their TradingView charts in my analysis.
———————————
WISH YOU ALL LUCK

Gold Eyes 4,000 — Key Buy Zone Ahead!!Hey Traders,
Today we’re keeping a close watch on XAUUSD, which continues to trade firmly within its medium-term uptrend. Price is currently pulling back in a healthy correction, and the 4,000 zone stands out as a major confluence level — a structural support, previous reaction area, and dynamic trend touchpoint.
A controlled dip into this zone could attract fresh buyers, especially with markets still leaning toward risk caution and demand for safe-haven flows remaining elevated. As long as the broader trend structure holds, Gold may attempt another leg higher from this area.
Trade safe,
Joe.

AUDUSD: Watching 0.6470 as Fed Cut Bets GrowHey Traders,
In today’s session we’re monitoring AUDUSD for a potential buying opportunity around the 0.64700 zone. The pair remains in a clear uptrend, and price is currently pulling back toward a major trend support / S&R confluence at 0.64700 — a level where bulls have previously stepped in with conviction.
On the macro side, I continue to think that the incoming data will ultimately force the FED into a December cut, despite the market still being mixed on the odds. If that scenario plays out, it would set the stage for broad USD weakness, which aligns perfectly with a bullish continuation on AUDUSD.
A reaction from the 0.64700 area could offer a solid continuation setup if the trend structure holds.
Trade safe,
Joe.

AUDUSD: Bullish Forecast & Bullish Scenario
It is essential that we apply multitimeframe technical analysis and there is no better example of why that is the case than the current AUDUSD chart which, if analyzed properly, clearly points in the upward direction.
Disclosure: I am part of Trade Nation's Influencer program and receive a monthly fee for using their TradingView charts in my analysis.
❤️ Please, support our work with like & comment! ❤️

AUDNZD: Bullish Continuation & Long Trade
AUDNZD
- Classic bullish formation
- Our team expects growth
SUGGESTED TRADE:
Swing Trade
Buy AUDNZD
Entry Level - 1.1465
Sl - 1.1458
Tp - 1.1479
Our Risk - 1%
Start protection of your profits from lower levels
Disclosure: I am part of Trade Nation's Influencer program and receive a monthly fee for using their TradingView charts in my analysis.
❤️ Please, support our work with like & comment! ❤️

BTCUSD Long: Short-Term Correction Eyes $97,500 ResistanceHello traders! BTCUSD continues to trade within a well-defined descending channel, maintaining a broader bearish structure while forming a series of lower highs and lower lows. Throughout the move, the price has created multiple pivot points along both the upper and lower channel boundaries, confirming the strength of this trend. Inside the channel, Bitcoin developed two notable range phases, each reflecting temporary consolidation before continuing downward. A key formation on the chart is the Rounding Top Pattern, which developed near the mid-channel area. This structure signaled weakening bullish pressure and preceded a sharp decline back toward the channel’s lower boundary. After the breakdown, BTC attempted a small recovery, but price failed at the Supply Zone, creating a rejection that aligned with a bearish breakout confirmation.
Currently, the price is approaching the $97,500 short-term target, which sits close to the lower edge of the Supply Zone. This level has acted as a significant reaction area several times, and the market may retest it before deciding the next direction. As long as BTC trades within the descending channel, the broader trend remains bearish, but short-term corrective moves to the upside are possible due to the strong reaction from demand.
My scenario as long as BTCUSD holds above the Demand Zone ($94,000–$94,500) and shows continued strength, a corrective move toward $97,500 remains likely. This level represents the nearest resistance and aligns with previous supply reactions. A clean breakout above $97,500 would open the way for a deeper correction toward the channel’s mid-line or even the upper boundary. However, if price gets rejected at the supply zone again, sellers may regain control and attempt another push back toward the demand area. A confirmed break below the Demand Zone would invalidate the bullish recovery setup and could trigger continuation of the broader downtrend. For now, the structure supports short-term bullish correction, but overall trend remains bearish until the descending channel is broken. Manage your risk!

AUD/NZD BEST PLACE TO BUY FROM|LONG
AUD/NZD SIGNAL
Trade Direction: long
Entry Level: 1.146
Target Level: 1.159
Stop Loss: 1.137
RISK PROFILE
Risk level: medium
Suggested risk: 1%
Timeframe: 6h
Disclosure: I am part of Trade Nation's Influencer program and receive a monthly fee for using their TradingView charts in my analysis.
✅LIKE AND COMMENT MY IDEAS✅

AUD/CAD LONG FROM SUPPORT
Hello, Friends!
Bullish trend on AUD/CAD, defined by the green colour of the last week candle combined with the fact the pair is oversold based on the BB lower band proximity, makes me expect a bullish rebound from the support line below and a retest of the local target above at 0.917.
Disclosure: I am part of Trade Nation's Influencer program and receive a monthly fee for using their TradingView charts in my analysis.
✅LIKE AND COMMENT MY IDEAS✅

BTCUSD: Buyers Aiming for a Move Toward 99,000 ResistanceHello everyone, here is my breakdown of the current Bitcoin setup.
Market Analysis
BTCUSD has recently completed a strong downward phase inside a well-defined Downward Channel, where price continuously formed lower highs and lower lows. After reaching the Support Zone around $94,500–$95,200, buyers stepped in and created a fake breakout, followed by a quick recovery — a sign of weakening seller pressure. Following this rebound, Bitcoin formed an Inverse Head and Shoulders pattern, confirming a potential bullish reversal. Price has now broken above the Triangle Resistance Line, signaling the first structural shift from bearish to bullish.
Currently, BTCUSD is consolidating just above the $95,500–$96,000 support zone, which now acts as a retest area for the breakout. As long as BTC stays above the Triangle Support Line, bullish momentum remains intact, and the market structure favors further upward movement. The nearest target for buyers is the $99,000 Resistance Zone, which previously acted as a strong supply area. A successful breakout above $99,000 would confirm bullish continuation and open the way toward higher resistance levels. If price fails to hold above support, a short-term pullback toward the lower triangle boundary may occur before buyers try to regain control.
My Scenario & Strategy
I expect BTCUSD to maintain its bullish bias as long as price trades above the Triangle Support Line and the key support zone. Potential long entries remain valid on retests of the $95,500–$96,000 area, with a primary target at the $99,000 Resistance Zone (TP1).
A confirmed breakout above $99,000 would strengthen bullish momentum and open the next leg upward. However, a breakdown below the triangle structure may lead to a deeper correction toward $94,500. For now, sentiment remains bullish, and Bitcoin appears ready for a continued recovery within the new reversal structure.
That's the setup I'm tracking. Thank you for your attention, and always manage your risk.

USOIL Is Bullish! Buy!
Please, check our technical outlook for USOIL.
Time Frame: 9h
Current Trend: Bullish
Sentiment: Oversold (based on 7-period RSI)
Forecast: Bullish
The market is trading around a solid horizontal structure 59.384.
The above observations make me that the market will inevitably achieve 61.007 level.
P.S
The term oversold refers to a condition where an asset has traded lower in price and has the potential for a price bounce.
Overbought refers to market scenarios where the instrument is traded considerably higher than its fair value. Overvaluation is caused by market sentiments when there is positive news.
Like and subscribe and comment my ideas if you enjoy them!

BTC the way on 89000🔍 What the chart is showing right now
1. Trend Bias:
Bearish Price is below EMA50 and EMA200 → structure still bearish.
Multiple lower highs and strong rejection from descending trendline.
Market is holding below major supply zones (100k–102k, 105k–107k, 109k–111k).
2. Current Area:
Demand reaction zone Price bounced from a blue demand block ~93.0k–94.5k.
Weak bounce so far — no strong volume or bullish displacement.
A lower-timeframe liquidity sweep happened at the bottom → short-term bullish correction possible.
3. Nearest resistance
First big sell zone: 97.8k–99.5k
If price reaches it, sellers will likely hit aggressively.

BTCUSD Technical Analysis – Is a Correction on the Way?BINANCE:BTCUSD is currently trading inside a well-defined falling wedge, and the price is pressing against the lower boundary of the pattern. This level could serve as dynamic support, and if a strong rejection occurs, we may see a corrective move toward the 102,000 resistance area.
If sellers successfully defend that zone, the bearish structure remains intact, increasing the likelihood of BTCUSD moving back down to lower price levels. However, if price breaks above this resistance, a deeper correction toward the upper boundary of the wedge could unfold.
At this stage, closely monitoring candlestick signals and volume activity around this key area is essential for spotting high-quality selling opportunities. Ensure every trade setup is backed by solid confirmation, and always maintain strict risk management.
If you have any thoughts or additional perspectives on this setup, I’d be happy to hear them. Feel free to share your opinion in the comments!

JUP 4H – Deviation long from lower rangeJUPUSDT (Bybit) is trading near the lower end of its autumn range after a clean 4H downtrend from the 0.33–0.34 area. My 4H EMA deviation system has just printed a long signal as price extends away from the higher-timeframe averages.
Technical setup (#4h)
Price is below the 4H, 1D and 3D EMAs, with Dev% on multiple TFs showing strong downside extension (high single-digit / low double-digit % below the mean).
We’ve just tagged a new local low around 0.25–0.26 with several multi-TF exhaustion markers firing near the lower ATR band.
Overhead, the first liquidity pocket and resistance cluster sits around 0.26–0.28, with a larger supply/FVG zone and EMA confluence around 0.30–0.31.
I treat this move as a late leg of the existing selloff and a potential mean-reversion opportunity back into the 4H EMA ribbon and prior supply.
Strategy stats (this 4H deviation system)
Backtest/forward sample: 33 trades, all longs
Win rate: ~69.7% (23 wins / 10 losses)
Avg PnL per trade: ~+4.1%
Avg winning trade: ~+10.0%
Avg losing trade: ~−9.6%
Avg bars in trade: ~34 bars on #4h (≈ 5–6 days), with losers typically lasting longer than winners
The system is built to catch oversold 4H swings with a relatively high hit rate and symmetric win/loss size, so sticking to invalidation levels is crucial.
Trade plan (swing 3–7 days)
Entry: around 0.26 (current long triggered in this area).
Main target: 0.300–0.305 — previous 4H supply zone and confluence with the EMA band.
Stop / invalidation: below 0.247. A 4H close under this level would mean the current demand failed and opens the door toward deeper supports around 0.23–0.22.
This setup offers roughly 3:1 R:R from entry to the 0.30–0.305 target.
Fundamental snapshot (Jupiter)
Jupiter is the main DEX aggregator and perps venue on Solana. Over the last 30 days:
Protocol fees / revenue are roughly $78.8M / $19.0M, showing a robust on-chain business across spot + perps.
Governance approved a burn of ~130M JUP (~4% of circulating supply) from the Litterbox Trust (vote passed on 4 Nov 2025).
Token unlocks continue on a scheduled basis (e.g. ~53.47M JUP on 28 Oct 2025), keeping some overhang in the short term.
November 2025: launch of the Jupiter ICO / launchpad platform, adding another product line on top of swaps and perps.
Saros DLMM integration is aimed at deeper liquidity for JUP and ecosystem pairs.
Net read: cash-flow-positive DeFi infra with upcoming product catalysts, but short-term price still sensitive to unlocks and derivatives positioning — a good environment for volatile swings and mean-reversion trades.
Alternative scenario
If unlock / derivative selling pressure accelerates and JUP starts closing 4H candles below 0.247, I’ll consider this idea invalid and look for a new deviation long lower in the 0.23–0.22 zone rather than averaging down.
Not financial advice — this is my structured 4H EMA deviation long on JUP, combining system stats with current Jupiter fundamentals.
SUI 4H — Deviation long into unlock risk (mean-reversion setup)Got a fresh long signal from my 4H EMA deviation strategy on SUIUSDT (Bybit).
After a persistent downtrend from the 2.3–2.0 area, price has flushed into my lower deviation / demand zone and is now extended from the main EMAs on several timeframes.
On the chart (#4h):
– Price is trading well below the 4H and 1D EMAs, Dev% on multiple TFs shows strong extension away from the mean.
– We just printed another local low with a cluster of my multi-TF “exhaustion” signals, right on the lower ATR band.
– Above price sit the first liquidity pockets around 1.66–1.69 and then a larger supply/FVG zone near 1.75–1.83, aligned with the 4H EMA ribbon.
– I treat this move as a liquidation / unlock front-run leg inside a still-resilient higher-TF range for SUI.
Strategy stats (for this 4H deviation system)
31 trades, all longs:
– Winrate ≈ 83.9% (26W / 5L)
– Avg win ≈ +12.5%, avg loss ≈ −6.6% → avg R:R ≈ 2.37
– Avg holding time ≈ 24 bars on #4h (about 4 days)
So the system is designed to take oversold 4H swings and ride the mean-reversion back into the EMA band / supply zones over 2–5 days.
Trade plan (swing 2–5 days)
– Entry: around 1.60–1.62 (current long triggered near 1.61).
– Main target: 1.75–1.77 — first 4H supply zone and mid of the previous distribution block.
– Extended target: 1.82–1.83 — upper boundary of the 4H supply cluster and confluence with higher EMA/ATR levels.
– Invalidation: 4H close below 1.48. That break would mean the current demand zone failed and I step aside.
This gives an R:R of roughly 1:2 from entry to the extended target.
Fundamental snapshot
SUI is still holding in the upper part of its yearly range despite the recent correction. Over the last 30 days:
– TVL around ~$3.03B (≈$1.64B bridged, ~$1.39B native), with strong DEX volume (~$383.5M/day) and perps volume (~$144.3M/day).
– Narrative tailwinds: upcoming USDsui native stablecoin from Bridge (Stripe-backed), institutional rails via Crypto.com custody/liquidity, and the Mysticeti v2 core upgrade from Mysten Labs.
– Headwinds: notable November unlocks (~$146.6M pool), TVL pullback of ~15% from the October peak and sector-wide risk-off in L1/alt space.
Net read: structurally positive fundamentals and growing ecosystem, but short-term risk is higher due to unlocks and derivatives positioning — ideal conditions for sharp but tradeable mean-reversion moves.
Alternative scenario
If unlock selling and risk-off pressure continue and SUI starts closing 4H candles below 1.48, I’ll treat this as a deeper leg toward the next demand around 1.40–1.35 and will wait for a new deviation signal rather than averaging down.
Not financial advice — just a structured 4H deviation long based on my system stats and current SUI fundamentals.
SYRUP 4H — Deviation long (Maple Finance)SYRUP (Maple Finance) printed a strong flush on the 4H chart and is now trading in my first demand / deviation zone after breaking down from the 0.42–0.45 range.
Fundamentals remain constructive:
– AUM > $5B in Q3, up ~66% QoQ.
– Q3 revenue around $4M with an October ATH of ~$2.16M.
– 25% of protocol revenue is allocated to SYRUP buybacks and staker rewards (MIP-018/019), directly linking the token to cash flows.
So we have a fundamentally supported DeFi credit token going through a short-term deleveraging move.
On the 4H chart:
– Price is trading below both 4H and 1D EMAs, with Dev% showing clear oversold conditions vs the mean.
– The last leg down came with a vertical selling cluster into the lower ATR band.
– Above price, the key liquidity zones are 0.422–0.423 (broken support + EMA area) and 0.44–0.445 (supply cluster / range high).
I treat this as a potential mean-reversion setup rather than a fresh downtrend start.
Trade plan (swing 1–5 days)
– Long area: 0.395–0.405, with optional partial add on a spike toward 0.38.
– Main target: 0.422–0.423 — retest of broken support and the 4H EMA region.
– Extended target: 0.44–0.445 — upper supply zone and range high.
– Invalidaton: 4H closes below 0.355. Stop goes under this level; if it breaks and holds, the setup is done and I wait for a new base lower (0.334–0.31).
This gives an approximate R:R of ~1:2 toward the main target and higher if the extended target is hit.
Alternative scenario
If DeFi risk keeps unwinding and 0.355 fails to hold, I expect price to explore the 0.334–0.31 area, where a new accumulation zone may form. In that case this long idea is invalid and I’ll re-map the structure before looking for the next entry.
Not financial advice — just my 4H EMA deviation swing framework combined with current fundamentals on Maple Finance.

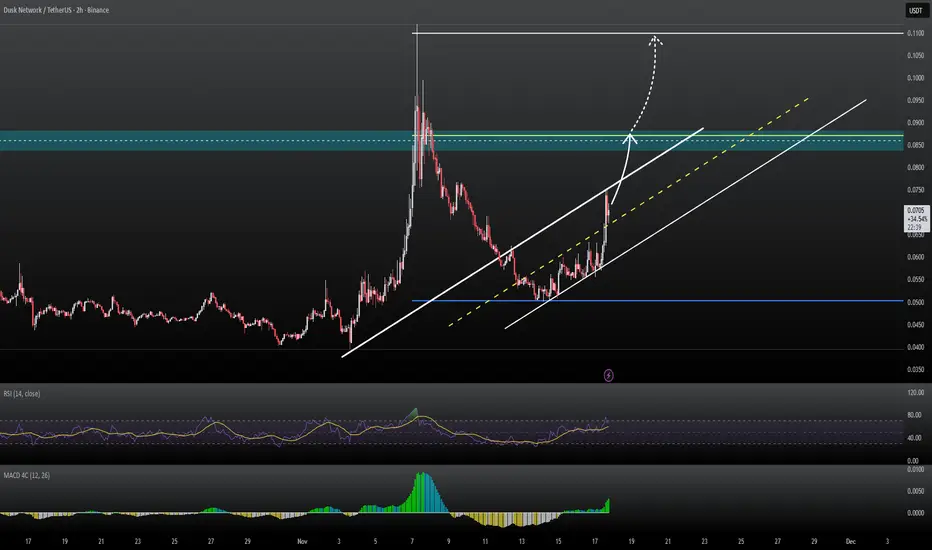
DUSK/USDT: Bullish Reversal & Breakout SetupHey traders!
DUSK has successfully bounced from the 0.067–0.069 USDT support zone on the 1H/4H timeframes. The price has reclaimed the local Moving Average, accompanied by strong impulse candles, suggesting a shift in momentum.
We are currently stabilizing after the breakout, looking for a retest of the support zone to confirm the uptrend.
Trade Setup:
Entry Zone: $0.0675 – $0.0690 (Retest of breakout level)
Stop Loss: $0.0625 – $0.0630 (Below market structure)
Targets (Based on Fib Extensions):
TP1: $0.0780
TP2: $0.0845
TP3: $0.0950 – $0.1000
Moonbag: $0.112+
Risk Management: Move SL to breakeven after hitting TP1. If the price loses the $0.067 support, the setup is invalidated.