#030: Long Investment Opportunity on CHF/JPY
I'm monitoring CHF/JPY for a potential long entry with a Buy Limit at 184,800, with a stop loss at 184,100 and a take profit at 186,200. Hello, I'm Forex Trader Andrea Russo, an independent trader and prop trader with $200,000 in capital under management. Thank you in advance for your time.
The trade is based on technical-behavioral analysis, with particular attention to:
price structure,
sentiment dynamics,
and price behavior in key zones.
🔍 Why 184,800?
This area has acted as a dynamic and technical support zone in the past. After a decline from local highs, the price began to build a base in the 184,300–185,000 range, signaling potential absorption by stronger buyers.
Placing a buy limit at 184,800 allows traders to enter on a potential institutional reaction without chasing the price. If the market retests this area, we could see a reversal pattern and a rebound toward the highs.
Long!!

EUR/USD BEST PLACE TO BUY FROM|LONG
Hello, Friends!
We are now examining the EUR/USD pair and we can see that the pair is going down locally while also being in a downtrend on the 1W TF. But there is also a powerful signal from the BB lower band being nearby indicating that the pair is oversold so we can go long from the support line below and a target at 1.175 level.
Disclosure: I am part of Trade Nation's Influencer program and receive a monthly fee for using their TradingView charts in my analysis.
✅LIKE AND COMMENT MY IDEAS✅

USDCHF: Growth & Bullish Forecast
It is essential that we apply multitimeframe technical analysis and there is no better example of why that is the case than the current USDCHF chart which, if analyzed properly, clearly points in the upward direction.
Disclosure: I am part of Trade Nation's Influencer program and receive a monthly fee for using their TradingView charts in my analysis.
❤️ Please, support our work with like & comment! ❤️

AUDNZD: Will Keep Growing! Here is Why:
The analysis of the AUDNZD chart clearly shows us that the pair is finally about to go up due to the rising pressure from the buyers.
❤️ Please, support our work with like & comment! ❤️

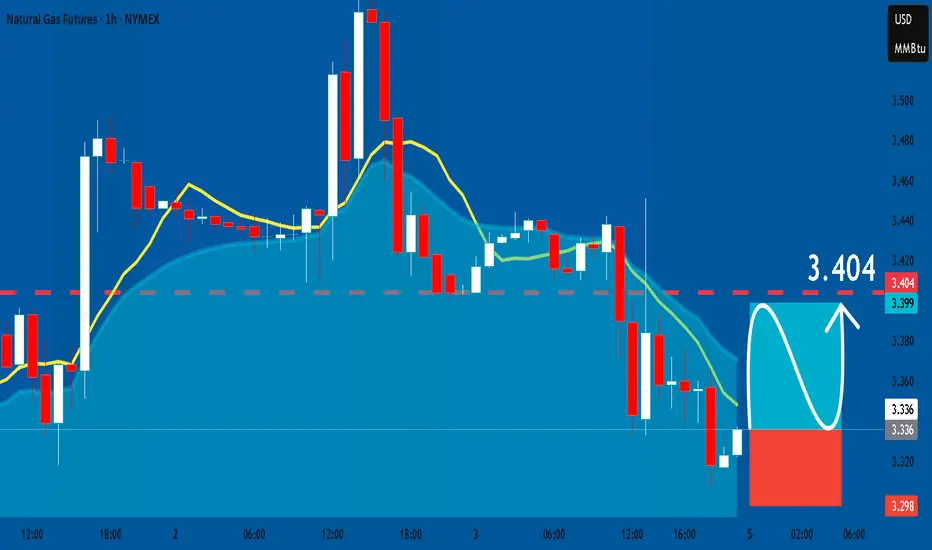
NATGAS: Long Signal Explained
NATGAS
- Classic bullish formation
- Our team expects pullback
SUGGESTED TRADE:
Swing Trade
Long NATGAS
Entry - 3.336
Sl - 3.298
Tp - 3.404
Our Risk - 1%
Start protection of your profits from lower levels
Disclosure: I am part of Trade Nation's Influencer program and receive a monthly fee for using their TradingView charts in my analysis.
❤️ Please, support our work with like & comment! ❤️
XAUUSD Long: Path to 3975 After CorrectionHello, traders! The price auction for XAUUSD has been in a powerful and sustained bullish phase, with the market structure being clearly defined by a major ascending trend line. This uptrend has demonstrated significant strength, breaking through multiple key resistance levels such as the 3630 demand 2 and the 3820 demand 1 levels, confirming that buyers are in full control of the market.
Currently, after reaching a new high, the price has entered a corrective phase. This pullback is guiding the auction down towards the major ascending trend line that has been the backbone of this entire upward move. This area represents a critical test of the trend's integrity and a key zone for buyers to show their initiative.
My scenario for the development of events is a continuation of the primary uptrend. I believe that this correction is a healthy pullback and an opportunity for buyers to re-enter at a value area. In my opinion, the price will find strong support on the ascending trend line, leading to a reversal and the start of the next impulsive wave higher. The take-profit is therefore set at 3975. Manage your risk.

NZDUSD Will Go Higher From Support! Buy!
Please, check our technical outlook for NZDUSD.
Time Frame: 1D
Current Trend: Bullish
Sentiment: Oversold (based on 7-period RSI)
Forecast: Bullish
The market is approaching a significant support area 0.583.
The underlined horizontal cluster clearly indicates a highly probable bullish movement with target 0.594 level.
P.S
Please, note that an oversold/overbought condition can last for a long time, and therefore being oversold/overbought doesn't mean a price rally will come soon, or at all.
Like and subscribe and comment my ideas if you enjoy them!

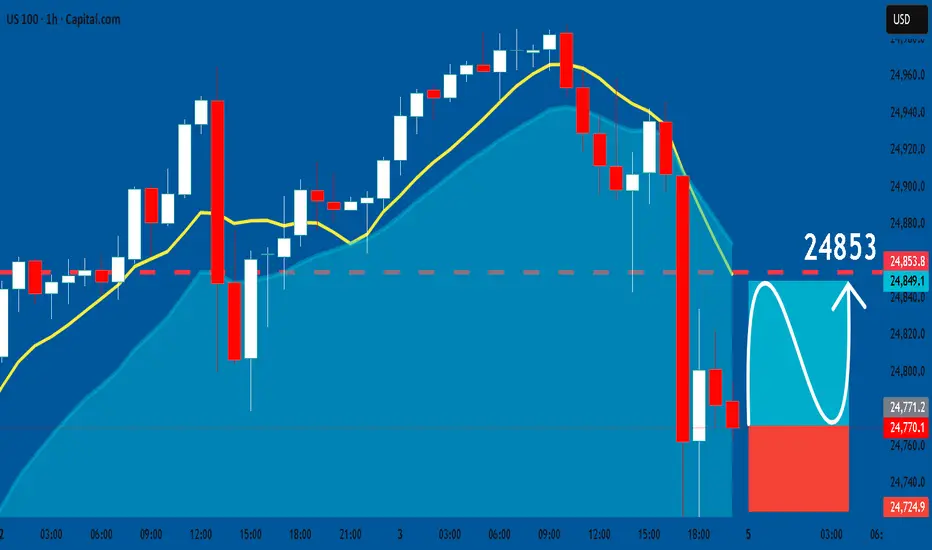
US100: Long Signal with Entry/SL/TP
US100
- Classic bullish pattern
- Our team expects retracement
SUGGESTED TRADE:
Swing Trade
Buy US100
Entry - 24770
Stop - 24724
Take - 24853
Our Risk - 1%
Start protection of your profits from lower levels
Disclosure: I am part of Trade Nation's Influencer program and receive a monthly fee for using their TradingView charts in my analysis.
❤️ Please, support our work with like & comment! ❤️
EURUSD Long: Awaiting Bullish Breakout from PennantHello, traders! The price auction for EURUSD has been in a corrective phase, which has taken the form of a large downward pennant. This bullish reversal pattern has been defined by a series of complex lower highs and lower lows, with the price consolidating between the descending supply line and the demand line near the 1.1715 demand level.
Currently, the auction is at a critical inflection point, trading at the apex of this pennant where the supply and demand lines converge. The price has found support near the 1.1715 demand zone, and after a complex series of moves, is now challenging the immediate overhead resistance. This compression of volatility indicates a significant breakout is imminent.
My scenario for the development of events is a bullish resolution of this downward pennant. I expect the price to make an impulsive move and break out above the descending supply line. In my opinion, this breakout will have enough momentum to carry the price up to the major horizontal supply zone. The take-profit is therefore set at the 1.1815 supply level. Manage your risk!

BTCUSD Long: Path to 123000 After BreakoutHello, traders! The prior market structure for BTCUSD saw a significant reversal after the price broke out of a descending channel. This shifted control to buyers and led to a prolonged consolidation phase, with the price auction building a range between the demand zone 2 near 109700 and the supply zone around the 117000 level.
Currently, this long period of balance has been resolved with a decisive breakout. A strong bullish initiative from the demand zone 2 has propelled BTCUSD above the 117000 supply level and out of the consolidation range. The market is now in a clear bullish expansion phase after breaking this key structural point.
My scenario for the development of events is a classic breakout and retest. I expect the price to make a corrective pullback to test the former resistance at the 117000 - 118000 supply zone as new support. In my opinion, a successful bounce from this zone would confirm the breakout's validity and trigger the next impulsive wave higher. The take-profit is therefore set at 123000. Manage your risk.

BITCOIN Will Go Higher From Support! Long!
Here is our detailed technical review for BITCOIN.
Time Frame: 1D
Current Trend: Bullish
Sentiment: Oversold (based on 7-period RSI)
Forecast: Bullish
The market is on a crucial zone of demand 122,787.24.
The oversold market condition in a combination with key structure gives us a relatively strong bullish signal with goal 130,283.78 level.
P.S
The term oversold refers to a condition where an asset has traded lower in price and has the potential for a price bounce.
Overbought refers to market scenarios where the instrument is traded considerably higher than its fair value. Overvaluation is caused by market sentiments when there is positive news.
Like and subscribe and comment my ideas if you enjoy them!

EURNZD Will Go Higher! Long!
Please, check our technical outlook for EURNZD.
Time Frame: 3h
Current Trend: Bullish
Sentiment: Oversold (based on 7-period RSI)
Forecast: Bullish
The market is trading around a solid horizontal structure 2.013.
The above observations make me that the market will inevitably achieve 2.019 level.
P.S
Overbought describes a period of time where there has been a significant and consistent upward move in price over a period of time without much pullback.
Like and subscribe and comment my ideas if you enjoy them!

Long AplleJust Buy / This is new wave .
According to the chart we are in a new Rally.
so clear to goal.

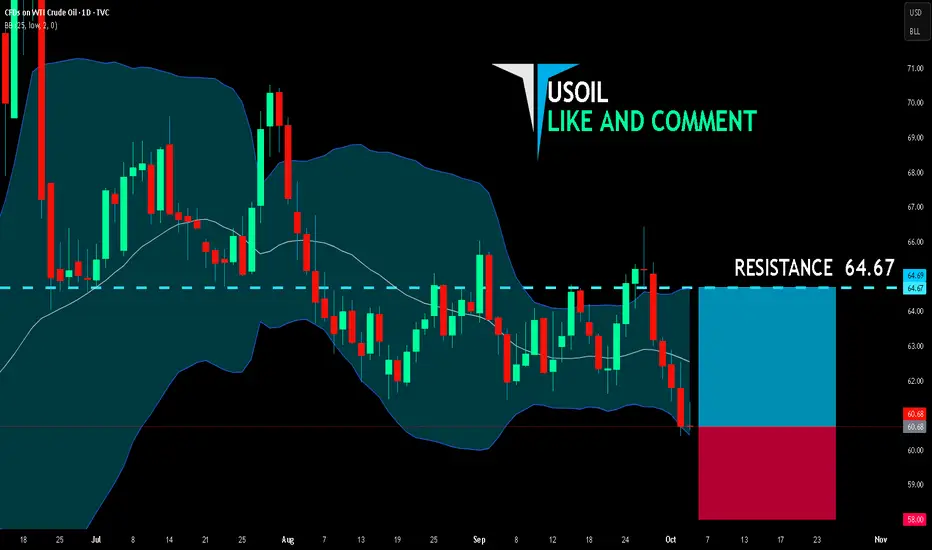
USOIL LONG FROM SUPPORT
USOIL SIGNAL
Trade Direction: long
Entry Level: 60.68
Target Level: 64.67
Stop Loss: 58.00
RISK PROFILE
Risk level: medium
Suggested risk: 1%
Timeframe: 1D
Disclosure: I am part of Trade Nation's Influencer program and receive a monthly fee for using their TradingView charts in my analysis.
✅LIKE AND COMMENT MY IDEAS✅
EUR/CHF SENDS CLEAR BULLISH SIGNALS|LONG
Hello, Friends!
It makes sense for us to go long on EUR/CHF right now from the support line below with the target of 0.935 because of the confluence of the two strong factors which are the general uptrend on the previous 1W candle and the oversold situation on the lower TF determined by it’s proximity to the lower BB band.
Disclosure: I am part of Trade Nation's Influencer program and receive a monthly fee for using their TradingView charts in my analysis.
✅LIKE AND COMMENT MY IDEAS✅

EURGBP: Bullish Continuation & Long Signal
EURGBP
- Classic bullish setup
- Our team expects bullish continuation
SUGGESTED TRADE:
Swing Trade
Long EURGBP
Entry Point - 0.8707
Stop Loss - 0.8702
Take Profit - 0.8718
Our Risk - 1%
Start protection of your profits from lower levels
Disclosure: I am part of Trade Nation's Influencer program and receive a monthly fee for using their TradingView charts in my analysis.
❤️ Please, support our work with like & comment! ❤️

EURCHF What Next? BUY!
My dear friends,
EURCHF looks like it will make a good move, and here are the details:
The market is trading on 0.9336 pivot level.
Bias - Bullish
Technical Indicators: Supper Trend generates a clear long signal while Pivot Point HL is currently determining the overall Bullish trend of the market.
Goal - 0.9347
About Used Indicators:
Pivot points are a great way to identify areas of support and resistance, but they work best when combined with other kinds of technical analysis
Disclosure: I am part of Trade Nation's Influencer program and receive a monthly fee for using their TradingView charts in my analysis.
———————————
WISH YOU ALL LUCK

GBPUSD📈 GBP/USD | Daily Price Action, Liquidity & Execution Plan
Price has already delivered into and rebalanced the Daily IFVG, completing that inefficiency. With that objective met, my focus is now on the next Daily FVG (D2), where price is currently reacting.
Liquidity Narrative
• ✅ Daily IFVG already rebalanced → inefficiency corrected.
• 🔜 Price expected to trade through FVG D2, rebalancing it and turning it into an IFVG.
• 💧 Next draw on liquidity: Buy-Side Liquidity (BSL) above recent highs.
• 🎯 Higher-timeframe liquidity target → blue Daily IFVG, sitting in premium territory with confluence of resting liquidity.
Execution Plan
• Looking for LTF confirmation entries (M15/H1) inside the Daily FVG (D2).
• Ideal setup: liquidity sweep of intraday highs (BSL) → displacement into the FVG zone → refined entry.
• Partial profits at BSL; main target at blue Daily IFVG.
Risk Management
• Invalidation if price breaks below the prior swing low that created the displacement into FVG D2.
• Risk kept tight, only engaging if confirmation aligns with narrative.
• No setup, no trade — patience until price delivers.
📌 Bias: Bullish order flow, with price seeking liquidity above until higher IFVG is satisfied.

AUDNZD: Bullish Continuation
Looking at the chart of AUDNZD right now we are seeing some interesting price action on the lower timeframes. Thus a local move up seems to be quite likely.
Disclosure: I am part of Trade Nation's Influencer program and receive a monthly fee for using their TradingView charts in my analysis.
❤️ Please, support our work with like & comment! ❤️

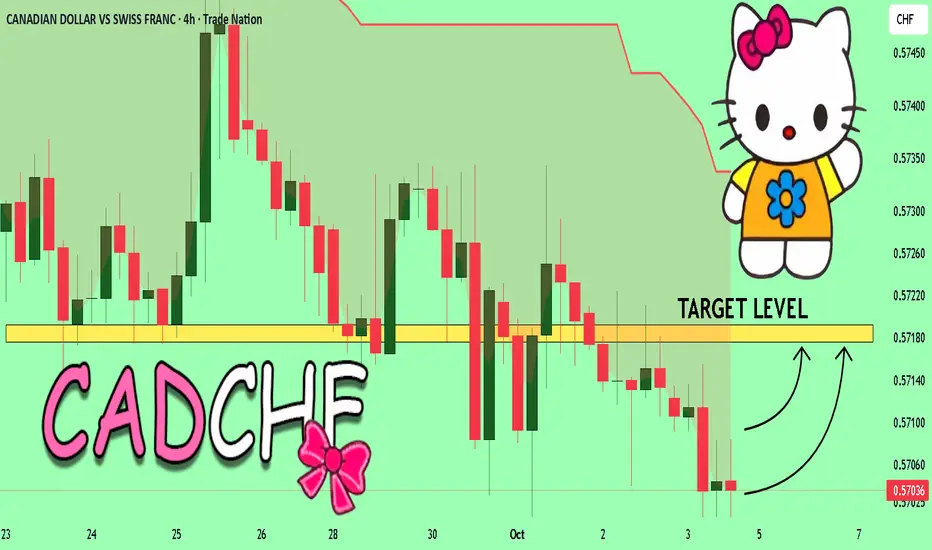
CADCHF My Opinion! BUY!
My dear subscribers,
This is my opinion on the CADCHF next move:
The instrument tests an important psychological level 0.5705
Bias - Bullish
Technical Indicators: Supper Trend gives a precise Bullish signal, while Pivot Point HL predicts price changes and potential reversals in the market.
Target - 0.5717
About Used Indicators:
On the subsequent day, trading above the pivot point is thought to indicate ongoing bullish sentiment, while trading below the pivot point indicates bearish sentiment.
Disclosure: I am part of Trade Nation's Influencer program and receive a monthly fee for using their TradingView charts in my analysis.
———————————
WISH YOU ALL LUCK
GBPCAD Is Very Bullish! Buy!
Here is our detailed technical review for GBPCAD.
Time Frame: 1D
Current Trend: Bullish
Sentiment: Oversold (based on 7-period RSI)
Forecast: Bullish
The market is on a crucial zone of demand 1.878.
The oversold market condition in a combination with key structure gives us a relatively strong bullish signal with goal 1.901 level.
P.S
Overbought describes a period of time where there has been a significant and consistent upward move in price over a period of time without much pullback.
Like and subscribe and comment my ideas if you enjoy them!


EURUSD Trading Opportunity! BUY!
My dear friends,
EURUSD looks like it will make a good move, and here are the details:
The market is trading on 1.1675 pivot level.
Bias - Bullish
Technical Indicators: Supper Trend generates a clear long signal while Pivot Point HL is currently determining the overall Bullish trend of the market.
Goal - 1.1738
About Used Indicators:
Pivot points are a great way to identify areas of support and resistance, but they work best when combined with other kinds of technical analysis
Disclosure: I am part of Trade Nation's Influencer program and receive a monthly fee for using their TradingView charts in my analysis.
———————————
WISH YOU ALL LUCK
