EUR/CHF LONG FROM SUPPORT
Hello, Friends!
EUR/CHF pair is trading in a local downtrend which we know by looking at the previous 1W candle which is red. On the 3H timeframe the pair is going down too. The pair is oversold because the price is close to the lower band of the BB indicator. So we are looking to buy the pair with the lower BB line acting as support. The next target is 0.935 area.
Disclosure: I am part of Trade Nation's Influencer program and receive a monthly fee for using their TradingView charts in my analysis.
✅LIKE AND COMMENT MY IDEAS✅
Long!!

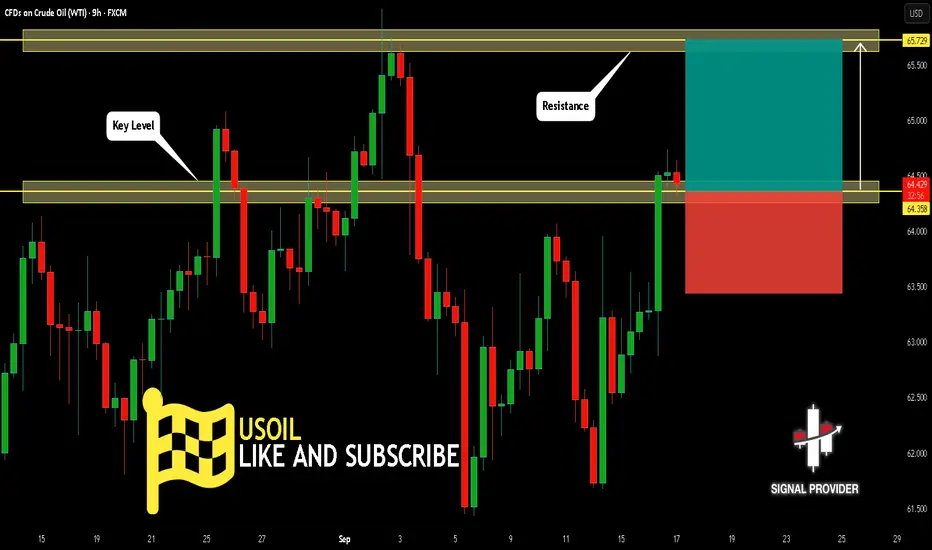
USOIL Will Grow! Long!
Take a look at our analysis for USOIL.
Time Frame: 9h
Current Trend: Bullish
Sentiment: Oversold (based on 7-period RSI)
Forecast: Bullish
The price is testing a key support 64.358.
Current market trend & oversold RSI makes me think that buyers will push the price. I will anticipate a bullish movement at least to 65.729 level.
P.S
We determine oversold/overbought condition with RSI indicator.
When it drops below 30 - the market is considered to be oversold.
When it bounces above 70 - the market is considered to be overbought.
Like and subscribe and comment my ideas if you enjoy them!
GBPCHF Will Go Up! Buy!
Take a look at our analysis for GBPCHF.
Time Frame: 3h
Current Trend: Bullish
Sentiment: Oversold (based on 7-period RSI)
Forecast: Bullish
The market is approaching a key horizontal level 1.073.
Considering the today's price action, probabilities will be high to see a movement to 1.077.
P.S
The term oversold refers to a condition where an asset has traded lower in price and has the potential for a price bounce.
Overbought refers to market scenarios where the instrument is traded considerably higher than its fair value. Overvaluation is caused by market sentiments when there is positive news.
Like and subscribe and comment my ideas if you enjoy them!

USDCHF My Opinion! BUY!
My dear subscribers,
My technical analysis for USDCHF is below:
The price is coiling around a solid key level - 0.7863
Bias - Bullish
Technical Indicators: Pivot Points Low anticipates a potential price reversal.
Super trend shows a clear buy, giving a perfect indicators' convergence.
Goal - 0.7911
About Used Indicators:
By the very nature of the supertrend indicator, it offers firm support and resistance levels for traders to enter and exit trades. Additionally, it also provides signals for setting stop losses
Disclosure: I am part of Trade Nation's Influencer program and receive a monthly fee for using their TradingView charts in my analysis.
———————————
WISH YOU ALL LUCK

EURCHF Set To Grow! BUY!
My dear followers,
This is my opinion on the EURCHF next move:
The asset is approaching an important pivot point 0.9332
Bias - Bullish
Safe Stop Loss - 0.9327
Technical Indicators: Supper Trend generates a clear long signal while Pivot Point HL is currently determining the overall Bullish trend of the market.
Goal - 0.9340
About Used Indicators:
For more efficient signals, super-trend is used in combination with other indicators like Pivot Points.
Disclosure: I am part of Trade Nation's Influencer program and receive a monthly fee for using their TradingView charts in my analysis.
———————————
WISH YOU ALL LUCK

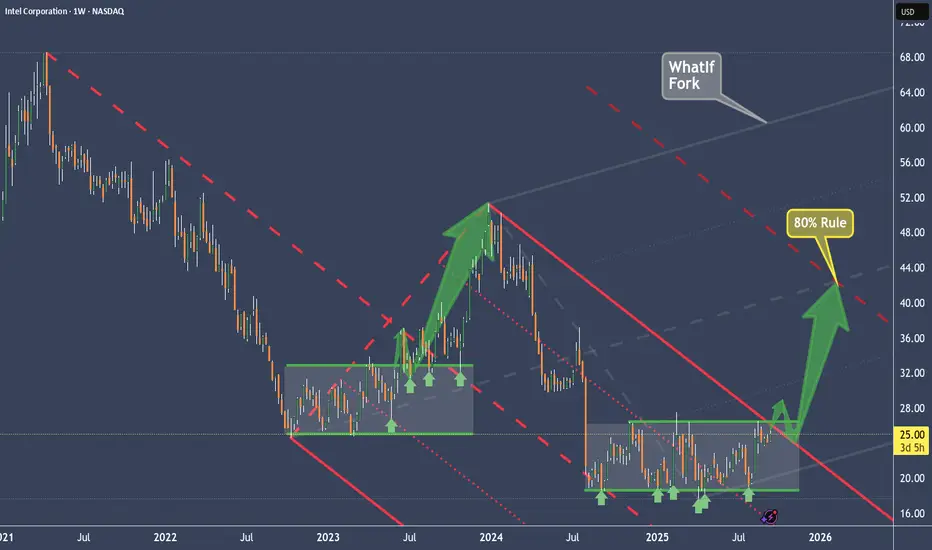
Intel (INTC) silent accumulation pattern and projection of priceThe last time INTC broke out of its sideways range, it re-tested support three times.
After that, price surged upward, pulled back to the Centerline (an 80% probability move), and then began accumulating again within a sideways coil — or “Battery,” as I like to call it (see the TSLA example).
This setup looks similar now.
In fact, we even have a stronger filter: Price must first break out of the downsloping red Fork. Once that happens, we can expect a re-test of the upper median line (U-MLH). That’s the point where I decide whether or not to take a position.
My target is the Centerline of the grey “What If Fork.”
I want to emphasize that the inventor of the Forks highlighted this idea in his original course: always project and think, “What if…?” That’s exactly what I do — and maybe it will help you as well.
Let’s see if Intel’s “Battery” gives us a solid trade. §8-)
GME §8-)OK boys and girls – a little weekend fantasy for you (sneaky giggle 😏).
See those pink zones?
Notice what happened every time the market broke out there?
Now look at the whole width of those zones (highlighted in green).
What if that entire fat chunk is actually one giant buy zone? A monster pit where smart money is scooping up loads… quietly, secretly…? 🤔💸
Alright, enough daydreaming:
Don’t FOMO 🚫🐑
Have a happy weekend 😎🎉

GOLD: Bullish Continuation & Long Signal
GOLD
- Classic bullish formation
- Our team expects growth
SUGGESTED TRADE:
Swing Trade
Buy GOLD
Entry Level - 3689.9
Sl - 3686.7
Tp - 3696.0
Our Risk - 1%
Start protection of your profits from lower levels
Disclosure: I am part of Trade Nation's Influencer program and receive a monthly fee for using their TradingView charts in my analysis.
❤️ Please, support our work with like & comment! ❤️

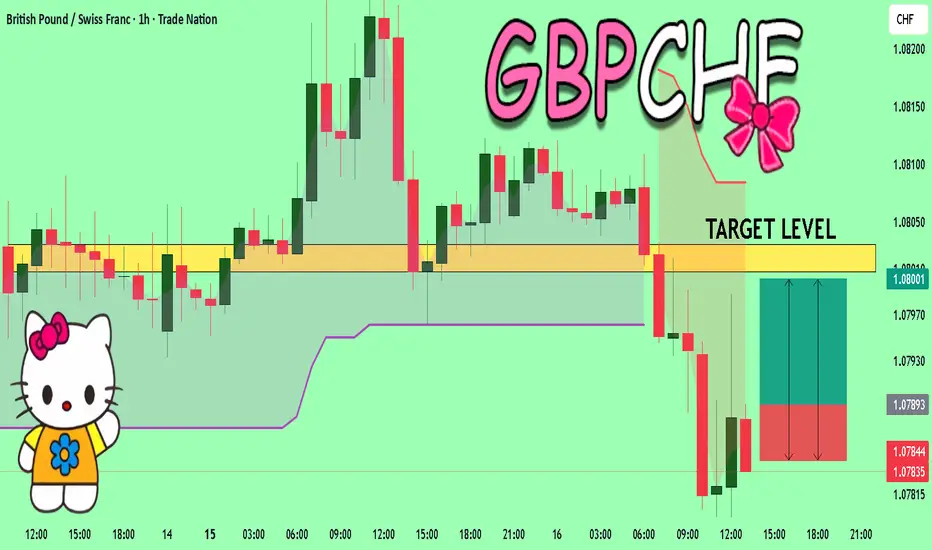
GBPCHF Will Explode! BUY!
My dear friends,
Please, find my technical outlook for GBPCHF below:
The instrument tests an important psychological level 1.0789
Bias - Bullish
Technical Indicators: Supper Trend gives a precise Bullish signal, while Pivot Point HL predicts price changes and potential reversals in the market.
Target - 1.0800
Recommended Stop Loss - 1.0784
About Used Indicators:
Super-trend indicator is more useful in trending markets where there are clear uptrends and downtrends in price.
Disclosure: I am part of Trade Nation's Influencer program and receive a monthly fee for using their TradingView charts in my analysis.
———————————
WISH YOU ALL LUCK
EUR/USD take-profit hit at 1.17902Move aligned perfectly with the dollar’s pre-news bullish push. Tight stops + volume confirmation = textbook execution.
On the sidelines now, waiting for the next setup.

EUR/AUD BULLS ARE GAINING STRENGTH|LONG
Hello, Friends!
We are targeting the 1.782 level area with our long trade on EUR/AUD which is based on the fact that the pair is oversold on the BB band scale and is also approaching a support line below thus going us a good entry option.
Disclosure: I am part of Trade Nation's Influencer program and receive a monthly fee for using their TradingView charts in my analysis.
✅LIKE AND COMMENT MY IDEAS✅

GOLD Will Move Higher! Long!
Please, check our technical outlook for GOLD.
Time Frame: 3h
Current Trend: Bullish
Sentiment: Oversold (based on 7-period RSI)
Forecast: Bullish
The market is approaching a significant support area 3,684.42.
The underlined horizontal cluster clearly indicates a highly probable bullish movement with target 3,743.94 level.
P.S
We determine oversold/overbought condition with RSI indicator.
When it drops below 30 - the market is considered to be oversold.
When it bounces above 70 - the market is considered to be overbought.
Like and subscribe and comment my ideas if you enjoy them!

GBPUSD Is Going Up! Buy!
Please, check our technical outlook for GBPUSD.
Time Frame: 1h
Current Trend: Bullish
Sentiment: Oversold (based on 7-period RSI)
Forecast: Bullish
The market is trading around a solid horizontal structure 1.361.
The above observations make me that the market will inevitably achieve 1.365 level.
P.S
The term oversold refers to a condition where an asset has traded lower in price and has the potential for a price bounce.
Overbought refers to market scenarios where the instrument is traded considerably higher than its fair value. Overvaluation is caused by market sentiments when there is positive news.
Like and subscribe and comment my ideas if you enjoy them!

DOGUSDT: Potential Reversal at Key Level in Rising ChannelHey everyone, Ken here!
Right now, I'm closely watching DOGUSDT and it seems like it might be going through a correction phase as the price tests the lower boundary of the rising channel. This is a key level, and if the price bounces from here, I believe it could continue towards the next target around 0.3200.
However, if the price breaks below this support, the bullish outlook would weaken, and we could see further declines. That’s why I always pay close attention to price action and trading volume to identify solid buying opportunities.
Risk management is essential in trading, so I always make sure to carefully confirm setups and trade with caution. What do you think about the current situation? Feel free to share your thoughts in the comments!

Long Term Btc PlanI can see BTC going to take 85k.
People think "Below 90k bull run is over"
Would cause extreme fear/panic in the markets if broken below 90k. basically reaching 85-86k would be cause just by paper hands at the end being scared out of their positions.
Currently Looking for bigger shorts and small longs only. Exception if BTC breaks above 118.5k and shows bullish signals.
Will look for reenter spot below 90/100k depends on situation.
Want to see Diamond Top playout on 4h, then break above it or reject from 786/886 fibb and enter big short to 105/90s.
The Long/Short Positions on chart is worth looking at, I have alerts near all entries/SL/Tp and even S/R.
I had a thought that next big crash might be caused by an exchange going tits up at near top, and I have intuition it might be MEXC.
NOT YOUR KEYS NOT YOUR ASSETS.

Dogecoin is about to blast off! Study internet bubble stocks.I believe Dogecoin will see a strong run all the way to a new all-time high. When you study other market cycles, like Apple during the internet bubble, you see the same story told over and over again with subtle differences. Watch for a big bull market ahead.
As always, stay profitable.
– Dalin Anderson

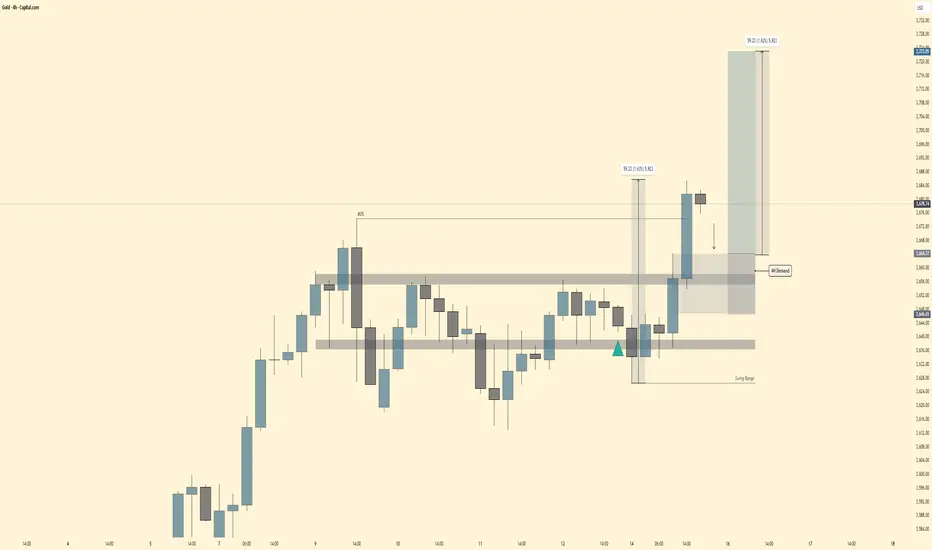
Gold Trade Setup🕰 Weekly Structure
Gold is still holding a bullish tone overall, with higher-timeframe demand zones supporting the structure. Momentum favors continuation as long as demand levels are respected.
📉 Daily View
Price recently broke structure (BOS) and confirmed buyers stepping in. The daily demand zone is aligned with the 4H block, adding confluence for bullish continuation.
⏱ 4H Breakdown
Price tapped into 4H demand around 3660–3670.
Clean rejection with a strong impulsive leg breaking above resistance.
Swing range remains intact with liquidity swept below before the move higher.
Upside target zone sits near 3730s, offering a solid risk-reward (around 1:6).
🔍 Outlook
Short-term pullbacks into 4H demand (3660–3680) = potential buy entries.
As long as demand holds, mid-term outlook remains bullish toward 3730+.
Failure to hold demand would re-open downside back into the swing range (~3640–3620).
Bias : ✅ Short-term pullback → Mid-term bullish continuation.
USDCHF: Long Trading Opportunity
USDCHF
- Classic bullish formation
- Our team expects pullback
SUGGESTED TRADE:
Swing Trade
Long USDCHF
Entry - 0.7950
Sl - 0.7946
Tp - 0.7960
Our Risk - 1%
Start protection of your profits from lower levels
Disclosure: I am part of Trade Nation's Influencer program and receive a monthly fee for using their TradingView charts in my analysis.
❤️ Please, support our work with like & comment! ❤️

EURUSD - 15-Minute Opportunity – Risk/Reward 2.22Guys, greetings
I’ve prepared an EURUSD analysis for you.
On my 15-minute chart:
🟢 Buy entry level: 1.17152
🔴 Stop level: 1.17002
🎯 TP1: 1.17206
🎯 TP2: 1.17287
🎯 TP3: 1.17480
Risk/reward ratio for this trade: 2.22
Guys, every single like you give is my biggest motivation to keep sharing these analyses.
Thank you to all my friends who support me with their likes and stand by my side.

EUR/USD - Trade Idea (Forecast Linked)🕰 Weekly View
Price is pushing away from major support at 1.14–1.15 and climbing into the 1.18–1.20 resistance zone. Weekly structure still favors upside momentum while support holds.
📉 Daily Structure
Resistance: 1.18–1.20 strong supply.
Support : 1.16–1.17 demand , with deeper discount demand sitting at 1.15–1.16.
Daily price action shows liquidity being swept both sides before a push higher.
⏱ 8H Breakdown
Price is reacting from unmitigated demand around 1.16–1.17. A wedge breakout is sending price toward resistance at 1.18–1.20. If rejected, look for retrace back into discount demand (1.15–1.16) before continuation.
🔎 Outlook
Scenario 1 → Sweep into 1.18–1.20 supply → retrace back into 1.15–1.16 discount demand → continuation higher.
Scenario 2 → Clean breakout above 1.20 accelerates toward 1.22+.
Bias : Short-term reaction lower possible → mid-term bullish continuation.

SOL Parabolic Run Despite the recent chop, when you zoom out to the 1D timeframe there is a clear pattern being followed since the April crash.
From the sub $100 low Solana has posted progressively higher lows in a parabolic fashion. The highs on the other hand are in more of a linear fashion as shown by the diagonal S/R level, at first it provided support and now since March it has been resistance.
So for me there are two possible actionable trades:
- Continuation of the parabolic move, this would include flipping the Diagonal S/R level, currently at time of writing this resistance level is being tested, a close above gives a better possibility of the rally continuing.
- The rally becomes exhausted and fails to flip the Diagonal S/R and loses the parabolic support level. Should this support break $185 is the first target (light green zone), $160 as the second target (dark green zone).
Important to remember we have CPI & FOMC rapidly approaching that could provide the volatility to trigger either of these moves, lets see what happens next.

EUR/USD - Moving into Buy movements🕰 Monthly View
Price is breaking out of the major support/resistance zone around 1.18–1.20 after years of compression. Historically, this level has acted as a turning point, and now momentum favors the upside. MACD confirms strength with a bullish cross, pointing to continuation.
📉 Weekly Structure
Resistance: Cleared at 1.20, room to expand higher.
Support: 1.10–1.12 base holds as long-term demand.
Macro structure now looks like a sustained breakout phase.
⏱ Daily / Lower-Timeframe Perspective
Price has been steadily pressing higher without significant supply above. The clean breakout above 1.18 suggests little resistance until much higher levels, leaving upside open.
🔎 Outlook
Bullish momentum dominates. As long as price holds above 1.18, continuation toward 1.30+ becomes likely. MACD divergence that held the downside has now shifted, fueling the upside breakout.
Bias : Strong bullish continuation → mid-to-long term upside toward 1.30+.

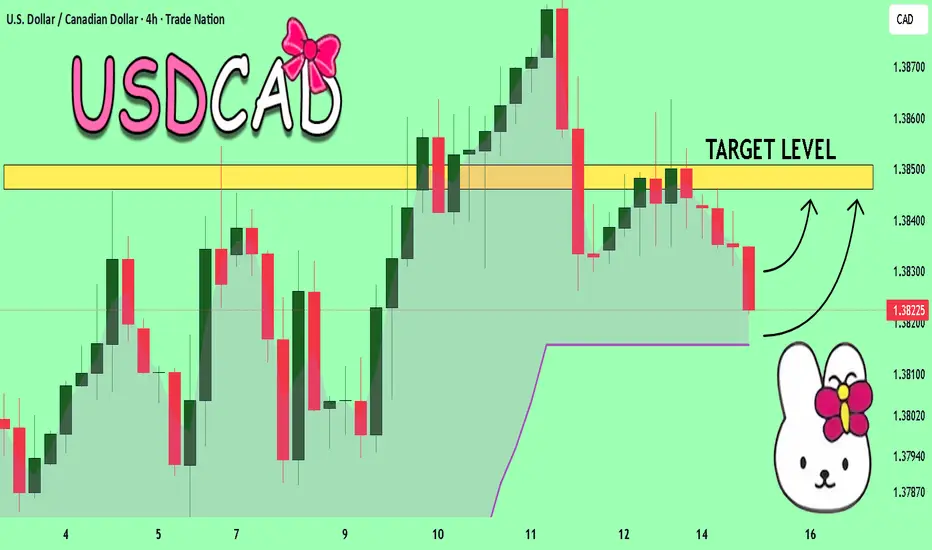
USDCAD The Target Is UP! BUY!
My dear subscribers,
This is my opinion on the USDCAD next move:
The instrument tests an important psychological level 1.3824
Bias - Bullish
Technical Indicators: Supper Trend gives a precise Bullish signal, while Pivot Point HL predicts price changes and potential reversals in the market.
Target - 1.3846
About Used Indicators:
On the subsequent day, trading above the pivot point is thought to indicate ongoing bullish sentiment, while trading below the pivot point indicates bearish sentiment.
Disclosure: I am part of Trade Nation's Influencer program and receive a monthly fee for using their TradingView charts in my analysis.
———————————
WISH YOU ALL LUCK