CADJPY Will Go Up! Long!
Please, check our technical outlook for CADJPY.
Time Frame: 3h
Current Trend: Bullish
Sentiment: Oversold (based on 7-period RSI)
Forecast: Bullish
The market is trading around a solid horizontal structure 111.244.
The above observations make me that the market will inevitably achieve 112.283 level.
P.S
Overbought describes a period of time where there has been a significant and consistent upward move in price over a period of time without much pullback.
Like and subscribe and comment my ideas if you enjoy them!
Long!!

GOLD What Next? BUY!
My dear subscribers,
This is my opinion on the GOLD next move:
The instrument tests an important psychological level 4066.7
Bias - Bullish
Technical Indicators: Supper Trend gives a precise Bullish signal, while Pivot Point HL predicts price changes and potential reversals in the market.
Target - 4082.3
My Stop Loss - 4057.6
About Used Indicators:
On the subsequent day, trading above the pivot point is thought to indicate ongoing bullish sentiment, while trading below the pivot point indicates bearish sentiment.
Disclosure: I am part of Trade Nation's Influencer program and receive a monthly fee for using their TradingView charts in my analysis.
———————————
WISH YOU ALL LUCK

USD/CHF BULLS ARE GAINING STRENGTH|LONG
Hello, Friends!
USD/CHF is trending up which is clear from the green colour of the previous weekly candle. However, the price has locally plunged into the oversold territory. Which can be told from its proximity to the BB lower band. Which presents a classical trend following opportunity for a long trade from the support line below towards the supply level of 0.806.
Disclosure: I am part of Trade Nation's Influencer program and receive a monthly fee for using their TradingView charts in my analysis.
✅LIKE AND COMMENT MY IDEAS✅

USOIL: Bullish Continuation
It is essential that we apply multitimeframe technical analysis and there is no better example of why that is the case than the current USOIL chart which, if analyzed properly, clearly points in the upward direction.
Disclosure: I am part of Trade Nation's Influencer program and receive a monthly fee for using their TradingView charts in my analysis.
❤️ Please, support our work with like & comment! ❤️
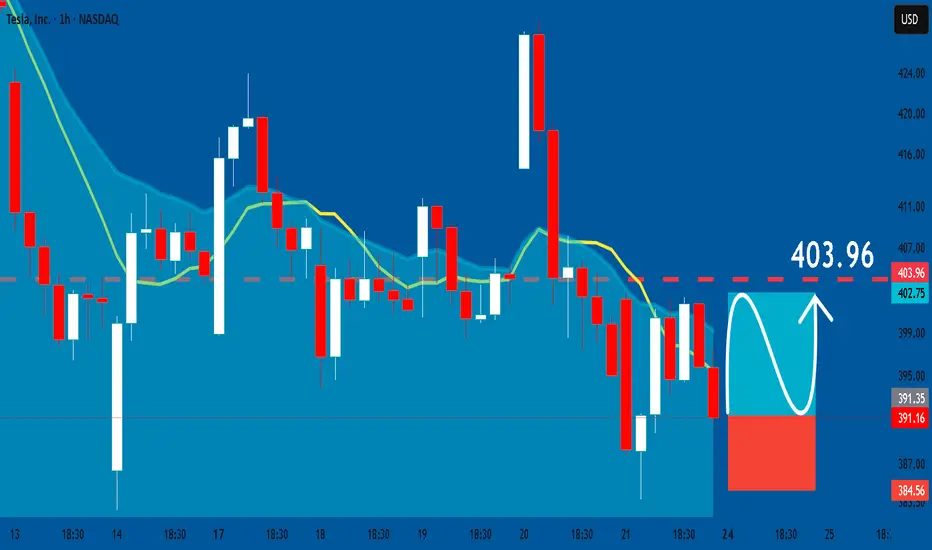
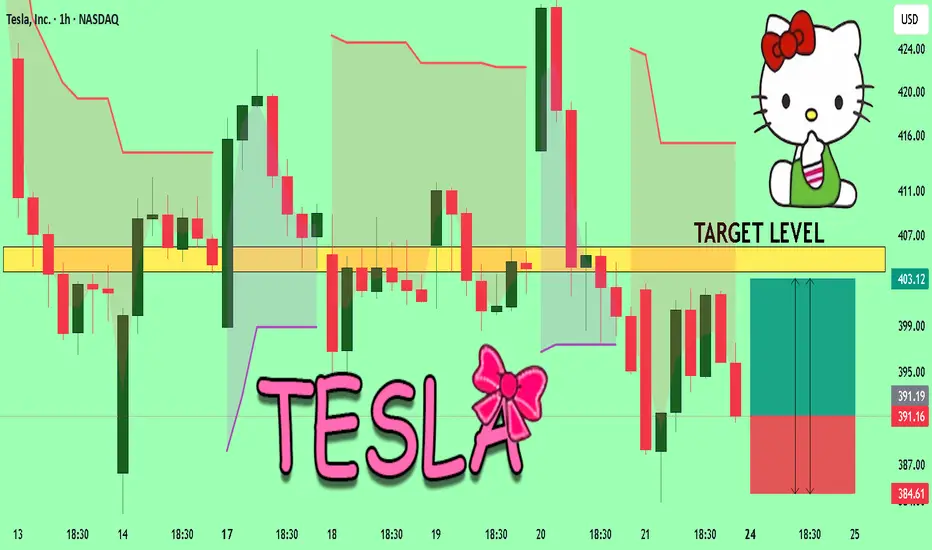
TESLA: Long Signal Explained
TESLA
- Classic bullish pattern
- Our team expects retracement
SUGGESTED TRADE:
Swing Trade
Buy TESLA
Entry - 391.16
Stop - 384.56
Take - 403.96
Our Risk - 1%
Start protection of your profits from lower levels
Disclosure: I am part of Trade Nation's Influencer program and receive a monthly fee for using their TradingView charts in my analysis.
❤️ Please, support our work with like & comment! ❤️
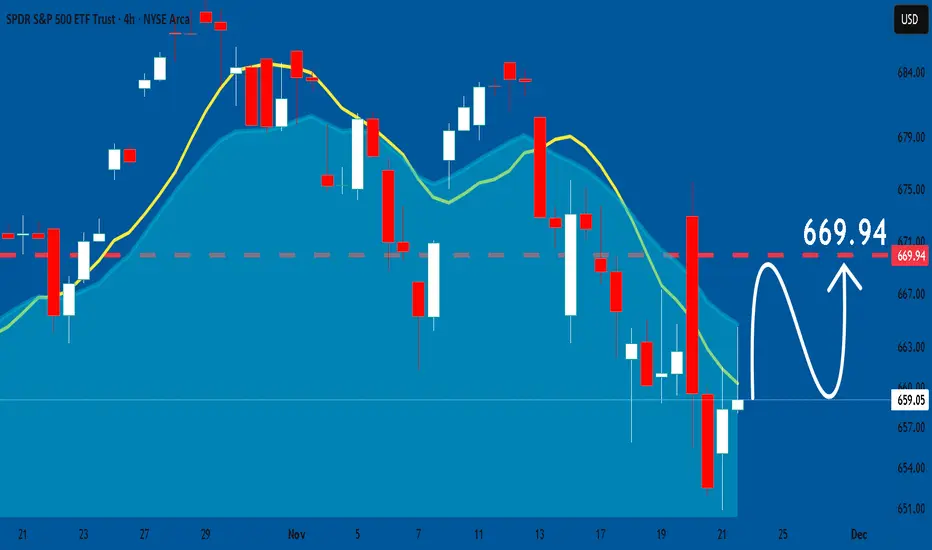
SPY Set To Grow! BUY!
My dear subscribers,
My technical analysis for SPY is below:
The price is coiling around a solid key level - 659.05
Bias - Bullish
Technical Indicators: Pivot Points Low anticipates a potential price reversal.
Super trend shows a clear buy, giving a perfect indicators' convergence.
Goal - 669.74
About Used Indicators:
By the very nature of the supertrend indicator, it offers firm support and resistance levels for traders to enter and exit trades. Additionally, it also provides signals for setting stop losses
Disclosure: I am part of Trade Nation's Influencer program and receive a monthly fee for using their TradingView charts in my analysis.
———————————
WISH YOU ALL LUCK

Light crude oil On oil, I like two levels for trade, one is short from the approximate price of 66.3, where a deviation above the high could be created, and the close fibo level of 0.5 adds to the confluence, and the daily level on the long, I would like a drop at least below the value low around the price level of 57.46, where the daily level is also nearby

XAUUSD: Price Holds Triangle Support, Aiming for $4,120Hello everyone, here is my breakdown of the current Gold setup.
Market Analysis
XAUUSD is trading within a broad symmetrical triangle structure, where price continues to respect both the Triangle Resistance Line and the Triangle Support Line. After a strong bullish rally inside the Upward Channel earlier, Gold reached the Resistance Area around $4,120–$4,130, where a sharp reversal occurred. This zone has consistently acted as a major supply level, triggering multiple corrections in recent sessions. Following the breakout below the Upward Channel, XAUUSD entered a consolidation phase supported by the Support Zone near $4,000, which aligns with the lower triangle boundary. This level has proven to be a key reaction zone, showing strong buyer interest each time price tested it.
Currently, Gold attempted another bullish push after bouncing from the Triangle Support Line. Price is now approaching the Resistance Area once again, but buyers face strong selling pressure around $4,080–$4,120, which overlaps with both horizontal resistance and the descending triangle boundary. A break and close above the Triangle Resistance Line would confirm bullish continuation and likely lead to a retest of higher liquidity levels near $4,180–$4,200. As long as XAUUSD stays above the $4,000 Support Zone, the broader structure remains bullish. However, sustained failure to break the resistance area may result in another corrective move back toward the Triangle Support Line.
My Scenario & Strategy
From my perspective, as long as Gold holds above $4,000, the bullish bias remains intact.
My near-term target (TP1) is the $4,120 Resistance Area, with potential extension toward $4,160–$4,200 if buyers manage a clean breakout above the triangle resistance. I will look for long entries on pullbacks toward the Triangle Support Line or the Support Zone around $4,000–$4,020, especially if bullish rejection patterns appear.
If XAUUSD breaks below the $4,000 level, the bullish setup becomes invalid and deeper correction toward $3,960–$3,920 may follow. For now, price action favors a bullish continuation setup, provided support continues to hold.
That's the setup I'm tracking. Thank you for your attention, and always manage your risk.

BTCUSD Channel Support Holds as Price Targets $85K PullbackHello traders! Let’s break down the current BTCUSD market structure. Bitcoin is trading inside a well-defined descending channel, forming consistent lower highs and lower lows. This structure confirms that the market is still moving within a broader bearish trend. Earlier, BTC created a large range phase on the left side of the chart, showing indecision before breaking down and starting the current downtrend. Each approach to the upper trendline (Resistance Line) resulted in a clear turnaround, proving that sellers continue to defend this zone aggressively. During the recent decline, BTC made multiple corrections inside the channel, but every upward move was short-lived and rejected by the descending resistance. A recent breakout attempt failed, and price quickly returned back into the channel, signaling that bullish momentum remains weak. Currently, Bitcoin is testing the Support Line of the descending channel near the $81,400–$82,000 zone. This level has acted as a key demand area within the trend. A short-term bounce from support is possible, and the chart shows a projected move toward TP1 near $85,000, which aligns with a minor internal resistance level. However, as long as BTC trades below the major Resistance Level around $94,000 and within the descending channel, the market maintains a bearish bias. Any bullish recovery is likely to be limited unless price can break above the channel and secure structure above $94,000. Please share this idea with your friends and click Boost 🚀

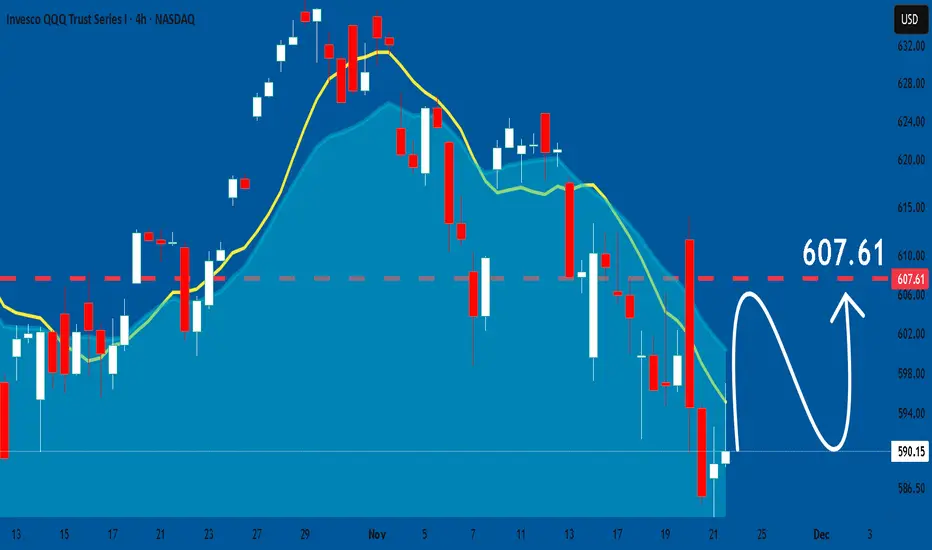
QQQ: Growth & Bullish Forecast
The analysis of the QQQ chart clearly shows us that the pair is finally about to go up due to the rising pressure from the buyers.
❤️ Please, support our work with like & comment! ❤️
SPY: Will Start Growing! Here is Why:
Looking at the chart of SPY right now we are seeing some interesting price action on the lower timeframes. Thus a local move up seems to be quite likely.
Disclosure: I am part of Trade Nation's Influencer program and receive a monthly fee for using their TradingView charts in my analysis.
❤️ Please, support our work with like & comment! ❤️
EURUSD: Long Signal with Entry/SL/TP
EURUSD
- Classic bullish setup
- Our team expects bullish continuation
SUGGESTED TRADE:
Swing Trade
Long EURUSD
Entry Point - 1.1515
Stop Loss - 1.1509
Take Profit - 1.1527
Our Risk - 1%
Start protection of your profits from lower levels
Disclosure: I am part of Trade Nation's Influencer program and receive a monthly fee for using their TradingView charts in my analysis.
❤️ Please, support our work with like & comment! ❤️

TESLA Will Explode! BUY!
My dear friends,
My technical analysis for TESLA is below:
The market is trading on 391.16 pivot level.
Bias - Bullish
Technical Indicators: Both Super Trend & Pivot HL indicate a highly probable Bullish continuation.
Target - 403.74
Recommended Stop Loss - 384.61
About Used Indicators:
A pivot point is a technical analysis indicator, or calculations, used to determine the overall trend of the market over different time frames.
Disclosure: I am part of Trade Nation's Influencer program and receive a monthly fee for using their TradingView charts in my analysis.
———————————
WISH YOU ALL LUCK
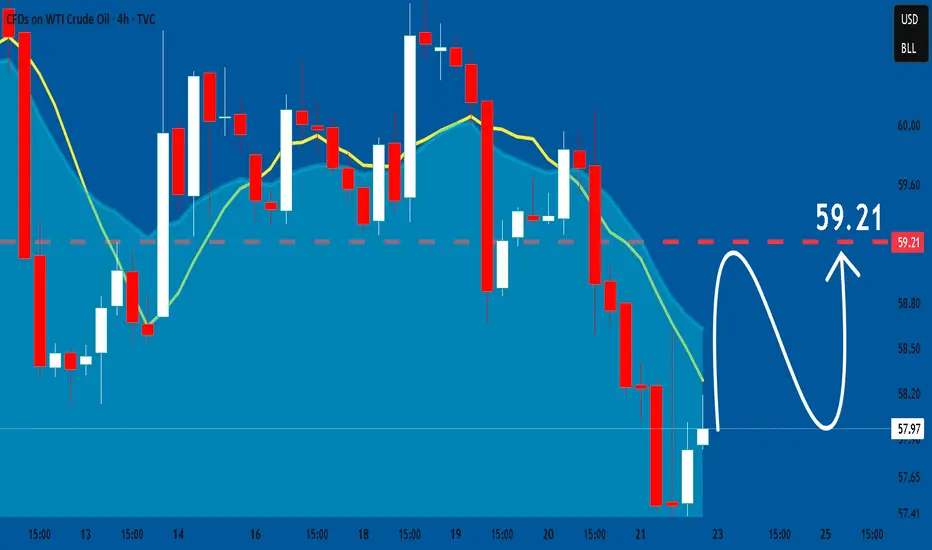
USOIL The Target Is UP! BUY!
My dear friends,
USOIL looks like it will make a good move, and here are the details:
The market is trading on 57.97 pivot level.
Bias - Bullish
Technical Indicators: Supper Trend generates a clear long signal while Pivot Point HL is currently determining the overall Bullish trend of the market.
Goal - 58.98
About Used Indicators:
Pivot points are a great way to identify areas of support and resistance, but they work best when combined with other kinds of technical analysis
Disclosure: I am part of Trade Nation's Influencer program and receive a monthly fee for using their TradingView charts in my analysis.
———————————
WISH YOU ALL LUCK

BITCOIN BULLISH BIAS RIGHT NOW| LONG
BITCOIN SIGNAL
Trade Direction: long
Entry Level: 84,546.32
Target Level: 101,066.22
Stop Loss: 73,559.02
RISK PROFILE
Risk level: medium
Suggested risk: 1%
Timeframe: 1D
Disclosure: I am part of Trade Nation's Influencer program and receive a monthly fee for using their TradingView charts in my analysis.
✅LIKE AND COMMENT MY IDEAS✅

CHFJPY Sellers In Panic! BUY!
My dear followers,
This is my opinion on the CHFJPY next move:
The asset is approaching an important pivot point 194.37
Bias - Bullish
Safe Stop Loss - 194.13
Technical Indicators: Supper Trend generates a clear long signal while Pivot Point HL is currently determining the overall Bullish trend of the market.
Goal - 194.80
About Used Indicators:
For more efficient signals, super-trend is used in combination with other indicators like Pivot Points.
Disclosure: I am part of Trade Nation's Influencer program and receive a monthly fee for using their TradingView charts in my analysis.
———————————
WISH YOU ALL LUCK

Potential Downside Short-term - Long Term EntriesCOINBASE:BTCUSD has broken below the ascending channel that has held for several months, indicating a possible shift in momentum from bullish to bearish. BITSTAMP:BTCUSD is overbought on the RSI and broke below it's 200-day EMA as well. I'll certainly be adding to my long-term position on the way down and will likely grab a long position at some point- will post an update then. Until then, some RSI-based supply and demand zones to keep an eye on, watching closely

GBPUSD: Bullish Continuation is Highly Probable! Here is Why:
Remember that we can not, and should not impose our will on the market but rather listen to its whims and make profit by following it. And thus shall be done today on the GBPUSD pair which is likely to be pushed up by the bulls so we will buy!
Disclosure: I am part of Trade Nation's Influencer program and receive a monthly fee for using their TradingView charts in my analysis.
❤️ Please, support our work with like & comment! ❤️

GOLD: Bullish Continuation & Long Signal
GOLD
- Classic bullish formation
- Our team expects growth
SUGGESTED TRADE:
Swing Trade
Buy GOLD
Entry Level - 4037.7
Sl - 4028.4
Tp - 4056.7
Our Risk - 1%
Start protection of your profits from lower levels
Disclosure: I am part of Trade Nation's Influencer program and receive a monthly fee for using their TradingView charts in my analysis.
❤️ Please, support our work with like & comment! ❤️

EURUSD Massive Long! BUY!
My dear friends,
Please, find my technical outlook for EURUSD below:
The price is coiling around a solid key level - 1.1516
Bias - Bullish
Technical Indicators: Pivot Points High anticipates a potential price reversal.
Super trend shows a clear buy, giving a perfect indicators' convergence.
Goal - 1.1554
About Used Indicators:
The pivot point itself is simply the average of the high, low and closing prices from the previous trading day.
Disclosure: I am part of Trade Nation's Influencer program and receive a monthly fee for using their TradingView charts in my analysis.
———————————
WISH YOU ALL LUCK

AUDJPY Technical Analysis! BUY!
My dear friends,
Please, find my technical outlook for AUDJPY below:
The instrument tests an important psychological level 100.72
Bias - Bullish
Technical Indicators: Supper Trend gives a precise Bullish signal, while Pivot Point HL predicts price changes and potential reversals in the market.
Target - 101.32
Recommended Stop Loss - 100.45
About Used Indicators:
Super-trend indicator is more useful in trending markets where there are clear uptrends and downtrends in price.
Disclosure: I am part of Trade Nation's Influencer program and receive a monthly fee for using their TradingView charts in my analysis.
———————————
WISH YOU ALL LUCK

If Nasdaq can crack the pressure line then...🔱 We have a Hagopian on the down-move. 🔱
Price was (so far) not able to reach the L-MLH of the red fork.
If buyers can eat through the pressure cheese, then the Long-Play is on.
Most often we see price breaking the pressure line and then coming back to it, scaring out the early longs, just to rush upwards again. So don’t panic if this happens. Place a proper stop and you're good.
As for targets, there is the red Centerline and the white Centerline.
On a break of the red CL, we have a high chance to see the same scenario as with the pressure line: UP-Down-MoreUp.
First snow in Switzerland arrived and Santa is preparing the reindeer to bring us some dough ;-)
Wish you all a profitable Friday.

GBPJPY Will Move Higher! Buy!
Please, check our technical outlook for GBPJPY.
Time Frame: 9h
Current Trend: Bullish
Sentiment: Oversold (based on 7-period RSI)
Forecast: Bullish
The market is approaching a significant support area 205.634.
The underlined horizontal cluster clearly indicates a highly probable bullish movement with target 208.475 level.
P.S
Please, note that an oversold/overbought condition can last for a long time, and therefore being oversold/overbought doesn't mean a price rally will come soon, or at all.
Like and subscribe and comment my ideas if you enjoy them!
