USDJPY Will Go Higher! Long!
Take a look at our analysis for USDJPY.
Time Frame: 9h
Current Trend: Bullish
Sentiment: Oversold (based on 7-period RSI)
Forecast: Bullish
The price is testing a key support 152.055.
Current market trend & oversold RSI makes me think that buyers will push the price. I will anticipate a bullish movement at least to 153.795 level.
P.S
We determine oversold/overbought condition with RSI indicator.
When it drops below 30 - the market is considered to be oversold.
When it bounces above 70 - the market is considered to be overbought.
Like and subscribe and comment my ideas if you enjoy them!
Long!!!!

EURGBP: Long Trade with Entry/SL/TP
EURGBP
- Classic bullish formation
- Our team expects growth
SUGGESTED TRADE:
Swing Trade
Buy EURGBP
Entry Level - 0.8774
Sl - 0.8765
Tp - 0.8791
Our Risk - 1%
Start protection of your profits from lower levels
Disclosure: I am part of Trade Nation's Influencer program and receive a monthly fee for using their TradingView charts in my analysis.
❤️ Please, support our work with like & comment! ❤️

AUDNZD My Opinion! BUY!
My dear followers,
This is my opinion on the AUDNZD next move:
The asset is approaching an important pivot point 1.1391
Bias - Bullish
Safe Stop Loss - 1.1385
Technical Indicators: Supper Trend generates a clear long signal while Pivot Point HL is currently determining the overall Bullish trend of the market.
Goal - 1.1402
About Used Indicators:
For more efficient signals, super-trend is used in combination with other indicators like Pivot Points.
Disclosure: I am part of Trade Nation's Influencer program and receive a monthly fee for using their TradingView charts in my analysis.
———————————
WISH YOU ALL LUCK

NZDCAD Expected Growth! BUY!
My dear followers,
This is my opinion on the NZDCAD next move:
The asset is approaching an important pivot point 0.8016
Bias - Bullish
Technical Indicators: Supper Trend generates a clear long signal while Pivot Point HL is currently determining the overall Bullish trend of the market.
Goal - 0.8041
About Used Indicators:
For more efficient signals, super-trend is used in combination with other indicators like Pivot Points.
Disclosure: I am part of Trade Nation's Influencer program and receive a monthly fee for using their TradingView charts in my analysis.
———————————
WISH YOU ALL LUCK

EURJPY On The Rise! BUY!
My dear friends,
Please, find my technical outlook for EURJPY below:
The price is coiling around a solid key level - 177.61
Bias - Bullish
Technical Indicators: Pivot Points Low anticipates a potential price reversal.
Super trend shows a clear buy, giving a perfect indicators' convergence.
Goal - 178.11
Safe Stop Loss - 177.34
About Used Indicators:
The pivot point itself is simply the average of the high, low and closing prices from the previous trading day.
Disclosure: I am part of Trade Nation's Influencer program and receive a monthly fee for using their TradingView charts in my analysis.
———————————
WISH YOU ALL LUCK

EURUSD: Bulls Will Push
Balance of buyers and sellers on the EURUSD pair, that is best felt when all the timeframes are analyzed properly is shifting in favor of the buyers, therefore is it only natural that we go long on the pair.
Disclosure: I am part of Trade Nation's Influencer program and receive a monthly fee for using their TradingView charts in my analysis.
❤️ Please, support our work with like & comment! ❤️

EURAUD: Bullish Continuation & Long Trade
EURAUD
- Classic bullish formation
- Our team expects pullback
SUGGESTED TRADE:
Swing Trade
Long EURAUD
Entry - 1.7607
Sl - 1.7589
Tp - 1.7642
Our Risk - 1%
Start protection of your profits from lower levels
Disclosure: I am part of Trade Nation's Influencer program and receive a monthly fee for using their TradingView charts in my analysis.
❤️ Please, support our work with like & comment! ❤️

NZDUSD Trading Opportunity! BUY!
My dear friends,
Please, find my technical outlook for NZDUSD below:
The instrument tests an important psychological level 0.5719
Bias - Bullish
Technical Indicators: Supper Trend gives a precise Bullish signal, while Pivot Point HL predicts price changes and potential reversals in the market.
Target - 0.5746
About Used Indicators:
Super-trend indicator is more useful in trending markets where there are clear uptrends and downtrends in price.
Disclosure: I am part of Trade Nation's Influencer program and receive a monthly fee for using their TradingView charts in my analysis.
———————————
WISH YOU ALL LUCK

GBP/USD BULLISH BIAS RIGHT NOW| LONG
GBP/USD SIGNAL
Trade Direction: long
Entry Level: 1.313
Target Level: 1.332
Stop Loss: 1.301
RISK PROFILE
Risk level: medium
Suggested risk: 1%
Timeframe: 1D
Disclosure: I am part of Trade Nation's Influencer program and receive a monthly fee for using their TradingView charts in my analysis.
✅LIKE AND COMMENT MY IDEAS✅

EUR/USD BEST PLACE TO BUY FROM|LONG
Hello, Friends!
We are targeting the 1.165 level area with our long trade on EUR/USD which is based on the fact that the pair is oversold on the BB band scale and is also approaching a support line below thus going us a good entry option.
Disclosure: I am part of Trade Nation's Influencer program and receive a monthly fee for using their TradingView charts in my analysis.
✅LIKE AND COMMENT MY IDEAS✅

BITCOIN BULLS WILL DOMINATE THE MARKET|LONG
BITCOIN SIGNAL
Trade Direction: long
Entry Level: 106,482.62
Target Level: 113,901.05
Stop Loss: 101,549.96
RISK PROFILE
Risk level: medium
Suggested risk: 1%
Timeframe: 1D
Disclosure: I am part of Trade Nation's Influencer program and receive a monthly fee for using their TradingView charts in my analysis.
✅LIKE AND COMMENT MY IDEAS✅

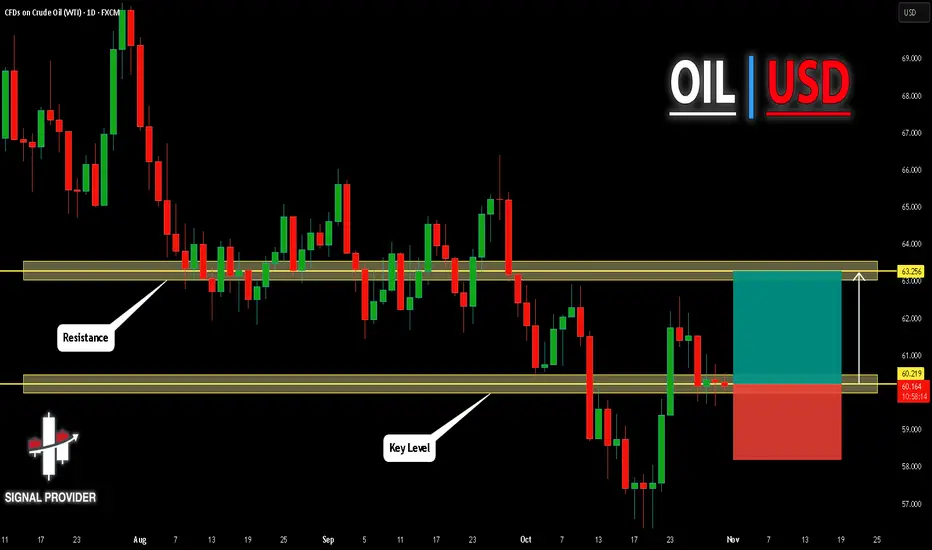
USOIL Is Very Bullish! Long!
Please, check our technical outlook for USOIL.
Time Frame: 1D
Current Trend: Bullish
Sentiment: Oversold (based on 7-period RSI)
Forecast: Bullish
The market is approaching a significant support area 60.219.
The underlined horizontal cluster clearly indicates a highly probable bullish movement with target 63.256 level.
P.S
Please, note that an oversold/overbought condition can last for a long time, and therefore being oversold/overbought doesn't mean a price rally will come soon, or at all.
Like and subscribe and comment my ideas if you enjoy them!
US30 Eyes 47,200 for Potential BounceHey Traders, in today’s trading session we’re monitoring US30 for a potential buying opportunity around the 47,200 zone.
The Dow Jones continues to trade in a broader uptrend, and price action is currently in a correction phase, approaching the 47,200 support and resistance confluence area — a key zone where buyers may look to step back in.
Watching for a bullish reaction at this level to confirm continuation of the prevailing trend.
Share your view below — do you think US30 holds this zone or breaks lower?
Trade safe,
Joe.

Euro Finds Support — Correction Phase Targets 1.16340Hello traders! I’d like to share my view on the current EUR/USD market structure. After a strong bullish impulse within the ascending channel, the price faced rejection near the Resistance Level around 1.16600, where sellers stepped in, forming a clear turnaround structure. Following that, the pair entered a descending channel, confirming short-term bearish momentum. A breakout below the Resistance Level pushed the price back toward the Buyer Zone, located near the 1.16000 Support Level, where demand previously triggered a bullish correction. Currently, EUR/USD is trading inside a corrective structure just above support. The market has formed a potential reversal setup, suggesting a possible short-term recovery toward the TP1 target near 1.16340. However, as long as the price remains below the Seller Zone, bearish pressure is likely to persist, keeping the market in a consolidation phase. In my opinion, this movement represents a retracement within the broader range rather than the start of a new bullish trend. If the price successfully bounces from the Support Level and confirms higher lows, we may see renewed buying momentum. Otherwise, a breakdown below 1.16000 could open the way for deeper declines. This setup offers a clear short-term trading plan — bullish correction toward TP1, while monitoring reaction around the support area for a potential continuation or reversal signal. Please share this idea with your friends and click Boost 🚀

Gold Rebound: Bulls Target 4,130 ResistanceHello, traders, I want share with you my opinion about Gold. Gold has been trading within a broad technical structure, evolving from a strong bullish phase into a corrective descending channel. The previous uptrend was clearly defined by an ascending channel, which guided the price through multiple impulsive rallies and pullbacks. However, after forming a double-top pattern near the 4320 resistance level, buyers began to lose momentum, resulting in a sharp decline. Currently, the price is trading within a well-defined descending channel, where sellers have been maintaining short-term control. After a deep test of the Buyer Zone around 3920, the market has shown early signs of a potential rebound. The asset is now pulling back from this support area and is approaching the resistance line of the descending channel. In my opinion, this upward correction represents a short-term recovery within a larger bearish context. I expect that the price will rally towards the Resistance Level near 4130–4140, where strong selling pressure may reappear. This area is also aligned with the upper boundary of the descending channel, creating a strong confluence zone. A rejection from this resistance line would confirm the continuation of the bearish structure. The next potential move could be a rotation back down towards the Buyer Zone, or even a deeper retest of the Support Line around 3920. My take-profit (TP1) for the corrective rally is placed at 4108, targeting the upper range of the structure before the next potential reversal. Please share this idea with your friends and click Boost 🚀

BTC GOLDEN CYCLE CAN START ANY MOMENT WITH BREAKOUT 112K AFTER..BTC Breakdown Completed — Potential Rebound Toward $112K 🔁
Bitcoin has successfully tested the 106K zone, completing the expected breakdown move.
Price action now shows early signs of stabilization, suggesting that a recovery toward $112K–$113K could follow in the short term.
📊 Market Outlook:
Support was confirmed near $106K, halting further downside pressure.
Short-term resistance sits around $111.6K–$113.5K, the next likely retracement target.
Momentum remains weak but improving — volume shows early buyer re-entry.
📈 Scenario:
If BTC maintains support above $107K, a technical bounce toward the mid-range near $112K becomes likely before facing renewed resistance.
However, failure to sustain current levels could risk a retest of $106K.
💬 Summary:
BTC completed its breakdown to the 106K area and is now forming a possible relief rebound setup targeting $112K–$113K range.
With the same data, we did expect before the breakdown from 115K to 106K zone

NZDCAD: Bullish Continuation
The charts are full of distraction, disturbance and are a graveyard of fear and greed which shall not cloud our judgement on the current state of affairs in the NZDCAD pair price action which suggests a high likelihood of a coming move up.
Disclosure: I am part of Trade Nation's Influencer program and receive a monthly fee for using their TradingView charts in my analysis.
❤️ Please, support our work with like & comment! ❤️

AUDUSD: Long Signal Explained
AUDUSD
- Classic bullish pattern
- Our team expects retracement
SUGGESTED TRADE:
Swing Trade
Buy AUDUSD
Entry - 0.6552
Stop - 0.6540
Take - 0.6575
Our Risk - 1%
Start protection of your profits from lower levels
Disclosure: I am part of Trade Nation's Influencer program and receive a monthly fee for using their TradingView charts in my analysis.
❤️ Please, support our work with like & comment! ❤️

BITCOIN LONG FROM SUPPORT
BITCOIN SIGNAL
Trade Direction: long
Entry Level: 109,971.94
Target Level: 115,314.48
Stop Loss: 106,410.24
RISK PROFILE
Risk level: medium
Suggested risk: 1%
Timeframe: 2h
Disclosure: I am part of Trade Nation's Influencer program and receive a monthly fee for using their TradingView charts in my analysis.
✅LIKE AND COMMENT MY IDEAS✅

EURUSD What Next? BUY!
My dear followers,
I analysed this chart on EURUSD and concluded the following:
The market is trading on 1.1608 pivot level.
Bias - Bullish
Technical Indicators: Both Super Trend & Pivot HL indicate a highly probable Bullish continuation.
Target - 1.1636
About Used Indicators:
A super-trend indicator is plotted on either above or below the closing price to signal a buy or sell. The indicator changes color, based on whether or not you should be buying. If the super-trend indicator moves below the closing price, the indicator turns green, and it signals an entry point or points to buy.
Disclosure: I am part of Trade Nation's Influencer program and receive a monthly fee for using their TradingView charts in my analysis.
———————————
WISH YOU ALL LUCK

CAD/JPY BULLS WILL DOMINATE THE MARKET|LONG
CAD/JPY SIGNAL
Trade Direction: long
Entry Level: 108.551
Target Level: 109.472
Stop Loss: 107.936
RISK PROFILE
Risk level: medium
Suggested risk: 1%
Timeframe: 3h
Disclosure: I am part of Trade Nation's Influencer program and receive a monthly fee for using their TradingView charts in my analysis.
✅LIKE AND COMMENT MY IDEAS✅

GOLD Will Go Up From Support! Buy!
Here is our detailed technical review for GOLD.
Time Frame: 2h
Current Trend: Bullish
Sentiment: Oversold (based on 7-period RSI)
Forecast: Bullish
The market is testing a major horizontal structure 3,985.10.
Taking into consideration the structure & trend analysis, I believe that the market will reach 4,051.12 level soon.
P.S
Please, note that an oversold/overbought condition can last for a long time, and therefore being oversold/overbought doesn't mean a price rally will come soon, or at all.
Like and subscribe and comment my ideas if you enjoy them!

GBPUSD Will Go Up! Long!
Please, check our technical outlook for GBPUSD.
Time Frame: 1D
Current Trend: Bullish
Sentiment: Oversold (based on 7-period RSI)
Forecast: Bullish
The market is approaching a significant support area 1.317.
The underlined horizontal cluster clearly indicates a highly probable bullish movement with target 1.345 level.
P.S
We determine oversold/overbought condition with RSI indicator.
When it drops below 30 - the market is considered to be oversold.
When it bounces above 70 - the market is considered to be overbought.
Like and subscribe and comment my ideas if you enjoy them!
