SPY Will Explode! BUY!
My dear friends,
My technical analysis for SPYis below:
The market is trading on 681.74 pivot level.
Bias - Bullish
Technical Indicators: Both Super Trend & Pivot HL indicate a highly probable Bullish continuation.
Target - 684.43
Recommended Stop Loss - 680.39
About Used Indicators:
A pivot point is a technical analysis indicator, or calculations, used to determine the overall trend of the market over different time frames.
Disclosure: I am part of Trade Nation's Influencer program and receive a monthly fee for using their TradingView charts in my analysis.
———————————
WISH YOU ALL LUCK
Long!!!!

AUDJPY Is Very Bullish! Long!
Please, check our technical outlook for AUDJPY.
Time Frame: 1h
Current Trend: Bullish
Sentiment: Oversold (based on 7-period RSI)
Forecast: Bullish
The market is on a crucial zone of demand 102.249.
The oversold market condition in a combination with key structure gives us a relatively strong bullish signal with goal 102.716 level.
P.S
Please, note that an oversold/overbought condition can last for a long time, and therefore being oversold/overbought doesn't mean a price rally will come soon, or at all.
Like and subscribe and comment my ideas if you enjoy them!

GOLD Is Bullish! Buy!
Take a look at our analysis for GOLD.
Time Frame: 4h
Current Trend: Bullish
Sentiment: Oversold (based on 7-period RSI)
Forecast: Bullish
The market is approaching a significant support area 4,188.16.
The underlined horizontal cluster clearly indicates a highly probable bullish movement with target 4,233.29 level.
P.S
Overbought describes a period of time where there has been a significant and consistent upward move in price over a period of time without much pullback.
Like and subscribe and comment my ideas if you enjoy them!

BITCOIN Is Very Bullish! Long!
Take a look at our analysis for BITCOIN.
Time Frame: 1h
Current Trend: Bullish
Sentiment: Oversold (based on 7-period RSI)
Forecast: Bullish
The market is testing a major horizontal structure 90,218.38.
Taking into consideration the structure & trend analysis, I believe that the market will reach 91,478.05 level soon.
P.S
Overbought describes a period of time where there has been a significant and consistent upward move in price over a period of time without much pullback.
Like and subscribe and comment my ideas if you enjoy them!

USOIL BULLISH BIAS RIGHT NOW| LONG
USOIL SIGNAL
Trade Direction: long
Entry Level: 57.53
Target Level: 59.96
Stop Loss: 55.93
RISK PROFILE
Risk level: medium
Suggested risk: 1%
Timeframe: 1D
Disclosure: I am part of Trade Nation's Influencer program and receive a monthly fee for using their TradingView charts in my analysis.
✅LIKE AND COMMENT MY IDEAS✅

GBPUSD: Long Trade with Entry/SL/TP
GBPUSD
- Classic bullish formation
- Our team expects growth
SUGGESTED TRADE:
Swing Trade
Buy GBPUSD
Entry Level - 1.3374
Sl - 1.3361
Tp - 1.3400
Our Risk - 1%
Start protection of your profits from lower levels
Disclosure: I am part of Trade Nation's Influencer program and receive a monthly fee for using their TradingView charts in my analysis.
❤️ Please, support our work with like & comment! ❤️

AUDCHF Sellers In Panic! BUY!
My dear subscribers,
This is my opinion on the EURAUD next move:
The instrument tests an important psychological level 0.5292
Bias - Bullish
Technical Indicators: Supper Trend gives a precise Bullish signal, while Pivot Point HL predicts price changes and potential reversals in the market.
Target - 0.5317
About Used Indicators:
On the subsequent day, trading above the pivot point is thought to indicate ongoing bullish sentiment, while trading below the pivot point indicates bearish sentiment.
Disclosure: I am part of Trade Nation's Influencer program and receive a monthly fee for using their TradingView charts in my analysis.
———————————
WISH YOU ALL LUCK

NZDCAD Massive Long! BUY!
My dear subscribers,
NZDCAD looks like it will make a good move, and here are the details:
The market is trading on 0.7986 pivot level.
Bias - Bullish
My Stop Loss - 0.7979
Technical Indicators: Both Super Trend & Pivot HL indicate a highly probable Bullish continuation.
Target - 0.7998
About Used Indicators:
The average true range (ATR) plays an important role in 'Supertrend' as the indicator uses ATR to calculate its value. The ATR indicator signals the degree of price volatility.
Disclosure: I am part of Trade Nation's Influencer program and receive a monthly fee for using their TradingView charts in my analysis.
———————————
WISH YOU ALL LUCK

AUD/CHF LONG FROM SUPPORT
Hello, Friends!
AUD/CHF pair is in the uptrend because previous week’s candle is green, while the price is evidently falling on the 4H timeframe. And after the retest of the support line below I believe we will see a move up towards the target above at 0.536 because the pair is oversold due to its proximity to the lower BB band and a bullish correction is likely.
Disclosure: I am part of Trade Nation's Influencer program and receive a monthly fee for using their TradingView charts in my analysis.
✅LIKE AND COMMENT MY IDEAS✅

EURUSD My Opinion! BUY!
My dear followers,
I analysed this chart on EURUSD and concluded the following:
The market is trading on 1.1644 pivot level.
Bias - Bullish
Technical Indicators: Both Super Trend & Pivot HL indicate a highly probable Bullish continuation.
Target - 1.1658
About Used Indicators:
A super-trend indicator is plotted on either above or below the closing price to signal a buy or sell. The indicator changes color, based on whether or not you should be buying. If the super-trend indicator moves below the closing price, the indicator turns green, and it signals an entry point or points to buy.
Disclosure: I am part of Trade Nation's Influencer program and receive a monthly fee for using their TradingView charts in my analysis.
———————————
WISH YOU ALL LUCK

AUDCHF Trading Opportunity! BUY!
My dear followers,
I analysed this chart on AUDCHF and concluded the following:
The market is trading on 0.5331 pivot level.
Bias - Bullish
Technical Indicators: Both Super Trend & Pivot HL indicate a highly probable Bullish continuation.
Target - 0.5345
Safe Stop Loss - 0.5323
About Used Indicators:
A super-trend indicator is plotted on either above or below the closing price to signal a buy or sell. The indicator changes color, based on whether or not you should be buying. If the super-trend indicator moves below the closing price, the indicator turns green, and it signals an entry point or points to buy.
Disclosure: I am part of Trade Nation's Influencer program and receive a monthly fee for using their TradingView charts in my analysis.
———————————
WISH YOU ALL LUCK

XAUUSD: Bulls Hold Structure - Targeting 4,300 Resistance RetestHello everyone, here is my analysis of the current XAUUSD setup.
Market Analysis
XAUUSD is trading within a broader ascending structure, supported by a well-defined trend line that continues to drive the market upward. Recent price action shows several successful breakouts from previous consolidation zones, confirming sustained bullish pressure. After an extended period of ranging, buyers regained control and pushed the market higher, respecting the overall upward trajectory.
Currently, price is moving within a narrowing formation defined by an upper resistance line and a lower support line. This developing wedge formation suggests that bullish momentum remains intact, but the market is consolidating before its next significant move. The 4,170 support zone continues to serve as a key demand area, where buyers previously stepped in and defended the bullish trend. On the other hand, the 4,300 resistance zone limits the upside and remains the primary barrier for buyers. Overall, the structure indicates that the market maintains a bullish bias as long as price stays above the support line and holds above the 4,170 support level.
My Scenario & Strategy
My scenario remains bullish as long as XAUUSD trades above the 4,170 support zone and continues to respect the rising support line within the current formation. I expect the price to attempt another move toward the 4,300 resistance zone, which aligns with the upper boundary of the wedge structure. A strong breakout above 4,300 would confirm bullish continuation and could open the path for further upward expansion.
However, if the price fails to hold the support line and breaks below the 4,170 level with clear momentum, the bullish scenario would be invalidated, potentially signaling the start of a deeper corrective phase. For now, the market structure favors a long bias, with focus on a potential movement toward the 4,300 resistance area.
That is the setup I am currently monitoring. Thank you for your attention, and as always — manage your risk!

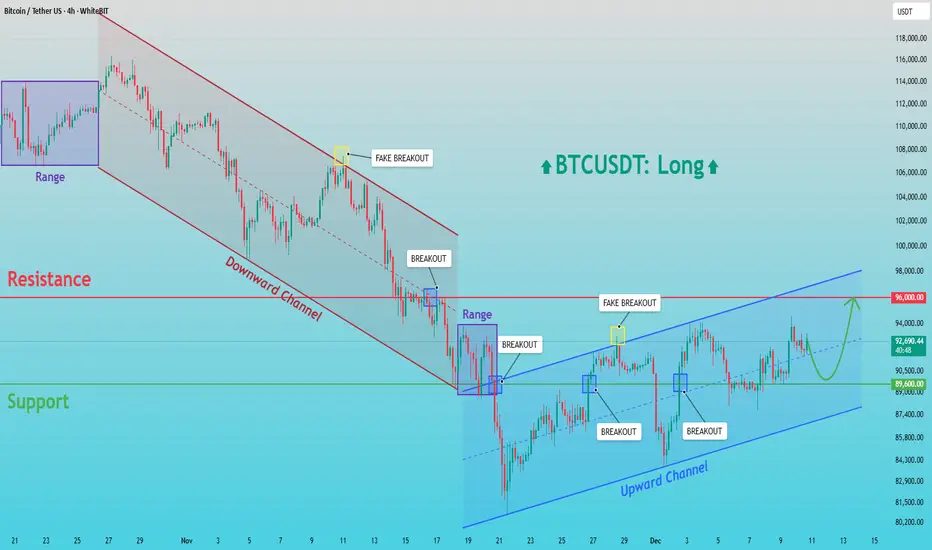
BTCUSDT: Buyers Regain Control — $96,000 in FocusHello everyone, here is my breakdown of the current BTCUSDT setup.
Market Analysis
Bitcoin is transitioning from a broader bearish phase into a developing bullish structure. After a prolonged decline inside a well-defined downward channel, BTC formed a base near the $89,600 support zone, where strong buyer interest appeared. Multiple breakouts and fake breakouts around this level confirmed accumulation and growing bullish pressure. Following this reversal, price broke out of the bearish channel and entered a new ascending channel, forming higher highs and higher lows.
Currently, BTCUSDT is consolidating inside this upward structure and trading below the key $96,000 resistance, which remains the major obstacle for buyers. Several false breakouts near this resistance indicate that sellers are still active in this area. However, as long as price holds above the $89,600 support, the bullish structure remains valid and buyers stay in control.
My Scenario & Strategy
My scenario is bullish as long as BTCUSDT stays above the $89,600 support zone and continues to respect the ascending channel structure. I expect the price to gradually build momentum and attempt a retest of the $96,000 resistance. A clean and confident breakout above this level would confirm further upside continuation and open the way for higher targets.
However, if the price fails to break $96,000 and shows strong rejection, a short-term pullback toward the lower channel support may occur. For now, the market favors buyers, with $96,000 as the key upside objective.
That's the setup I'm tracking. Thank you for your attention, and always manage your risk.
USOIL Is Very Bullish! Buy!
Here is our detailed technical review for USOIL.
Time Frame: 1h
Current Trend: Bullish
Sentiment: Oversold (based on 7-period RSI)
Forecast: Bullish
The market is approaching a significant support area 57.360.
The underlined horizontal cluster clearly indicates a highly probable bullish movement with target 58.090 level.
P.S
Overbought describes a period of time where there has been a significant and consistent upward move in price over a period of time without much pullback.
Like and subscribe and comment my ideas if you enjoy them!

GBP/CAD BULLS ARE GAINING STRENGTH|LONG
GBP/CAD SIGNAL
Trade Direction: long
Entry Level: 1.840
Target Level: 1.844
Stop Loss: 1.838
RISK PROFILE
Risk level: medium
Suggested risk: 1%
Timeframe: 1h
Disclosure: I am part of Trade Nation's Influencer program and receive a monthly fee for using their TradingView charts in my analysis.
✅LIKE AND COMMENT MY IDEAS✅

This Is Why GBPUSD Could Spike Hard USD Fundamentally Broken!Hey Traders, in today’s trading session we are monitoring GBPUSD for a buying opportunity around the 1.33500 zone.
GBPUSD is trading in a clear uptrend and is currently in a correction phase, approaching the trend area at 1.33500, which acts as a key support and resistance zone.
On the fundamental side, the US Dollar remains under pressure after the Fed’s recent 25 bps rate cut, which aligns with a broader shift toward easing. With markets now hyper-focused on labor market data, any sign of softness could increase expectations for another cut. The January FOMC isn’t fully priced for additional easing yet — which leaves room for more USD weakness, supporting GBPUSD’s bullish bias.
Trade safe,
Joe.

AEVA Macro Setup: Textbook Bull Flag Breakout on Weekly ChartExecutive Summary: A High-Probability Continuation Play
We are currently tracking a massive technical setup on Aeva Technologies (AEVA) . After a parabolic impulse move of over 1,400% earlier this year, the stock has spent the last few months in a healthy, controlled consolidation phase.
The structure is now complete. The charts are signaling that the consolidation is over, and the next leg of the primary bullish trend is beginning.
Below is a detailed technical and structural analysis of why AEVA presents one of the most attractive risk/reward ratios in the market right now.
________________________________________
1. Market Structure: The "Bull Flag" Mechanics 🏳️
To understand where price is going, we must understand where it has been. The chart is forming a classic Bull Flag / Falling Wedge pattern on the Weekly Timeframe.
Phase 1: The Impulse (The Pole):
The initial rally from $2.50 to $35.60 was driven by institutional demand. This aggressive buying created a "change of character" in the stock, signaling a long-term trend reversal.
Phase 2: The Consolidation (The Flag):
For the past few months, price has drifted lower in a contained channel (marked by the yellow trendlines). Crucially, this sell-off was low volume . This indicates a lack of aggressive selling pressure. It was merely profit-taking by short-term traders, while long-term holders maintained their positions.
Phase 3: The Breakout (Current State):
Price is now breaking above the upper resistance of the wedge. This signals that the supply has dried up, and buyers are stepping back in to push prices higher.
________________________________________
2. Multi-Timeframe Confirmation 📊
A breakout is only as good as the indicators backing it up. We have strong confluence here:
A. Volume Analysis:
Volume is the fuel of any move. Notice the volume profile:
1. High volume during the initial rally (Accumulation).
2. Declining volume during the pullback (No supply).
3. Surging volume on the current breakout candle.
This sequence confirms that "Smart Money" is supporting the current move.
B. Momentum (Weekly MACD):
The MACD indicator on the weekly chart provides a powerful signal. The histogram is flipping bullish, and the signal lines are curling upward for a bullish crossover. Historically, weekly MACD crossovers on momentum stocks lead to multi-week or multi-month rallies.
________________________________________
3. Strategic Targets & Trade Management 🎯
Given the volatility of AEVA, we are using structural resistance levels rather than purely theoretical projections.
🛑 Stop Loss (Invalidation):
A weekly close back inside the wedge structure (below $14.00 - $14.50 ) would invalidate the breakout thesis.
✅ Target 1: The Test ($35.00 - $35.60)
The first major objective is a retest of the previous cycle high. The stock must prove it can clear the supply zone where sellers stepped in last time. Reaching this level represents a potential ~100% gain from current prices.
✅ Target 2: Blue Sky Breakout ($45.00 - $50.00)
If the stock clears $35.60 with volume, there is no overhead resistance. Using Fibonacci extensions, the next psychological targets sit at the $45 and $50 levels.
________________________________________
4. The Fundamental Catalyst (LiDAR)
Technical analysis tells us "when," but fundamentals tell us "why." The LiDAR and Autonomous Driving sector is waking up. As AEVA moves towards commercialization with major automotive partners, the market is pricing in future growth. The technical breakout is likely leading the fundamental news cycle.
💡 Conclusion
This is not a random movement. It is a structured, textbook technical pattern supported by volume and momentum. For traders looking for asymmetric upside, AEVA offers a pristine setup.
Disclaimer: This analysis is for educational purposes only. I am not a financial advisor. Please manage your risk and trade according to your own plan.

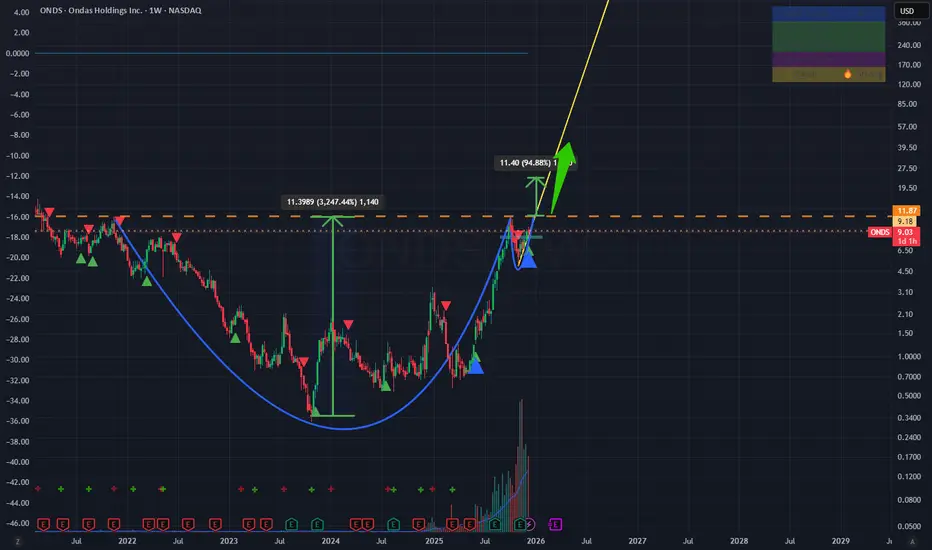
ONDS:Cup & Handle Breakout | Institutional Accumulation DetectedInstitutional Accumulation Detected: ONDS is Waking Up.
We are looking at a textbook technical setup on the weekly timeframe. After a multi-year consolidation phase, ONDS has completed a massive Cup and Handle pattern. This setup offers a highly asymmetric risk/reward opportunity.
Here is the professional breakdown of why this stock is primed for a major trend reversal.
1. The Technical Thesis: "The Perfect Storm"
The Structure: The stock has spent over 24 months carving out a massive base ("The Cup"). The recent pullback was the "Handle" – a classic shakeout of weak hands before the real move.
Volume Confirmation 📊: This is the most bullish signal. The breakout is supported by massive volume bars , indicating that institutions and "Smart Money" are accumulating shares aggressively. Price confirms, but volume validates.
Trendline Support: The stock is respecting a pristine ascending trendline (Yellow Line on chart). As long as price holds above this dynamic support, the bullish trend is intact.
2. The Fundamental Catalyst
Technical breakouts rarely happen in a vacuum. The market is pricing in a major shift in ONDS's business cycle – moving from R&D to commercialization . With the growing demand for autonomous drone solutions in defense and critical infrastructure, the market is realizing that this asset is significantly undervalued relative to its growth potential.
🎯 Trade Setup & Targets
Trigger: The breakout above the $9.00 psychological level is our confirmation.
Target 1 (Conservative): $13.00 (Testing historical supply zones).
Target 2 (Pattern Projection): $18.00 - $20.00 (Measured move based on the depth of the Cup).
Stop Loss (Invalidation): A weekly close below the ascending trendline (approx $7.50 ) would invalidate the bullish thesis.
💡 Conclusion
The charts don't lie. We have Price Action + Volume + Fundamentals all aligning at the same time. This is a high-probability setup for a substantial move upward.
________________________________________
Disclaimer: This idea is for educational purposes only and does not constitute financial advice. Always manage your risk.
XAUUSD Long: Demand Holds — Price Aiming for $4,260 RetestHello, traders! The current price action on GOLD (XAUUSD) is developing within a clearly defined ascending channel, showing that the broader bullish structure remains intact despite recent corrective movements. Earlier, the market formed a Double Top pattern near the upper Supply Zone around $4,260, which triggered a bearish reaction and a downside breakout from that distribution phase. After this rejection, price moved into a corrective decline, respecting the Triangle Supply and Demand lines, where multiple breakouts confirmed increasing volatility and active participation from both buyers and sellers. Following the corrective phase, Gold reached a key Pivot Point near the lower Triangle Demand Line, where strong buying interest appeared and initiated a bullish reversal. From this base, price broke back above resistance and entered the current Ascending Channel, forming higher highs and higher lows.
Currently, XAUUSD is consolidating near the $4,190–$4,200 Demand Zone, where buyers are actively defending the structure. The market is holding above channel support, suggesting that bullish momentum is stabilizing after the pullback.
My scenario remains bullish as long as price stays above the highlighted Demand Zone around $4,180–$4,190 and continues to respect the lower boundary of the ascending channel. I expect Gold to gradually build momentum and attempt another move toward the $4,260 Resistance level, which represents the next major target and the top of the recent supply area. A confident breakout above this zone would signal trend continuation and open the door for further upside. However, a failure to hold current demand could trigger a deeper correction back toward the lower channel area. For now, the structure favors buyers, with $4,260 as the main upside objective. Manage your risk!

AUDNZD: Forecast & Technical Analysis
The analysis of the AUDNZD chart clearly shows us that the pair is finally about to go up due to the rising pressure from the buyers.
❤️ Please, support our work with like & comment! ❤️

NZDCHF Technical Analysis! BUY!
My dear friends,
My technical analysis for NZDCHF is below:
The market is trading on 0.4629 pivot level.
Bias - Bullish
Technical Indicators: Both Super Trend & Pivot HL indicate a highly probable Bullish continuation.
Target - 0.4649
About Used Indicators:
A pivot point is a technical analysis indicator, or calculations, used to determine the overall trend of the market over different time frames.
Disclosure: I am part of Trade Nation's Influencer program and receive a monthly fee for using their TradingView charts in my analysis.
———————————
WISH YOU ALL LUCK

GBPCHF: Market of Buyers
Looking at the chart of GBPCHF right now we are seeing some interesting price action on the lower timeframes. Thus a local move up seems to be quite likely.
Disclosure: I am part of Trade Nation's Influencer program and receive a monthly fee for using their TradingView charts in my analysis.
❤️ Please, support our work with like & comment! ❤️

GBPJPY Expected Growth! BUY!
My dear subscribers,
My technical analysis for GBPJPY is below:
The price is coiling around a solid key level - 208.29
Bias - Bullish
Technical Indicators: Pivot Points Low anticipates a potential price reversal.
Super trend shows a clear buy, giving a perfect indicators' convergence.
Goal - 208.53
My Stop Loss - 208.16
About Used Indicators:
By the very nature of the supertrend indicator, it offers firm support and resistance levels for traders to enter and exit trades. Additionally, it also provides signals for setting stop losses
Disclosure: I am part of Trade Nation's Influencer program and receive a monthly fee for using their TradingView charts in my analysis.
———————————
WISH YOU ALL LUCK
