GBP/USD - Multi Timeframe Analysis GBP/USD – Top-Down Breakdown 🏦💷
WEEKLY 📆 (Big Boss View)
Price is chilling inside a large ascending channel, still respecting the long-term bullish structure.
We’ve tapped into that external sell-side liquidity (the grey zone) and reacted.
Structure still looks corrective, not impulsive.
As long as we hold that monthly demand support, GBP/USD looks like it wants a bigger upside swing toward the 1.3800+ zone 🏹.
Expectation: Sweep → Reversal → Push to the top of the range.
Weekly Bias :
🔻 Short-term weakness
🔺 Long-term bullish continuation (big swing wave 3 incoming)
DAILY 📅 (The Supervisor)
The daily structure is walking itself down in a corrective pullback, respecting the trendline from below.
We’re heading into the daily demand zone + lower swing range boundary.
Liquidity below has been taken previously but not fully mitigated — one more sweep is likely.
After that?
Big rocket-launch potential to form the next higher-timeframe leg up 🚀.
Daily Expectation:
➡️ Dip into daily demand
➡️ One more sweep
➡️ Then reversal toward 1.38
8H / 4H / Intraday (The Workers)
Inside a falling channel, clean bearish flow.
Price is tapping into small demand pockets, causing bounces — but not enough to break structure yet.
Clear BH (bearish high) + SH (swing high) levels show liquidity resting above.
Expect either:
A) Retrace to premium zone → Sell continuation
B) Flush into demand → Hard reversal
Intraday Bias:
Bearish until that higher-timeframe daily/weekly zone hits.
Overall Summary ⚡
GBP/USD is basically doing the classic play:
“Short-term bearish snack → Long-term bullish main meal.”
🍫➡️🥩
HTF (Weekly/Daily): Preparing for a major bullish leg
STF (8H/4H): Still bearish, likely to sweep lows before reversing
Key target on reversal: 1.3700 → 1.3800+
Long!!

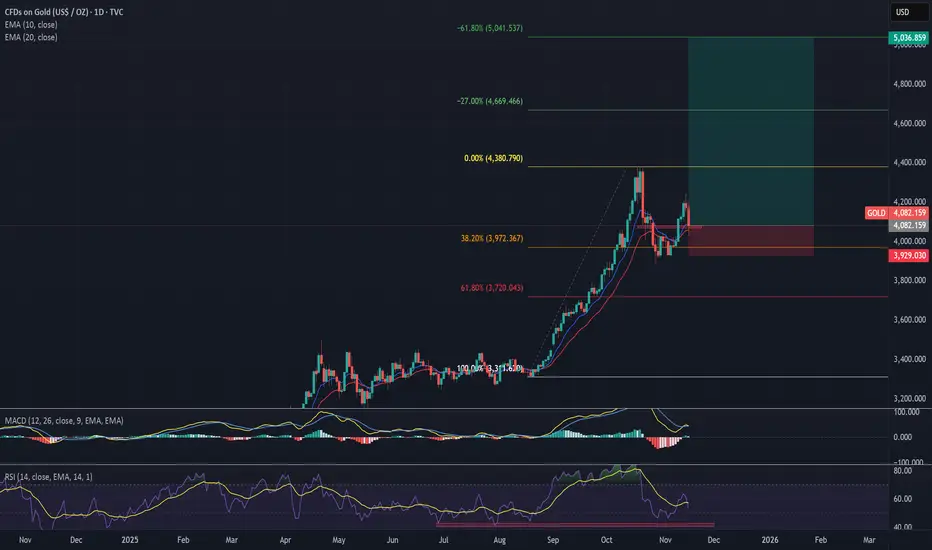
Generational Wealth | Precious Metals Super Cycle | GoldStrategy: Impulse Correction
Direction: Bullish
Moving Average: Blue above Red
Fib Retracement: 38.2 reached
MACD > 0
Support: After a massive sell-off across the board, we will look to see if gold can hold support by bouncing off the moving averages. Lets see if it can find bullish strength and regain the move experienced on Friday. If it moves lower, we could see it going back to 4000, before a potential reversal.
1st Target = 4380
2nd Target = 4669
3rd Target = 5041
Lots: 0.1 (Plan to pyramid into this one)
INSIGHTS: Precious metals continue to show strength with a weakening dollar. Pay attention to the DBC commodity Index which is indicating strength across the commodity complex. Alongside this, the DXY is sitting at an interesting level. Lets see whether will bounce at this level off a multiyear trend or whether the dollar will give way to lower lows in the coming months.
SILVER: Bulls Will Push Higher
The recent price action on the SILVER pair was keeping me on the fence, however, my bias is slowly but surely changing into the bullish one and I think we will see the price go up.
Disclosure: I am part of Trade Nation's Influencer program and receive a monthly fee for using their TradingView charts in my analysis.
❤️ Please, support our work with like & comment! ❤️

BTCUSD: Long Trade Explained
BTCUSD
- Classic bullish setup
- Our team expects bullish continuation
SUGGESTED TRADE:
Swing Trade
Long BTCUSD
Entry Point - 94425
Stop Loss - 93072
Take Profit - 97018
Our Risk - 1%
Start protection of your profits from lower levels
Disclosure: I am part of Trade Nation's Influencer program and receive a monthly fee for using their TradingView charts in my analysis.
❤️ Please, support our work with like & comment! ❤️

TESLA: Bullish Continuation is Expected! Here is Why:
It is essential that we apply multitimeframe technical analysis and there is no better example of why that is the case than the current TESLA chart which, if analyzed properly, clearly points in the upward direction.
Disclosure: I am part of Trade Nation's Influencer program and receive a monthly fee for using their TradingView charts in my analysis.
❤️ Please, support our work with like & comment! ❤️

SPY: Long Trading Opportunity
SPY
- Classic bullish formation
- Our team expects growth
SUGGESTED TRADE:
Swing Trade
Buy SPY
Entry Level - 671.95
Sl - 668.83
Tp - 677.75
Our Risk - 1%
Start protection of your profits from lower levels
Disclosure: I am part of Trade Nation's Influencer program and receive a monthly fee for using their TradingView charts in my analysis.
❤️ Please, support our work with like & comment! ❤️

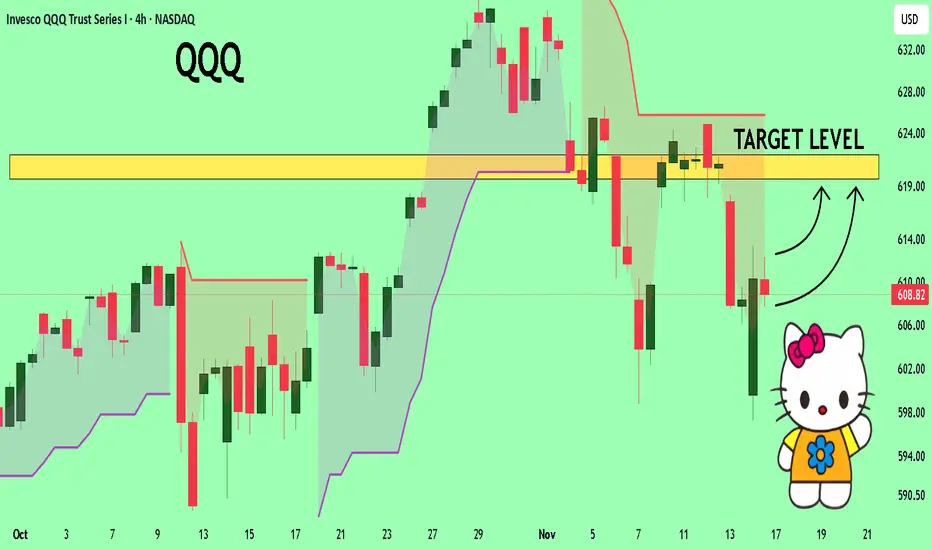
QQQ What Next? BUY!
My dear friends,
Please, find my technical outlook for QQQ below:
The instrument tests an important psychological level 608.82
Bias - Bullish
Technical Indicators: Supper Trend gives a precise Bullish signal, while Pivot Point HL predicts price changes and potential reversals in the market.
Target - 619.63
About Used Indicators:
Super-trend indicator is more useful in trending markets where there are clear uptrends and downtrends in price.
Disclosure: I am part of Trade Nation's Influencer program and receive a monthly fee for using their TradingView charts in my analysis.
———————————
WISH YOU ALL LUCK
EURUSD My Opinion! BUY!
My dear followers,
I analysed this chart on EURUSD and concluded the following:
The market is trading on 1.1621 pivot level.
Bias - Bullish
Technical Indicators: Both Super Trend & Pivot HL indicate a highly probable Bullish continuation.
Target - 1.1642
Safe Stop Loss - 1.1608
About Used Indicators:
A super-trend indicator is plotted on either above or below the closing price to signal a buy or sell. The indicator changes color, based on whether or not you should be buying. If the super-trend indicator moves below the closing price, the indicator turns green, and it signals an entry point or points to buy.
Disclosure: I am part of Trade Nation's Influencer program and receive a monthly fee for using their TradingView charts in my analysis.
———————————
WISH YOU ALL LUCK

US30 Set To Grow! BUY!
My dear subscribers,
My technical analysis for US30 is below:
The price is coiling around a solid key level - 47178
Bias - Bullish
Technical Indicators: Pivot Points High anticipates a potential price reversal.
Super trend shows a clear buy, giving a perfect indicators' convergence.
Goal - 47528
About Used Indicators:
By the very nature of the supertrend indicator, it offers firm support and resistance levels for traders to enter and exit trades. Additionally, it also provides signals for setting stop losses
Disclosure: I am part of Trade Nation's Influencer program and receive a monthly fee for using their TradingView charts in my analysis.
———————————
WISH YOU ALL LUCK

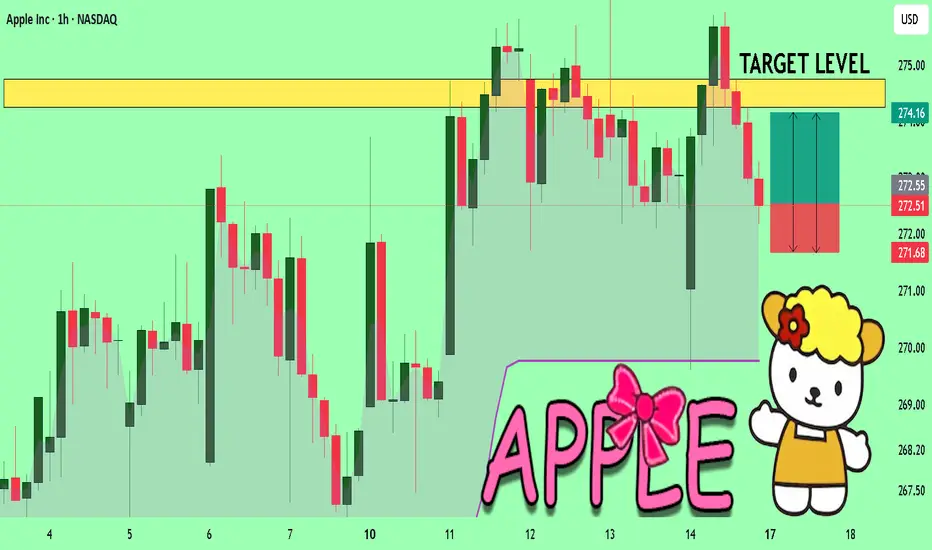
APPLE Will Explode! BUY!
My dear friends,
APPLE looks like it will make a good move, and here are the details:
The market is trading on 272.51 pivot level.
Bias - Bullish
Technical Indicators: Supper Trend generates a clear long signal while Pivot Point HL is currently determining the overall Bullish trend of the market.
Goal - 274.26
Recommended Stop Loss - 271.68
About Used Indicators:
Pivot points are a great way to identify areas of support and resistance, but they work best when combined with other kinds of technical analysis
Disclosure: I am part of Trade Nation's Influencer program and receive a monthly fee for using their TradingView charts in my analysis.
———————————
WISH YOU ALL LUCK
Gold: Healthy Correction Before a Fresh High?Hey Traders, in today's trading session we are monitoring XAUUSD for a buying opportunity around 4,135 zone, Gold is trading in an uptrend and currently is in a correction phase in which it is approaching the trend at 4,135 support and resistance area.
Trade safe, Joe.

EUR/USD - Multi Timeframe Analysis🧭 WEEKLY – Big Picture Bias (HTF Boss Level)
The weekly is consolidating inside a massive range between the mid-1.14s and the mid-1.18s.
Price has been stuck in that orange consolidation box for ages — building orders, trapping both longs and shorts.
But here’s the key:
🔥 Wave count wants a (3) push up
🔥 Structure is still bullish
🔥 Lows are protected
🔥 Liquidity is stacked ABOVE
Weekly is screaming:
➡️ “When I break out of this range, I’m sending it toward 1.20+.”
This is the expansion phase loading.
📅 DAILY – The Transition Zone
Daily just broke structure (BOS) and is pulling back into a clean Daily demand block.
This is the “engine room” for the next leg.
✔️ Trendline retest
✔️ Clean demand
✔️ Deviation → reclaim
✔️ Rejection of lower channel
And above?
📌 External BSL at the top of the channel
Price LOVES that level.
Daily bias:
➡️ Pullback → continuation into 1.17 – 1.18 zone
Daily wants to go UP.
⏳ 4H – Execution Level (Where You Actually Enter)
This is where the chess game gets spicy.
4H is sitting right above strong support with:
🔹 BOS
🔹 Retest of weak resistance
🔹 Re-entry into the channel
🔹 Daily demand just below
🔹 Perfect wave (1)(2)(3)(4)(5) corrective structure already completed
4H is showing small bearish trendline pressure,
but it’s weak — not impulsive, not HTF aligned.
So the play is:
🔻 Let price tag the daily demand (grey box)
🔺 Load the buy
🚀 Send to 1.17 – 1.1850 entry zone
Once 4H breaks that weak resistance?
It becomes a clean runway.
🎯 Full Forecast Summary (Simple Version)
HTF (Weekly)
🚀 Bullish
📌 Consolidating before expansion
🎯 Target: 1.2000 area (after breakout)
Daily
🔻 Pullback into demand
🔺 Reversal expected
🎯 Target: 1.17000 – 1.18000
4H
🟦 Buy zone: Daily demand (grey box)
🔥 BOS already complete
🎯 First target: 1.17000
🎯 Second target: 1.18500
Bias :
➡️ Bullish after retest
➡️ Continuation move is building
➡️ Lows are protected, highs are exposed
⚡ The Story the Chart is Telling
“Let me correct into demand, tag the daily block, kick the weak trendline away…
then I’m flying to take every BSL above.”
This is clean SMC + Elliott alignment.
Textbook.

EUR/USD - Forecast🟦 EUR/USD – Next Move Forecast (4H)
🧠 Market Story Right Now
Price just tapped into that mini BSL and rejected — classic liquidity grab.
Below it, we’ve got a 71% retracement zone + mini demand block, which is exactly where price is chilling now.
This is the decision-making area.
HTF is still leaning bullish,
STF is doing a small correction,
So we’re in a classic “pullback before continuation” setup.
🧊 1. The Pullback Zone Is Loaded
The shaded 4H IMB (inefficiency) + 71% + last B.O.S area…
Everything screams:
➡️ “Let me correct, rebalance, and then send it.”
Perfect spot for smart-money entries.
📈 2. What’s Likely Next?
Scenario A (Most Probable): Bullish Continuation 🚀
Price dips slightly deeper into the grey demand block →
fills remaining imbalance →
accumulates →
then punches back upward toward that external BSL at 1.17000+.
This aligns with:
HTF direction
BOS structure
Liquidity roadmap
IMB fill
BSL magnet above
This is your rocket setup.
Scenario B (If Support Fails): Deeper Sweep Then Up
If price breaks below the grey demand block cleanly,
expect a sweep down into the orange 4H IMB.
That level holds strong historical reaction.
Wicks into it = huge buy signal.
Then same outcome: bullish continuation.
So downside is liquidity business — not trend reversal.
💡 3. Bias Summary
🔥 Bias : Bullish after rebalancing
📍 Buy Zone : Grey 4H IMB / 71% retracement
🎯 Target : 1.16800 – 1.17200 (external BSL)
🚨 Invalidation : Hard close below orange IMB
⚡ Flow: Pullback → Rebalance → Send it
📝 4. What the Chart Is REALLY Saying
“Let me wick down, catch liquidity, refill the imbalance…
then I’m off to hunt that BSL above.”
This is exactly how EUR/USD likes to move — slow pullback, quick expansion.

Gold - Next move🟡 GOLD – NEXT MOVE (Forecast)
This chart is screaming HTF correction vibe, lining up for a bigger rocket-launch leg once price finishes doing its clean-up job below. Let’s break it down 👇
🧱 1. Strong Resistance Above – The Big Ceiling
Price got smacked from that external BSL zone up top. That level is no joke — heavy sell orders sitting there, and the market reacted exactly as expected.
Think of that zone like the bouncer at the club:
➡️ “Not tonight bro.”
So yeah — rejection ✔️
🔻 2. Current Move = Sweepy Pullback Energy
Price is now dripping down in a corrective way.
Nothing impulsive.
Nothing aggressive.
Just a classic “let me grab liquidity before I send it” pullback.
We've already seen internal sell-side taken…
But the real bag sits lower. 👇
🧊 3. Strong Support Below – The Bounce Zone
That external SSL + demand block + trendline confluence zone is STACKED.
This is the place where market makers love to refill the engine before a major up-leg.
Expect price to:
✔️ Sweep liquidity
✔️ Tap the demand
✔️ Tag trendline
✔️ Rebalance the inefficiency
➡️ THEN send it 🚀
Basically…
“dip for the drip.”
📈 4. What’s Likely Next? (The Forecast)
Here’s the clean sequence:
🔻 Step 1 — Price dips into strong support
Red arrow on your chart nails the idea.
Expect that slow grind down, maybe a wick flush to catch late sellers.
🔄 Step 2 — Reversal formation
Small accumulation
Fake break
Wick trap
All the usual suspects.
🚀 Step 3 — Explosive rally back toward major resistance
Once demand holds, expect a fast, impulsive, and clean leg right back into the 4,300+ resistance zone.
This is where wave traders, SMC traders, and Elliott heads all agree:
BIG MOVE LOADING.
Wave (iii) also aligns perfectly with this.
🧭 5. Summary (Trader Friendly)
🔥 HTF = bullish (correction before continuation)
🧊 STF = bearish pullback into demand
🛒 Ideal Buy Zone = strong support + SSL
🎯 Target = 4,300 – 4,350
🚀 Bias = bullish after the sweep
⚠️ Avoid buying early — let the liquidity grab play out

DXY Is Very Bullish! Buy!
Here is our detailed technical review for DXY.
Time Frame: 1D
Current Trend: Bullish
Sentiment: Oversold (based on 7-period RSI)
Forecast: Bullish
The market is on a crucial zone of demand 99.274.
The oversold market condition in a combination with key structure gives us a relatively strong bullish signal with goal 101.270 level.
P.S
Overbought describes a period of time where there has been a significant and consistent upward move in price over a period of time without much pullback.
Like and subscribe and comment my ideas if you enjoy them!

GBPJPY Will Grow! Buy!
Please, check our technical outlook for GBPJPY.
Time Frame: 15h
Current Trend: Bullish
Sentiment: Oversold (based on 7-period RSI)
Forecast: Bullish
The market is trading around a solid horizontal structure 203.579.
The above observations make me that the market will inevitably achieve 206.263 level.
P.S
The term oversold refers to a condition where an asset has traded lower in price and has the potential for a price bounce.
Overbought refers to market scenarios where the instrument is traded considerably higher than its fair value. Overvaluation is caused by market sentiments when there is positive news.
Like and subscribe and comment my ideas if you enjoy them!

GOLD Is Going Up! Long!
Take a look at our analysis for GOLD.
Time Frame: 4h
Current Trend: Bullish
Sentiment: Oversold (based on 7-period RSI)
Forecast: Bullish
The price is testing a key support 4,087.79.
Current market trend & oversold RSI makes me think that buyers will push the price. I will anticipate a bullish movement at least to 4,161.33 level.
P.S
We determine oversold/overbought condition with RSI indicator.
When it drops below 30 - the market is considered to be oversold.
When it bounces above 70 - the market is considered to be overbought.
Like and subscribe and comment my ideas if you enjoy them!

BITCOIN BULLS ARE STRONG HERE|LONG
BITCOIN SIGNAL
Trade Direction: long
Entry Level: 94,455.28
Target Level: 99,915.03
Stop Loss: 90,789.10
RISK PROFILE
Risk level: medium
Suggested risk: 1%
Timeframe: 3h
Disclosure: I am part of Trade Nation's Influencer program and receive a monthly fee for using their TradingView charts in my analysis.
✅LIKE AND COMMENT MY IDEAS✅

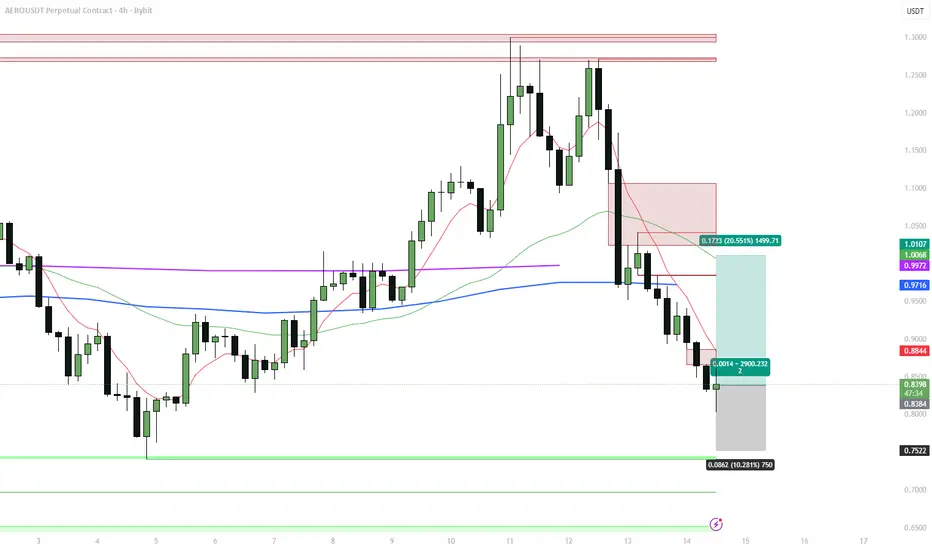
AEROUSDT 4H – EMA Deviation Long on Base Liquidity Engine1. Setup
Aerodrome is still the main liquidity flywheel on Base and is now set to merge with Velodrome into a single AERO token that will also live on Ethereum and Circle’s ARC. After the post-news flush, price on Bybit perps sits around 0.84–0.85, below the 4H EMA band and inside my demand + deviation zone.
I’m taking a 4H EMA Deviation long with a swing horizon of ~1–3 days.
2. Technical context (4H)
The local trend topped near 1.10–1.12, where multiple higher-TF order blocks sit. From there we got a clean breakdown through the 4H EMA ribbon and a series of lower lows into the green demand cluster around 0.82–0.84.
Current trade levels on the chart:
Entry: 0.842
Stop: 0.758 (below demand and the last capitulation wick)
Target: 1.014–1.02 (4H EMA re-test + prior consolidation / supply)
That’s roughly +20.5% upside vs −10.3% downside, R:R ≈ 2:1.
The 4H deviation sits above its average “stretched” reading, so the setup fits my mean-reversion rules rather than chasing trend.
3. Strategy statistics – 4H EMA Dev Long (AERO)
Backtest on this pair / timeframe: 26 trades, long only.
Winrate: 80.77%
Avg PnL per trade: +8.24%
Avg winner: +10.98%
Avg loser: −3.28% → win/loss size ratio ≈ 3.34
Largest winner: +25.17%, largest loser: −5.67%
Avg duration: 24 bars, winners around 21 bars, losers ~36 bars
Historically, losers are shallow but drag out longer; if this bounce doesn’t materialise within a typical 20–24 bar window, I’d rather cut than sit through slow bleed.
4. Fundamentals & narrative
Active positives right now:
Merge with Velodrome into one protocol and token (“AERO”) launching on Ethereum + Circle’s ARC. Existing Aerodrome holders are set to receive 94.5% of the new supply – strong alignment for current AERO holders.
Aerodrome controls ~53% of Base’s ~$4.7B DeFi TVL via ve(3,3) mechanics. About 45% of AERO is locked with an average remaining lock of 2.8 years, and protocols compete for veAERO via $2–4M weekly bribes, generating 35–45% APR from real fees, not emissions.
Narrative kicker: deposit tokens from JPMorgan reportedly already operating on Base, with the chain framed as a “default banking L2”. If that flow scales, first-order liquidity beneficiaries are AERO, lending, and major DEX routes on Base.
Expired but still relevant context:
Programmatic buybacks via the Public Goods Fund – over 150M AERO acquired and 4y-locked across PGF, Flight School, Relay.
Aerodrome crossed into deflation in September 2025, with cumulative $400M+ fees and a model where 100% of DEX revenue goes to veAERO lockers.
Large strategic lockers include Coinbase and Animoca, strengthening the “institutional Base” story.
Score: BBB+ / Positive, with key risks in narrative overextension (Base banking thesis needs confirmation), merge execution, and general market beta.
5. Trade plan & invalidation
Idea: play a mean-reversion bounce from 4H demand + EMA deviation back into the 1.00+ supply zone, while the Base / merge narrative is still hot and fee flows stay strong.
If price closes 4H below 0.758 and can’t quickly reclaim the EMA ribbon, I treat the setup as invalid and step aside – that would indicate a deeper reset of the whole move from 0.70. If we tag 1.00–1.02, I’ll realise most of the position there and only trail a small runner in case the merge and Base catalysts trigger a new leg to fresh highs.
Not financial advice – just documenting a systematic EMA Deviation long on one of the key Base liquidity primitives.
BTC - Fear & GreedAs Bitcoin falls below $100,000, now is a good time to check the Fear & Greed index to map out the sentiment around the move, and to compare similar scores at other places in this bull run move.
As painful as it may be, buying the fear and selling the green is an effective strategy. Every local bottom since the start of 2023 has had a F&G score below 50:
Jan 26th 2023 - 26
March 10th 2023 - 34
June 14th 2023 - 46
Sept 11th 2023 - 40
July 7th 2024 - 29
Aug 5th 2024 - 26
Sept 6th 2024 - 22
Feb 26th 2025 - 21
March 10th 2025 - 20
April 8th 2025 - 24
Today - 16
As of writing the current fear and greed score is lower than it has been for nearly three years!
What is important to note is that bullish momentum has faded but structure remains (higher lows + higher highs). IF the pattern continues then this is a good place to buy historically, obviously that does not guarantee the same pattern will continue to play out but if the bull market is still alive then this level usually gets a bullish reaction.
The timing also adds another layer of complexity as the US Government shutdown is ending. Bitcoin is super reactive to liquidity, once the shut down began it is clear liquidity did drop resulting in price falling. This correlation implies an expected rise in liquidity and Bitcoins price along with it.
For the bears the target area is $89,000-$92,000. In my opinion this will cap the downside at least temporarily.

GOLD On The Rise! BUY!
My dear friends,
Please, find my technical outlook for GOLD below:
The instrument tests an important psychological level 4125.1
Bias - Bullish
Technical Indicators: Supper Trend gives a precise Bullish signal, while Pivot Point HL predicts price changes and potential reversals in the market.
Target - 4139.79
Recommended Stop Loss - 4117.21
About Used Indicators:
Super-trend indicator is more useful in trending markets where there are clear uptrends and downtrends in price.
Disclosure: I am part of Trade Nation's Influencer program and receive a monthly fee for using their TradingView charts in my analysis.
———————————
WISH YOU ALL LUCK

GBPJPY: Long Trade with Entry/SL/TP
GBPJPY
- Classic bullish formation
- Our team expects pullback
SUGGESTED TRADE:
Swing Trade
Long GBPJPY
Entry - 202.77
Sl - 202.54
Tp - 203.28
Our Risk - 1%
Start protection of your profits from lower levels
Disclosure: I am part of Trade Nation's Influencer program and receive a monthly fee for using their TradingView charts in my analysis.
❤️ Please, support our work with like & comment! ❤️

EURJPY Sellers In Panic! BUY!
My dear subscribers,
This is my opinion on the EURJPY next move:
The instrument tests an important psychological level 179.30
Bias - Bullish
Technical Indicators: Supper Trend gives a precise Bullish signal, while Pivot Point HL predicts price changes and potential reversals in the market.
Target - 179.52
My Stop Loss - 179.18
About Used Indicators:
On the subsequent day, trading above the pivot point is thought to indicate ongoing bullish sentiment, while trading below the pivot point indicates bearish sentiment.
Disclosure: I am part of Trade Nation's Influencer program and receive a monthly fee for using their TradingView charts in my analysis.
———————————
WISH YOU ALL LUCK
