BTC: Fed Fuel Ignites the Next Leg UpBTC's coiling like a spring between $116.5k support and $118.5k resistance, with smart money reloading post-rate cut while retail chases shadows. The Fed's 25bps trim is the cheat code here—liquidity's flowing, on-chain whales are backing the truck, and technicals scream bounce to $119k as DXY dips.
Entry zone: $117k-$117.5k for that low-risk long. TP1 at $118.5k (quick scalp), TP2 $119.5k if momentum sticks. SL tight at $116.5k to avoid the flush.
This setup's classic: Crowd's neutral-greedy, but we're thinking like institutions—patience shakes out the weak hands before the real move. Don't FOMO the chop; scoop the dip.
Long-signal

USD/CAD - Forecast 13/9🕰 Weekly
Price has been holding inside a swing range with support around 1.36 – 1.37 and resistance higher near 1.46. Structure hints at a bigger bullish leg if buyers step in.
📅 Daily
Market is pressing against a descending trendline and sitting in a parallel channel. Demand is building around 1.37 – 1.38, while upside targets point toward 1.41 – 1.42 if broken.
⏱ 8H
Price recently swept liquidity below (BSL) and is now coiling under resistance. If we hold 1.37 support, the path opens for a push into 1.40 – 1.41.
🎯 Outlook
Bullish Case: Hold above 1.37 → breakout toward 1.40 – 1.42.
Bearish Case: Lose 1.37 → deeper correction back toward 1.35 demand.
⚖️ Bias : Short-term consolidation → mid-term bullish toward 1.40+.
Thanks traders and like and follow if you agree

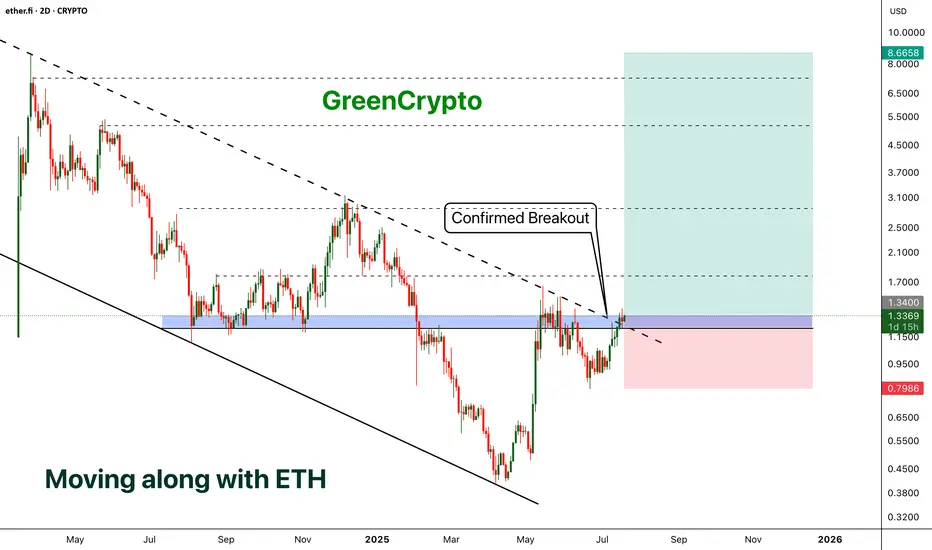
ETHFI - Moving along with the ETH- ETHFI has finally broken out from the descending channel pattern and now price is above the trending resistance line.
- We can expect a minor reversal (chances are less ) and parabolic move from here.
- I'm expecting at-least 500+% profit from this opportunity
Entry Price: 1.3384
Stop Loss: 0.7965
TP1: 1.7657
TP2: 2.5436
TP3: 4.5055
TP4: 5.6136
TP5: 8.5626
Max Leverage 5x.
Don't forget to keep stoploss.
Support us by Liking and following.
Thanks and Cheers!
GreenCrypto
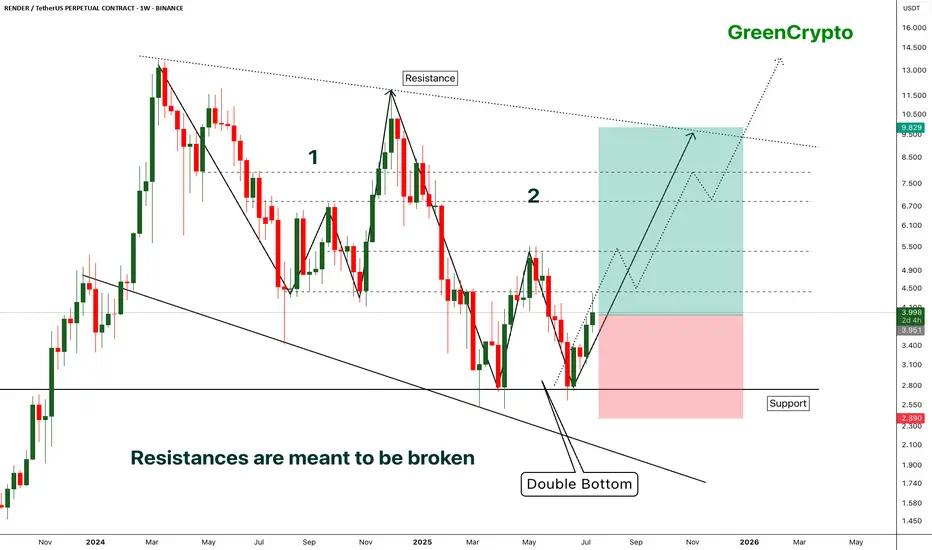
RENDER - [Double bottom] - Resistances are meant to be broken- RENDER has successfully bounced back from the support by forming the double bottom pattern.
- Double bottom pattern is bullish pattern, when it forms at the strong support it becomes extremely bullish. this is one of such scenario.
- Im expecting some minor resistance at the local resistance around 4.3
- A successfull breakout this local resistance will push the price further high.
Entry Price: 3.941
Stop Loss: 2.378
TP1: 4.413
TP2: 5.350
TP3: 6.887
TP4: 8.092
TP5: 9.810
Max Leverage 5x.
Don't forget to keep stoploss.
Support us by Liking and following.
Thanks and Cheers!
GreenCrypto
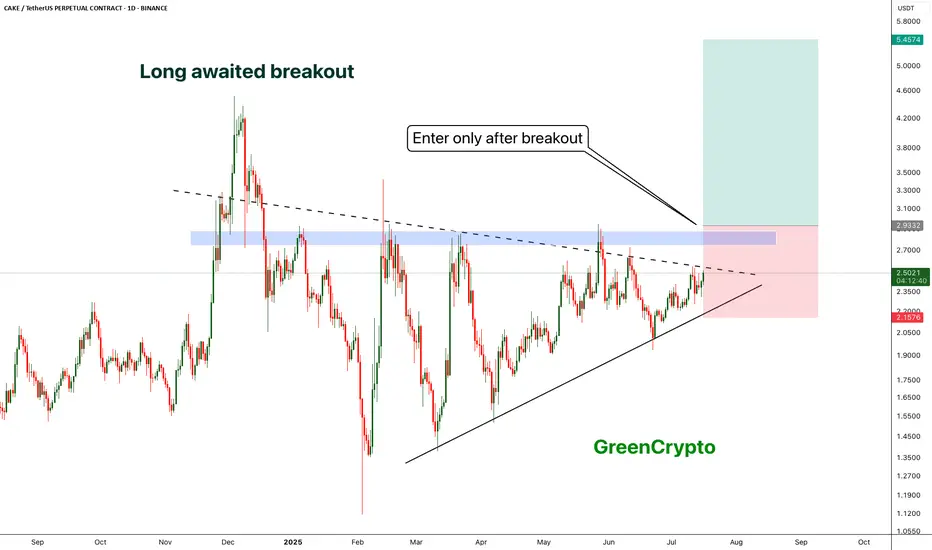
5$ is realistic target for CAKE- CAKE is trading inside the triangle since 2025
- now it seems like there is a possibility of breakout
- A clear breakout with decent volume would push the price towards 5$
- we will enter after the breakout
Entry Price: 2.9
Stop Loss: 2.15
TP1: 3.4371
TP2: 4.2671
TP3: 5.0083
Max Leverage 5x
Don't forget to keep stop loss
cheers
GreenCrypto
ICP - Perfect Long OpportunityDescription
---------------------------------------------------------------
+ ICP has started reversal inside the channel and the price is heading towards the resistance zone, this gives a bullish trade opportunity.
---------------------------------------------------------------
VectorAlgo Trade Details
------------------------------
Entry Price: 5.3
Stop Loss: 3.3
------------------------------
Target 1: 6.9
Target 2: 12.7
Target 3: 22.5
------------------------------
Timeframe: 1W
Capital Risk: 1-2% of trading amount
Leverage: 5-10x
---------------------------------------------------------------
Enhance, Trade, Grow
---------------------------------------------------------------
Feel free to share your thoughts and insights. Don't forget to like and follow us for more trading ideas and discussions.
Best Regards,
VectorAlgo

BTC - 4 Cycles Repeating Itself!Hello TradingView Family / Fellow Traders! This is Richard, also known as theSignalyst.
The picture says it all!
🔄Is history about to repeat itself?
If so, we are currently in Phase 2. 📈
What’s next? A dip toward the $75,000 zone is expected before the next impulsive move begins. 📉🚀
📚 Reminder:
Always stick to your trading plan — entry, risk management, and trade management are key.
Good luck, and happy trading!
All Strategies Are Good, If Managed Properly!
~Rich

EURJPY What Next? BUY!
My dear followers,
I analysed this chart on EURJPY and concluded the following:
The market is trading on 160.85 pivot level.
Bias -Bullish
Technical Indicators: Both Super Trend & Pivot HL indicate a highly probable Bullish continuation.
Target - 161.67
About Used Indicators:
A super-trend indicator is plotted on either above or below the closing price to signal a buy or sell. The indicator changes color, based on whether or not you should be buying. If the super-trend indicator moves below the closing price, the indicator turns green, and it signals an entry point or points to buy.
Disclosure: I am part of Trade Nation's Influencer program and receive a monthly fee for using their TradingView charts in my analysis.
———————————
WISH YOU ALL LUCK

LTO - Massive Support => Bullish Potential!Hello TradingView Family / Fellow Traders. This is Richard, also known as theSignalyst.
⚔️ LTO is retesting a massive zone , which marks the intersection of two key rejection points:
1️⃣ The $0.02 support level and psychological round number
2️⃣ The lower red trendline, acting as an oversold area
📚 According to my trading style:
As #LTO hovers around the blue circle zone, I’ll be watching for bullish reversal setups (such as a double bottom pattern, trendline break, and so on).
🏹 Moreover, from a medium-term perspective:
For the bulls to shift momentum in their favor, a break above both the upper red trendline and the blue structure is required.
📚 Always follow your trading plan regarding entry, risk management, and trade management.
Good luck!
All Strategies Are Good; If Managed Properly!
~Rich

SWING USD/JPY BUYThis swing trade highlights key points where additional sell orders might be initiated. Stay tuned for updates, as this trade will extend over several days, weeks, or even months.
This analysis relies on the provided image and should not be considered financial advice. Trading carries risks; it is essential to do your own research and seek guidance from a financial advisor before making trading decisions.

ETHUSD BUYThis analysis is based on the provided image and must not be taken as financial advice. Trading involves risks, so conducting your own research and consulting with a financial advisor before making any trading decisions is crucial.

SOLUSD BUYThis analysis is based on the provided image and must not be taken as financial advice. Trading involves risks, so conducting your own research and consulting with a financial advisor before making any trading decisions is crucial.

BTCUSD BUYThis analysis is based on the provided image and must not be taken as financial advice. Trading involves risks, so conducting your own research and consulting with a financial advisor before making any trading decisions is crucial.

USD/JPY BUYThis analysis is based on the provided image and should not be considered financial advice. Trading involves risks, and it is essential to conduct your own research and consult with a financial advisor before making any trading decisions.

USD/JPY LONGThis analysis is based on the provided image and should not be considered financial advice. Trading involves risks, and it is essential to conduct your own research and consult with a financial advisor before making any trading decisions.

Sui Ecosystem Tokens: Analysis of DEEP and NS Pattern Similariti Today, I conducted a detailed technical analysis of two tokens from the Sui ecosystem — DEEP and NS. Despite their different price ranges, both assets demonstrate similar price movement patterns. Here are the key points:
1 Growth Phase — Both tokens showed a strong upward surge, forming an initial bullish trend (green zone).
2 Correction — After the sharp growth, a correction followed, represented by a downward movement (red zone).
3 Support Level — Both tokens reached a strong support zone (blue area), where initial recovery signals appeared.
4 Potential Upward Surge — Both tokens formed a similar potential "growth wave" (blue zone), promising the continuation of an upward trend.
In DEEP, we observed a +106.99% increase, while NS shows a potential rise of up to +90.68%. This is a great example of similar patterns that can help predict future price movements.
Why is this important?
The similarity in token behavior helps in making more accurate market predictions. If NS follows DEEP's pattern, it opens exciting opportunities for traders.
What do you think of this analysis? Share your thoughts in the comments!

LTC - LONG The chart shows a clear pattern of repeated growth cycles for the LTC coin. Each cycle starts from an accumulation zone (marked on the chart), followed by a strong impulsive upward movement.
What does this mean?
After each accumulation phase, we observed significant price increases of 63-78%. Now, LTC is again in the accumulation zone, which could indicate a potential breakout upward.
Potential target:
If the coin repeats its historical behavior, an increase of 60-70% from current levels is expected, which could lead to a price range of approximately $110-120.

MNT - Analysis on ByBit Exchange📊 The chart shows the formation of a global descending wedge, which could indicate a potential price breakout. The MNT coin, traded on the ByBit exchange, is currently showing gradual accumulation in the support zone. A possible bounce from this zone is expected, with an upward movement towards the target of $0.80, which represents approximately 41.95% growth from the current level.
💡 Why is this important?
MNT is ByBit's native coin, which is essential for participation in various promotions, bonus programs, and exclusive offers. That’s why demand for this coin remains stable, and its growth potential is far from exhausted.

XAUUSD (Gold) Long-Term Buy SignalFollowing our previous Gold analysis, now we can see, that the resistance trendline has been broken. Currently XAUUSD has pulled back significantly, which we believe is a very good price for the buyers.

COPPER - Following Gold?Hello TradingView Family / Fellow Traders. This is Richard, also known as theSignalyst.
📈 COPPER has been overall bullish, trading inside the rising wedge pattern in blue.
At present, COPPER is undergoing a correction phase and it is hovering around the lower bound of the wedge.
Moreover, it is retesting a massive support zone marked in green.
🏹 Thus, the highlighted blue circle is a strong area to look for buy setups as it is the intersection of the green support and lower blue trendline acting as a non-horizontal support.
📚 As per my trading style:
As #COPPER approaches the blue circle zone, I will be looking for bullish reversal setups (like a double bottom pattern, trendline break , and so on...)
📚 Always follow your trading plan regarding entry, risk management, and trade management.
Good luck!
All Strategies Are Good; If Managed Properly!
~Rich

PEPE - breakout from the resistance #PEPE/USDT #Analysis
Description
---------------------------------------------------------------
+ Price is currently trading near the trendline and also hit the resistance line.
+ We can expect a consolidation in this zone.
+ Enter a long trade when resistance is broken.
---------------------------------------------------------------
VectorAlgo Trade Details
------------------------------
Entry Price: 0.00000907
Stop Loss: 0.00000780
------------------------------
Target 1: 0.00000970
Target 2: 0.00001057
Target 3: 0.00001163
------------------------------
Timeframe: 1H
Capital Risk: 1-2% of trading amount
Leverage: 5-10x
---------------------------------------------------------------
Enhance, Trade, Grow
---------------------------------------------------------------
Feel free to share your thoughts and insights.
Don't forget to like and follow us for more trading ideas and discussions.
Best Regards,
VectorAlgo

ATOM/USDT - Will the support hold ? BINANCE:ATOMUSDT (1W CHART) Technical Analysis Update
ATOM is currently trading at $6.786 and the price has reached it's support level and this support level held strong couple of times in the past, i'm expecting the support to hold this time. The trade is invalid if the candle closes below the support zone.
Entry level: $ 6.788
Stop Loss Level: $
TakeProfit 1: $ 8.050
TakeProfit 2: $ 10.629
TakeProfit 3: $ 13.189
TakeProfit 4: $ 17.218
TakeProfit 5: $ 25.846
TakeProfit 6: 38.797
Max Leverage: 3x
Position Size: 1% of capital
Remember to set your stop loss.
Follow our TradingView account for more technical analysis updates. | Like, share, and comment your thoughts.
Cheers
GreenCrypto

ICP - Support holding strong, bounce back expectedBINANCE:ICPUSDT (1W CHART) Technical Analysis Update
ICP is currently trading at $79 and price has made significant retrace and currently it is around the support zone. We are expecting this support zone to hold price to bounce back from this support zone. We can enter a long term trade here and do DCA if the price falls down
If the weekly candle closes below the support zone then we can enter a short trade.
Entry level: $ 7.9
Stop Loss Level: $ 5.0
TakeProfit 1: $ 10.181
TakeProfit 2: $ 13.506
TakeProfit 3: $ 19.259
TakeProfit 4: $ 30.912
TakeProfit 5: $ 52.987
TakeProfit 6: $ 76.559
Max Leverage: 2x
Position Size: 1% of capital
Remember to set your stop loss.
Follow our TradingView account for more technical analysis updates. | Like, share, and comment your thoughts.
Cheers
GreenCrypto
