EURUSD: Bullish Continuation
The charts are full of distraction, disturbance and are a graveyard of fear and greed which shall not cloud our judgement on the current state of affairs in the EURUSD pair price action which suggests a high likelihood of a coming move up.
Disclosure: I am part of Trade Nation's Influencer program and receive a monthly fee for using their TradingView charts in my analysis.
❤️ Please, support our work with like & comment! ❤️
LONG

CHFJPY: Long Trade with Entry/SL/TP
CHFJPY
- Classic bullish formation
- Our team expects pullback
SUGGESTED TRADE:
Swing Trade
Long CHFJPY
Entry - 193.02
Sl - 192.78
Tp - 193.50
Our Risk - 1%
Start protection of your profits from lower levels
Disclosure: I am part of Trade Nation's Influencer program and receive a monthly fee for using their TradingView charts in my analysis.
❤️ Please, support our work with like & comment! ❤️

EDENUSDT Glory WeekEDEN tapped into raw momentum, ripping upward before cooling off into a smooth pullback. The structure still favors the bulls, and support is holding strong.
If EDEN catches fresh volume, a sharp rebound toward previous highs isn’t far. This chart looks like it wants another run.

EURJPY: Bullish Continuation & Long Trade
EURJPY
- Classic bullish pattern
- Our team expects retracement
SUGGESTED TRADE:
Swing Trade
Buy EURJPY
Entry - 180.58
Stop - 180.40
Take - 180.91
Our Risk - 1%
Start protection of your profits from lower levels
Disclosure: I am part of Trade Nation's Influencer program and receive a monthly fee for using their TradingView charts in my analysis.
❤️ Please, support our work with like & comment! ❤️

USDJPY My Opinion! BUY!
My dear friends,
USDJPY looks like it will make a good move, and here are the details:
The market is trading on 155.33 pivot level.
Bias - Bullish
Technical Indicators: Supper Trend generates a clear long signal while Pivot Point HL is currently determining the overall Bullish trend of the market.
Goal - 156.16
About Used Indicators:
Pivot points are a great way to identify areas of support and resistance, but they work best when combined with other kinds of technical analysis
Disclosure: I am part of Trade Nation's Influencer program and receive a monthly fee for using their TradingView charts in my analysis.
———————————
WISH YOU ALL LUCK

GBPAUD On The Rise! BUY!
My dear friends,
Please, find my technical outlook for GBPAUD below:
The instrument tests an important psychological level 2.0138
Bias - Bullish
Technical Indicators: Supper Trend gives a precise Bullish signal, while Pivot Point HL predicts price changes and potential reversals in the market.
Target - 2.0217
About Used Indicators:
Super-trend indicator is more useful in trending markets where there are clear uptrends and downtrends in price.
Disclosure: I am part of Trade Nation's Influencer program and receive a monthly fee for using their TradingView charts in my analysis.
———————————
WISH YOU ALL LUCK

XAUUSD Long: Channel Support Holding — Buyers Target 4,300 ZoneHello, traders! The price auction for XAUUSD has been unfolding within a clearly structured bullish progression after a period of heavy distribution inside the Supply Zone. Earlier, gold established a wide Range between the Supply and Demand areas, with multiple sharp rejections forming the top of the structure. Eventually, sellers pushed the price lower, initiating a corrective decline that developed into a well-defined Triangle Pattern, marked by a descending Triangle Supply Line and a rising Triangle Demand Line. This compression ended with a clean breakout to the upside, signaling the beginning of a new bullish phase. Following the breakout, XAUUSD formed a Pivot Point near the mid-range level, where price briefly rejected before continuing its upward trajectory. Another notable phase was the formation of an inverse Head-and-Shoulders structure, confirming buyer strength after a fake breakout below the neckline. This reversal pattern provided the foundation for the current bullish continuation.
Currently, gold is trading inside a strong Ascending Channel, respecting both channel boundaries with consistent higher highs and higher lows. The latest breakout from the mid-channel zone has kept the bullish structure intact, and after a corrective pullback to the lower channel boundary, price is attempting to resume upward movement. As long as price holds within this channel, the market dynamics favor a continuation toward the 4,300 resistance target, which aligns with the upper boundary of the channel and the previously broken structure.
My scenario for the development of events is bullish, with expectations of a rebound from the lower channel boundary followed by a continuation toward the 4,300 resistance level. In my opinion, maintaining structure within the ascending channel supports further upside as long as buyers defend the 4,110 support region below. Manage your risk!

NZDUSD Potential UpsidesHey Traders, in today's trading session we are monitoring NZDUSD for a buying opportunity around 0.57500 zone, NZDUSD is trading in an uptrend and currently is in a correction phase in which it is approaching the trend at 0.57500 support and resistance area.
Trade safe, Joe.

GBPUSD Potential UpsidesHey Traders, in tomorrow's trading session we are monitoring GBPUSD for a buying opportunity around 1.32000 zone, GBPUSD is trading in an uptrend and currently is in a correction phase in which it is approaching the trend at 1.32000 support and resistance area.
Trade safe, Joe.

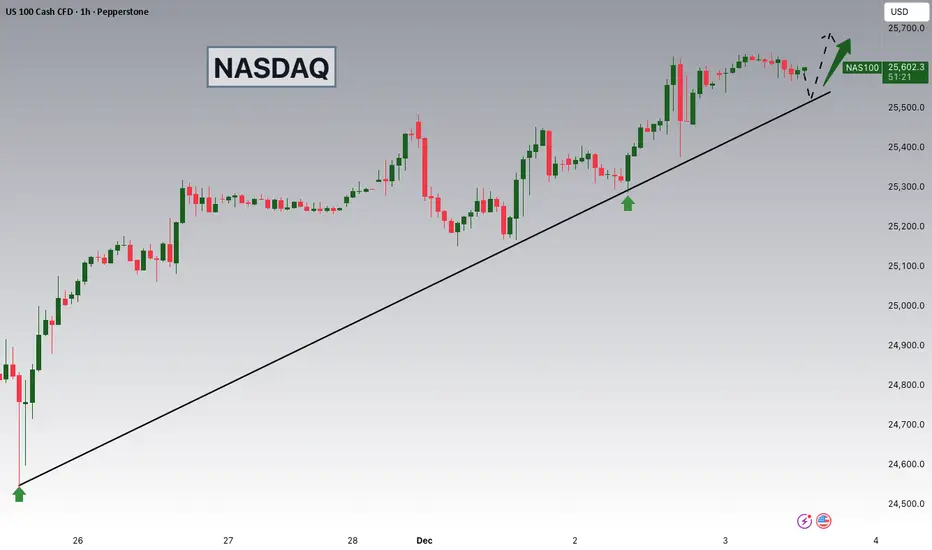
NASDAQ Potential UpsidesHey Traders, in today's trading session we are monitoring NAS100 for a buying opportunity around 25,520 zone, NASDAQ is trading in an uptrend and currently is in a correction phase in which it is approaching the trend at 25,520 support and resistance area.
Trade safe, Joe.
EUR/NZD BULLS ARE STRONG HERE|LONG
Hello, Friends!
We are targeting the 2.028 level area with our long trade on EUR/NZD which is based on the fact that the pair is oversold on the BB band scale and is also approaching a support line below thus going us a good entry option.
Disclosure: I am part of Trade Nation's Influencer program and receive a monthly fee for using their TradingView charts in my analysis.
✅LIKE AND COMMENT MY IDEAS✅

EUR/AUD LONG FROM SUPPORT
EUR/AUD SIGNAL
Trade Direction: long
Entry Level: 1.763
Target Level: 1.766
Stop Loss: 1.761
RISK PROFILE
Risk level: medium
Suggested risk: 1%
Timeframe: 1h
Disclosure: I am part of Trade Nation's Influencer program and receive a monthly fee for using their TradingView charts in my analysis.
✅LIKE AND COMMENT MY IDEAS✅

GOLD SHOOK THE MARKET – STRUCTURE STILL UNBREAKABLE!📌 CURRENT MARKET UPDATE (GOLD – 4H)
The market continues to respect the wave structure exactly as projected:
- Wave (1) – (2) has already completed
- Wave (3) tapped into the Liquidity zone 4250–4260, creating a clean corrective reaction
- Price is currently in a technical retest phase, perfectly normal within a strong macro uptrend
🎯 Key Level to Watch
The Swing Zone 4147–4150 remains solid — this is the core foundation of the entire bullish structure.
- Only if this zone breaks will the trend lose strength
- EMA34 & EMA89 continue trending upward, acting as strong dynamic support
✅ Main Scenario (High Probability)
Price makes a mild correction before pushing up to complete Wave (5) of (3).
Expected pullback zones:
🔹 4210 – 4180
🔹 Reaction confirmation → bullish continuation toward:
- 4310 – 4325 (Resistance)
- 4365 – 4370 (Liquidity – Completion of Wave (C))
Current liquidity flow still favors buy setups at support retest.
⚠️ Sub-Scenario (Low Probability)
If a 4H candle closes below 4147 → deeper correction toward EMA200 (4060–4080).
↳ Currently, there is NO sign of this scenario.
✅ TODAY’S TREND SUMMARY
Trend: Corrective – Accumulation
Optimal Buy Zones: 4210 → 4180 → 4150
Targets:
- 4310 – 4325
- 4365 – 4370
Trend invalidation: Break 4147

EURGBP: Market of Buyers
The price of EURGBP will most likely increase soon enough, due to the demand beginning to exceed supply which we can see by looking at the chart of the pair.
Disclosure: I am part of Trade Nation's Influencer program and receive a monthly fee for using their TradingView charts in my analysis.
❤️ Please, support our work with like & comment! ❤️

AUDNZD: Long Signal Explained
AUDNZD
- Classic bullish setup
- Our team expects bullish continuation
SUGGESTED TRADE:
Swing Trade
Long AUDNZD
Entry Point - 1.1432
Stop Loss - 1.1424
Take Profit - 1.1446
Our Risk - 1%
Start protection of your profits from lower levels
Disclosure: I am part of Trade Nation's Influencer program and receive a monthly fee for using their TradingView charts in my analysis.
❤️ Please, support our work with like & comment! ❤️

CADJPY Will Explode! BUY!
My dear friends,
CADJPY looks like it will make a good move, and here are the details:
The market is trading on 111.25 pivot level.
Bias - Bullish
Technical Indicators: Supper Trend generates a clear long signal while Pivot Point HL is currently determining the overall Bullish trend of the market.
Goal - 111.43
Recommended Stop Loss - 111.15
About Used Indicators:
Pivot points are a great way to identify areas of support and resistance, but they work best when combined with other kinds of technical analysis
Disclosure: I am part of Trade Nation's Influencer program and receive a monthly fee for using their TradingView charts in my analysis.
———————————
WISH YOU ALL LUCK

USDCHF: Swing Trading & Technical Analysis
Our strategy, polished by years of trial and error has helped us identify what seems to be a great trading opportunity and we are here to share it with you as the time is ripe for us to buy USDCHF.
Disclosure: I am part of Trade Nation's Influencer program and receive a monthly fee for using their TradingView charts in my analysis.
❤️ Please, support our work with like & comment! ❤️

USDCAD Will Go Higher! Buy!
Here is our detailed technical review for USDCAD.
Time Frame: 1h
Current Trend: Bullish
Sentiment: Oversold (based on 7-period RSI)
Forecast: Bullish
The market is approaching a key horizontal level 1.394.
Considering the today's price action, probabilities will be high to see a movement to 1.399.
P.S
Please, note that an oversold/overbought condition can last for a long time, and therefore being oversold/overbought doesn't mean a price rally will come soon, or at all.
Like and subscribe and comment my ideas if you enjoy them!

Gold (XAUUSD) – Eyeing a Sweep Toward 4273–4281Gold continues to show intraday strength after holding above recent higher-low structure.
The current bullish leg appears corrective in nature, with price aiming toward the
4273–4281 supply zone highlighted on the chart.
From a fundamental perspective, demand for gold remains supported as markets weigh
the possibility of softer U.S. economic data and expectations of future Fed easing in 2026.
Risk-off flows have also kept buyers active on dips. As long as price holds its internal
bullish structure, a push into the overhead imbalance remains likely.
I’ll be watching how price reacts once it reaches the 4273–4281 zone — this area could
offer a reaction or potential short-term reversal depending on order flow.

Gold Potential UpsidesHey Traders, in today's trading session we are monitoring XAUUSD for a buying opportunity around 4,185 zone, Gold is trading in an uptrend and currently is in a correction phase in which it is approaching the trend at 4,185 support and resistance area.
Trade safe, Joe.

EURUSD Potential UpsidesHey Traders, in today's trading session we are monitoring EURUSD for a buying opportunity around 1.15800 zone, EURUSD is trading in an uptrend and currently is in a correction phase in which it is approaching the trend at 1.15800 support and resistance area.
Trade safe, Joe.

BTCUSD Long: Volatility Rising — Retest of 90,000 ExpectedHello, traders! The price auction for BTCUSD has been in a corrective phase, forming a broad descending structure guided by the major Trend Line. This bearish pattern has been defined by a sequence of lower highs and lower lows, with price repeatedly getting rejected from the Supply Zone and consolidating inside the highlighted range. The market has respected both the descending supply line and the rising Demand Line, creating a well-defined compression of price action.
Currently, the auction is at a critical inflection point, with BTC retesting the Demand Line near the 85,600 demand level. After a series of volatile moves inside the range, the price is attempting to stabilize at this structural support while gradually approaching the descending trendline once again. This tightening of volatility between supply and demand suggests that a significant directional move is likely to occur soon.
My scenario for the development of events is a bullish rebound from the Demand Line, followed by a test of the descending supply line. I expect the price to attempt an impulsive breakout toward the major Supply Zone. In my opinion, a successful breakout above this zone may carry BTC toward the 92,300 resistance target marked on the chart. Manage your risk!

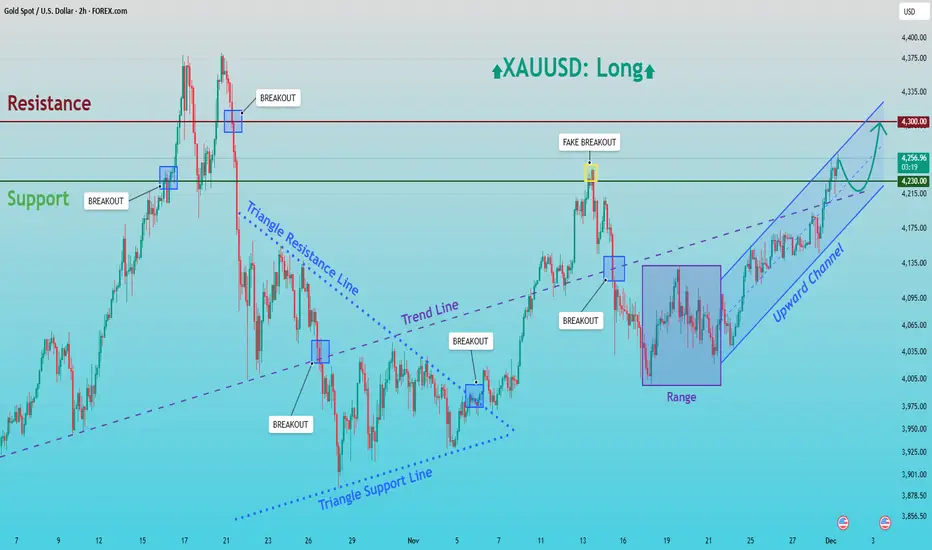
XAUUSD: Buyers Eye Retest of the $4,300 Resistance ZoneHello everyone, here is my breakdown of the current XAUUSD setup.
Market Analysis
Gold continues to trade within a well-structured bullish environment following a strong recovery from the lower Triangle Support Line earlier in the month. After a prolonged corrective phase inside a symmetrical triangle, price eventually broke above the Triangle Resistance Line, shifting the market structure from consolidation into bullish continuation. This breakout created a clear trend shift, supported by a steady sequence of higher highs and higher lows. After the breakout, XAUUSD entered a temporary Range phase, suggesting accumulation from buyers before the next impulsive move. Once price broke out of that range to the upside, the market formed a clean Upward Channel, showing sustained bullish pressure. A notable fake breakout above the Resistance Zone around 4,260 occurred recently, indicating strong seller activity at the top of the zone, but buyers quickly regained control and continued to push price upward within the channel.
Currently, gold is trading near the mid-upper area of the Upward Channel, approaching the 4,300 key Resistance Zone. The broader technical picture shows clear bullish market structure, with trendline support and channel dynamics favoring further upside as long as the channel remains intact.
My Scenario & Strategy
My scenario is bullish, supported by the strong rebound within the Upward Channel and the consistent higher-low structure. As long as price remains above the 4,215–4,230 Support Zone and respects the channel’s lower boundary, buyers hold a clear advantage. My expectation is that XAUUSD may make a minor pullback toward the mid-channel zone near 4,230 to gather liquidity before continuing the upward movement.
Therefore, the primary bullish target remains the 4,300 Resistance Zone, where a retest is highly probable. A clean breakout above 4,300 would open the door for a stronger rally and signal continuation of the broader bullish cycle. However, if gold fails to break the resistance and forms a deeper correction, the Upward Channel support and the prior breakout zone at 4,215 will be key levels to watch. The bullish bias remains valid as long as these supports hold. For now, the structure favors a long scenario with attention on the move toward 4,300 and potential bullish continuation beyond that level.
That's the setup I'm tracking. Thank you for your attention, and always manage your risk.