NZDJPY LONG CONTINUATION NZD/JPY has been making higher highs and higher lows showing a clear uptrend for a number of months.
We can see after last weeks retracement the pair has found support at 91.6 zone - which is also in line with the 100MA on the four hour. This shows a strong level of supports where buyers are ready to re enter the market to push the pair higher hopefully to create its next swing high.
TP1 - 94.017
LONG

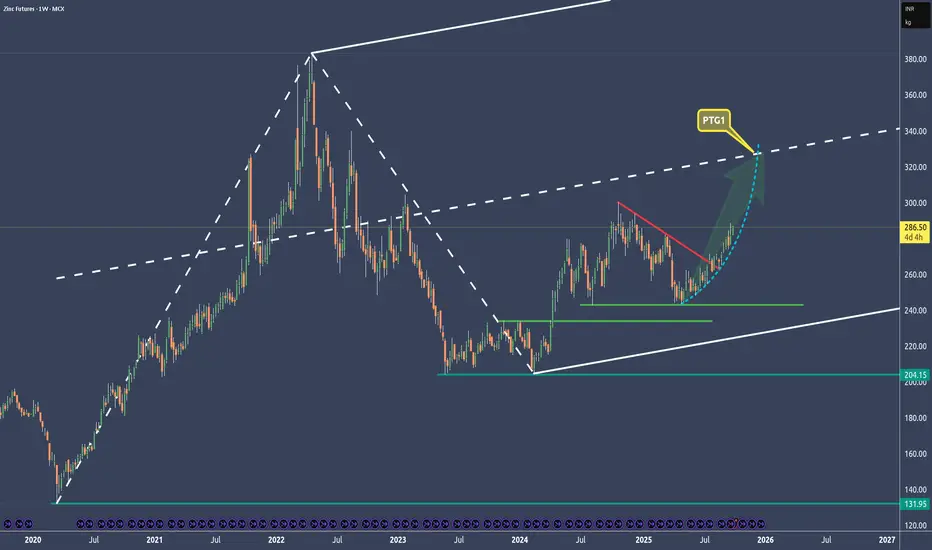
Zinc - Exponential Move To Profit Along With Copper🔱 I posted about copper and zinc on Sep 17. 🔱
Both are closely correlated, and now zinc is moving exponentially.
The target is at the centerline of course with around an 80% probability.
👉 If you think that these forks are doing a good job, then throw me booster please and check out my links. §8-)
Bitcoin Isn’t Trending — It’s CompressingBITSTAMP:BTCUSD is not in a clean trend right now. Instead, price is rotating inside a tight range, signaling compression rather than weakness after the recent liquidity sweep. Price is currently trapped inside a sideways structure between 89,700 and 90,250, with the EMA cluster flattening. This loss of slope confirms that momentum has paused, and the market has transitioned from expansion into range acceptance.
🧠 Market Structure & Liquidity
The breakdown below support earlier was not a trend continuation it was a liquidity grab. Once sell-side liquidity was cleared, price quickly reclaimed the prior support zone, trapping late shorts.
Since that reclaim:
- Higher lows are forming from the 87,800–88,400 demand zone
- Pullbacks are shallow and overlapping
- Buyers are defending aggressively, but not chasing price higher yet
This behavior is typical of institutional accumulation, not distribution.
🟩 Key Levels to Watch
Demand / Support: 87,800 – 88,400
Range Mid / Pivot: 88,800 – 89,000
Range High / Resistance: 89,700 – 90,250
📈 Primary Scenarios
Bullish Continuation (Preferred):
Price holds above demand and the rising short-term trendline
A clean H1 close above 89,700
Targets:
Target 1: 90,250
Target 2: 91,000
Extension toward higher liquidity zones if momentum expands
Bearish Invalidation:
H1 close below 87,800
Demand fails → structure breaks
Downside targets:
86,500 – 85,800 (next liquidity pool)
🌍 Macro Context
Market volatility remains compressed as traders wait for macro catalysts (Fed guidance, inflation data, ETF flows)
No strong macro impulse favors immediate expansion
This environment supports range-building and positioning, not impulsive breakouts
✅Conclusion
Bitcoin is not bearish it is coiling.
The real move begins after the range resolves, not inside it.
Trade the breakout, not the noise.

EURUSD: Demand Reclaim or Breakdown Toward Liquidity BelowFX:EURUSD has transitioned from an impulsive bullish leg into a range-bound distribution structure. Price is now pressing directly into a clearly defined demand zone (≈1.1835) that previously acted as support after the breakout. The current reaction is critical: acceptance above this zone keeps the market in a bullish continuation structure, while a clean break and close below confirms failed demand → bearish rotation.
Structurally, we see:
Lower highs forming under the resistance zone near 1.1890–1.1910
Momentum slowing, candles overlapping → compression
EMA acting as dynamic support, but flattening — signaling indecision, not strength
The marked “break out” arrow is not bullish — it highlights a potential breakdown from demand, opening downside liquidity toward 1.1790 → 1.1750 if sellers gain acceptance.
BULLISH SCENARIO:
Reclaim and hold above the demand zone → rotation higher back toward range highs / resistance.
BEARISH SCENARIO (higher probability if broken):
Loss of demand → pullback becomes a distribution top, targeting lower liquidity pockets.
MACRO CONTEXT:
EURUSD remains sensitive to USD-side catalysts (US data, rate-cut expectations). With markets pricing in policy divergence uncertainty, EUR strength on risk-off flows could be the trigger for demand failure. This aligns with the technical picture: macro pressure + technical compression = expansion coming.
TRADER TAKEAWAY:
Don’t front run.
This level decides continuation vs rotation.
Wait for confirmation the next move will not be small.

Ethereum’s Bounce Is Corrective — This Rally Is Testing SupplyEthereum is currently in a corrective bounce within a broader bearish structure. The sharp sell-off created a clear impulse leg down, and the recent recovery is showing weak follow-through, typical of a retracement rather than a reversal. Price is now approaching a well-defined resistance zone around 2,950 – 2,985, which previously acted as strong support before the breakdown. This zone is now active supply, reinforced by prior rejection wicks and overlapping candles a classic sign of distribution. The bounce itself is steep but short-lived, lacking base-building or accumulation behavior. Momentum is slowing as price reaches resistance, increasing the probability of rejection.
🧠 Market Structure & Supply–Demand
The initial drop was an impulsive sell, confirming bearish intent.
The rebound is overlapping and corrective, not impulsive.
No higher-high / higher-low structure has formed.
Sellers are defending the previous breakdown zone, signaling supply absorption failure.
This price behavior suggests short-covering, not fresh institutional buying.
🟥 Key Levels
Resistance (Supply): 2,950 – 2,985
Pivot / Reaction Zone: 2,900 – 2,920
Downside Targets:
- Target 1: 2,780
- Target 2: 2,660
- Extension: 2,520 – 2,550 (next liquidity pool)
📉 Primary Scenarios
🔴 Bearish Continuation (High Probability)
Rejection from resistance zone
Failure to reclaim and hold above 2,985
Price rolls over → continuation toward lower liquidity
Structure remains lower highs
🟢 Bullish Invalidation (Low Probability)
Strong 4H close above 3,000
Acceptance above supply zone
Follow through with volume
Only then does the bias shift neutral-to-bullish
🌍 Macro Context
Risk assets remain sensitive to rates, liquidity, and USD strength
No strong macro catalyst supporting aggressive ETH upside
Current environment favors mean reversion and distribution, not trend acceleration
ETH is moving with liquidity mechanics, not macro-driven demand.
✅ Trader’s Conclusion
This bounce is not a trend change it’s a reaction into supply.
Until Ethereum reclaims and holds above resistance, rallies remain sell-side opportunities, not long confirmations.
Let price confirm. Let structure decide.

EURUSD Is Not Reversing — It’s Distributing at SupplyEURUSD has already completed a strong impulsive rally, but price is now stalling inside a higher-timeframe supply zone, where momentum starts to compress and buyers lose follow-through. The current structure shows lower highs forming under supply, a classic sign of distribution after expansion, not continuation. Every push up is being sold faster, while downside reactions are cleaner telling us smart money is no longer chasing highs but rebalancing liquidity. Technically, this is a textbook range-to-distribution transition: rejection from supply → rotation back into the demand zone, with the EMA 89 acting as a gravity level below, aligning with the next downside target.
From a macro perspective, EURUSD is caught between ECB easing expectations and a still-resilient USD supported by relative yield strength a backdrop that favors mean reversion, not breakout continuation. Unless price can reclaim and hold above supply with acceptance, rallies remain sell-the-bounce setups, not trend entries. The market is not asking how high, but how much liquidity needs to be cleaned below before the next real decision.

ETHUSD: Grinding Higher to Hunt Liquidity Above Three ThousandEthereum just printed a classic post-liquidation recovery, and the structure tells a very clear story: after the sharp sell-off into the major support zone around 2,780–2,800, price rebounded aggressively and transitioned into a tight ascending channel, printing higher lows with controlled pullbacks. this is not impulsive euphoria, it’s acceptance and absorption. Notice how every dip holds above the rising trendline while price coils under the key resistance zone near 2,980–3,000, right where the EMA 89 is flattening that’s a textbook compression before expansion. From a trader’s logic perspective, this is a liquidity-building phase: shorts are getting uncomfortable below resistance, while late longs are forced to chase strength. Macro adds fuel here — stable risk sentiment, ETH ETF inflow expectations, and relative strength vs BTC keep downside limited as long as the broader market doesn’t flip risk-off. The play is simple and disciplined: as long as ETH holds above the rising structure, a breakout and acceptance above 3,000 opens the door toward the next upside leg, while failure and a clean loss of the channel would signal a deeper mean reversion back toward the lower demand. Until proven otherwise, this is controlled bullish continuation not distribution.

BTCUSD H1 — Support Held, Structure Is RebuildingBitcoin has cleanly defended the 87,200–87,500 support zone after a sharp sell-off, printing a sequence of higher lows that signals short-term structural repair. Price is now grinding higher along a rising trendline, but remains below the declining EMA 98, meaning this move is still corrective until proven otherwise. The key near-term test sits at 88,800–89,000 — a local lower-high resistance and dynamic EMA confluence. A confirmed reclaim and hold above this level would open the path toward 89,700 → 91,000, aligning with prior liquidity and range highs. However, failure to hold the rising trendline or a breakdown back below 87,200 would invalidate the bullish recovery and expose downside toward the 86,000 liquidity pocket.
⚠️ This is not a breakout yet. BTC is deciding whether this bounce becomes continuation or just a relief rally.

It’s Compressing Between Smart Money Supply & Unfilled Demand🔥 EURUSD H1 — Impulse Complete, Now Trapped Between Supply & Demand
EURUSD has already completed a clean impulsive expansion from the 1.1720 base, leaving a clear inefficiency / demand gap around 1.1835–1.1850. That impulsive leg signals strong participation, but price is no longer in expansion mode. it is now rotating beneath a well defined resistance zone near 1.1895–1.1910, where prior sell-side liquidity and supply are stacked. Structurally, this is post-impulse consolidation, not continuation yet. As long as price fails to reclaim and hold above the resistance zone, upside attempts remain corrective. The most probable path is range rotation: a pullback into the demand gap to rebalance liquidity before the next decision point.
From a technical supply–demand perspective, the demand zone aligns with the origin of the impulse and unmitigated orders, making it the only area where buyers are structurally justified. A clean reaction there keeps bullish structure intact; a failure would expose a deeper mean-reversion toward the rising EMA cluster below.
On the macro side, EURUSD is currently caught between USD rate expectations and Eurozone growth uncertainty. Markets are still pricing sticky U.S. inflation and a “higher-for-longer” Fed bias, which caps EUR upside near resistance. Without a clear macro catalyst (weaker U.S. data or dovish Fed repricing), EURUSD lacks the fuel for immediate breakout — reinforcing the technical expectation of pullback before continuation.
This is not a breakdown, but not a breakout either. EURUSD is compressing between supply and demand. Continuation requires demand hold + resistance reclaim otherwise, price will rotate lower to rebalance before the next macro-driven move.

USDJPY Isn’t Reversing — This Is a Classic Pullback Into Supply FX_IDC:JPYUSD on the H1 is structurally bearish. After a sharp impulsive rally, price failed to hold continuation and transitioned into a clean lower-high sequence, respecting a well-defined descending trendline. Each bounce is getting sold aggressively a textbook sign of distribution, not accumulation. The highlighted GAP zone below current price acts as a magnet for liquidity, and price is compressing toward it with weak bullish follow through, suggesting continuation lower rather than reversal. EMA alignment still favors sellers, and momentum remains corrective inside a broader downtrend.
From a macro perspective, this aligns with persistent USD weakness expectations as rate-cut narratives gain traction, while the Bank of Japan remains sensitive to excessive JPY weakness, keeping intervention risk asymmetric. That macro pressure caps upside and reinforces sell-the-rally behavior.
Bias: Short below trendline
Invalidation: Clean break and acceptance above the descending structure
Expectation: Liquidity sweep into the GAP → continuation lower unless macro sentiment flips
This is not a bottom it’s a pause before the next leg.

XAUUSD Bullish Continuation: SMC Breakout and Fair Value Gap (FVThis 4-hour chart of the Gold Spot / U.S. Dollar (XAUUSD) illustrates a strong bullish trend supported by institutional trading blocks and technical price action structures.
• Trend Analysis: The price is currently respecting an ascending parallel channel. A significant Break of Structure (BOS) occurred around the 4,900 level, confirming the shift in momentum toward the upside.
• Support & Demand: A notable Fair Value Gap (FVG) and demand zone (highlighted in green) between 4,800 and 4,900 acted as the primary launchpad for the recent rally.
• Indicators Used: The chart utilizes LuxAlgo Smart Money Concepts to identify market structure and the SMC Community script, which currently labels the sentiment as "Swing" and "Safe" for long positions.
• Trade Setup: * Current Price: Approximately 5,090.20
• Target (Take Profit): The projected green zone aims for the 5,209 level.
• Stop Loss/Invalidation: The red risk zone suggests a defensive exit if price breaks back below the 5,000 psychological level.
Summary: The overall outlook remains highly optimistic as long as the price maintains its trajectory within the ascending channel and stays above the recent consolidation zone

GBPCHF What Next? BUY!
My dear friends,
Please, find my technical outlook for GBPCHF below:
The price is coiling around a solid key level - 1.0565
Bias - Bullish
Technical Indicators: Pivot Points Low anticipates a potential price reversal.
Super trend shows a clear buy, giving a perfect indicators' convergence.
Goal - 1.0611
About Used Indicators:
The pivot point itself is simply the average of the high, low and closing prices from the previous trading day.
Disclosure: I am part of Trade Nation's Influencer program and receive a monthly fee for using their TradingView charts in my analysis.
———————————
WISH YOU ALL LUCK

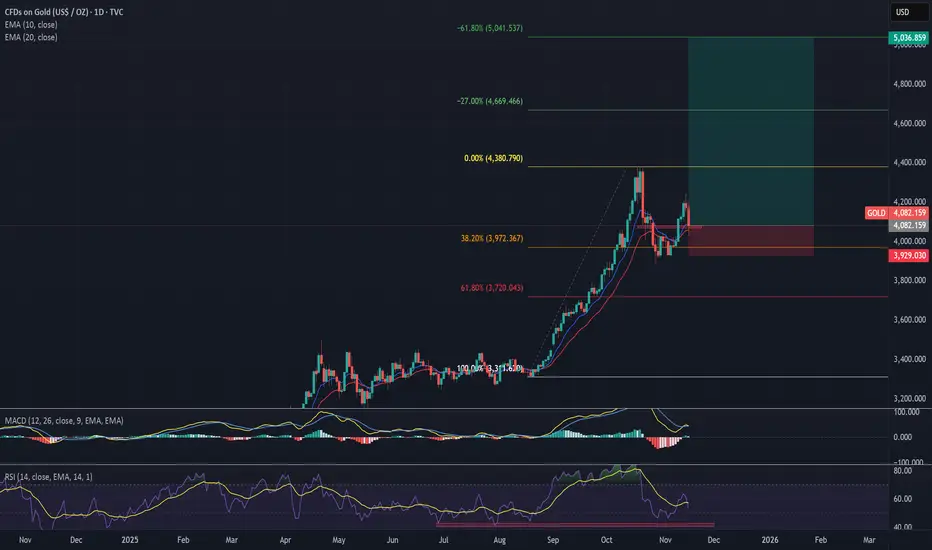
Generational Wealth | Precious Metals Super Cycle | GoldStrategy: Impulse Correction
Direction: Bullish
Moving Average: Blue above Red
Fib Retracement: 38.2 reached
MACD > 0
Support: After a massive sell-off across the board, we will look to see if gold can hold support by bouncing off the moving averages. Lets see if it can find bullish strength and regain the move experienced on Friday. If it moves lower, we could see it going back to 4000, before a potential reversal.
1st Target = 4380
2nd Target = 4669
3rd Target = 5041
Lots: 0.1 (Plan to pyramid into this one)
INSIGHTS: Precious metals continue to show strength with a weakening dollar. Pay attention to the DBC commodity Index which is indicating strength across the commodity complex. Alongside this, the DXY is sitting at an interesting level. Lets see whether will bounce at this level off a multiyear trend or whether the dollar will give way to lower lows in the coming months.
CHFJPY: Bulls Will Push
Remember that we can not, and should not impose our will on the market but rather listen to its whims and make profit by following it. And thus shall be done today on the CHFJPY pair which is likely to be pushed up by the bulls so we will buy!
Disclosure: I am part of Trade Nation's Influencer program and receive a monthly fee for using their TradingView charts in my analysis.
❤️ Please, support our work with like & comment! ❤️

NZDUSD Breakout and Potential Retrace!Hey Traders, in today's trading session we are monitoring NZDUSD for a buying opportunity around 0.58200 zone, NZDUSD was trading in a downtrend and successfully managed to break it out. Currently is in a correction phase in which it is approaching the retrace area at 0.58200 support and resistance area.
Trade safe, Joe.

EURUSD is Nearing an Important Support!Hey Traders, in today's trading session we are monitoring EURUSD for a buying opportunity around 1.18200 zone, EURUSD is trading in an uptrend and currently is in a correction phase in which it is approaching the trend at 1.18200 support and resistance area.
Trade safe, Joe.

GBPJPY Massive Long! BUY!
My dear friends,
My technical analysis for GBPJPY is below:
The market is trading on 210.57 pivot level.
Bias - Bullish
Technical Indicators: Both Super Trend & Pivot HL indicate a highly probable Bullish continuation.
Target - 211.67
About Used Indicators:
A pivot point is a technical analysis indicator, or calculations, used to determine the overall trend of the market over different time frames.
Disclosure: I am part of Trade Nation's Influencer program and receive a monthly fee for using their TradingView charts in my analysis.
———————————
WISH YOU ALL LUCK

USDJPY Technical Analysis! BUY!
My dear friends,
Please, find my technical outlook for USDJPY below:
The instrument tests an important psychological level 153.70
Bias - Bullish
Technical Indicators: Supper Trend gives a precise Bullish signal, while Pivot Point HL predicts price changes and potential reversals in the market.
Target - 154.23
Recommended Stop Loss - 153.39
About Used Indicators:
Super-trend indicator is more useful in trending markets where there are clear uptrends and downtrends in price.
Disclosure: I am part of Trade Nation's Influencer program and receive a monthly fee for using their TradingView charts in my analysis.
———————————
WISH YOU ALL LUCK

ZM - Zoom in on this one...Growing Revenue, chart stabilising...Is NASDAQ:ZM looking to make a serious move to the upside?
Our systems have identified a point of potential interest & volatility in ZM.
If price can hold above $78.21 ... Significant Bullish potential may be unlocked.
If however price falls below $78.21 ... Significant Bearish risk may come into play.
As things sit now, it seems momentum may have turned to the upside for ZM, but will it hold? Let's find out...
We're inspired to bring you the latest developments across worldwide markets, helping you look in the right place, at the right time.
Explore our profile for further updates, and we look forward to being of service along your trading & investing journey!
Disclaimer: Please note all information contained within this post and all other Bullfinder-official Tradingview content is strictly for informational purposes only and is not intended to be investment advice. Past performance is not in any way indicative of future performance. Please DYOR & Consult your licensed financial advisors before acting on any information contained within this post, or any other Bullfinder-official TV content.

CADCHF Will Go Up! Long!
Here is our detailed technical review for CADCHF.
Time Frame: 4h
Current Trend: Bullish
Sentiment: Oversold (based on 7-period RSI)
Forecast: Bullish
The market is approaching a key horizontal level 0.566.
Considering the today's price action, probabilities will be high to see a movement to 0.570.
P.S
The term oversold refers to a condition where an asset has traded lower in price and has the potential for a price bounce.
Overbought refers to market scenarios where the instrument is traded considerably higher than its fair value. Overvaluation is caused by market sentiments when there is positive news.
Like and subscribe and comment my ideas if you enjoy them!

EURUSD: Breakout continuation or bull trap?EURUSD on the H1 timeframe has just delivered a strong impulsive breakout from the prior range, leaving a clear imbalance (GAP) and confirming short-term bullish momentum. Price is now pulling back into the gap zone around 1.1835–1.1845, which is a critical decision area: if this zone holds and shows acceptance, it signals healthy continuation behavior after expansion, opening the path toward the 1.1865 and 1.1890 resistance highs. Structurally, this pullback is corrective momentum remains intact, candles are compressing rather than selling off aggressively, and the broader structure has flipped previous resistance into support. However, failure to hold the gap would invalidate the immediate bullish continuation and expose a deeper retracement toward the main support zone at 1.1750–1.1765, where buyers must defend to maintain the bullish bias.
From a macro perspective, the USD side remains sensitive to upcoming US data and Fed expectations. Any cooling inflation signals or softer US economic data would reinforce USD weakness, supporting EURUSD continuation higher. Conversely, a hawkish repricing of rate expectations or stronger US data could trigger a fake breakout scenario, pushing price back into the prior range. In short, this is not a blind buy zone. it’s a confirmation trade area: hold above the gap favors trend continuation, lose it and the market likely rotates deeper before the next directional move.

ETH bounce = resistance test, not a reversal.On the 1H timeframe, ETH remains structurally bearish despite the sharp rebound from the recent sell-off. Price is still trading below the declining EMA 98, which continues to act as dynamic resistance, aligning closely with the descending trendline a confluence that reinforces seller control. The current bounce shows corrective characteristics: overlapping candles, weak follow-through, and rejection near the 2,880–2,900 zone rather than impulsive continuation. This suggests short-covering and mean reversion, not fresh demand. As long as ETH fails to reclaim and hold above the EMA 98 with strong momentum, the dominant scenario favors another leg down, with downside targets toward 2,838 first and potentially the 2,780–2,800 demand pocket if selling pressure resumes. Only a clean break and acceptance above the EMA 98 would invalidate this bearish continuation bias.

Strong impulse, controlled pullback, and liquidity is setting TICKMILL:EURUSD has just delivered a clean bullish impulse, breaking decisively above prior intraday structure and accelerating into the 1.1880–1.1890 area before pulling back. This move was not random. it was driven by buy-side liquidity expansion after price spent time compressing below 1.1800, where sellers were repeatedly absorbed. Once that liquidity was cleared, the market expanded vertically, leaving behind an inefficient structure and a clear demand zone between 1.1830 and 1.1850. The current pause above this zone is constructive, not weak. Price is no longer trending impulsively, but rotating in a tight range, which signals acceptance above former resistance rather than rejection.
From a structure perspective, the bullish bias remains intact as long as price holds above the 1.1830 demand zone. This area represents the origin of the impulse and is where smart money typically defends long exposure. A controlled pullback into this zone would likely attract fresh buyers, especially as late sellers get trapped expecting a deeper retracement. The projected path higher is logical: first continuation toward 1.1900, followed by 1.1940, and ultimately a new upside target near 1.1975, where buy-side liquidity and prior highs are resting. Importantly, the projected pullbacks in between are healthy. they allow the market to rebalance orders and prevent an exhausted rally.
From a liquidity and market psychology standpoint, this structure favors continuation. Traders who missed the initial breakout are waiting for a retracement to enter long, while short sellers are increasingly uncomfortable above 1.1850. This imbalance often fuels the next expansion leg. On the macro side, EURUSD remains sensitive to U.S. dollar weakness, driven by shifting Federal Reserve rate expectations, U.S. yield compression, and risk-on sentiment. As long as the dollar fails to regain strength, pullbacks in EURUSD are likely to be treated as buy-the-dip opportunities, not trend reversals.
The bullish invalidation is clear and disciplined: a sustained breakdown and acceptance below 1.1830 would signal that the impulse has failed and open the door for a deeper retracement toward 1.1800 and 1.1760. Until that happens, this remains a bullish continuation structure, with demand in control and liquidity pointing higher.
Bias: Bullish above 1.1830
Key demand: 1.1830–1.1850
Upside targets: 1.1900 → 1.1940 → 1.1975
Patience here is rewarded the trend is not finished, it is reloading.
