USDCAD: Great Trading Opportunity
USDCAD
- Classic bullish setup
- Our team expects bullish continuation
SUGGESTED TRADE:
Swing Trade
Long USDCAD
Entry Point - 1.3735
Stop Loss - 1.3728
Take Profit - 1.3753
Our Risk - 1%
Start protection of your profits from lower levels
Disclosure: I am part of Trade Nation's Influencer program and receive a monthly fee for using their TradingView charts in my analysis.
❤️ Please, support our work with like & comment! ❤️
LONG

AUDJPY Technical Analysis! BUY!
My dear friends,
Please, find my technical outlook for AUDJPY below:
The price is coiling around a solid key level - 102.86
Bias - Bullish
Technical Indicators: Pivot Points High anticipates a potential price reversal.
Super trend shows a clear buy, giving a perfect indicators' convergence.
Goal - 103.32
About Used Indicators:
The pivot point itself is simply the average of the high, low and closing prices from the previous trading day.
Disclosure: I am part of Trade Nation's Influencer program and receive a monthly fee for using their TradingView charts in my analysis.
———————————
WISH YOU ALL LUCK

EURGBP Expected Growth! BUY
My dear followers,
This is my opinion on the EUR/USD next move:
The asset is approaching an important pivot point 0.8769
Bias - Bullish
Safe Stop Loss - 0.8763
Technical Indicators: Supper Trend generates a clear long signal while Pivot Point HL is currently determining the overall Bullish trend of the market.
Goal - 0.8779
About Used Indicators:
For more efficient signals, super-trend is used in combination with other indicators like Pivot Points.
Disclosure: I am part of Trade Nation's Influencer program and receive a monthly fee for using their TradingView charts in my analysis.
———————————
WISH YOU ALL LUCK

Gold Reload Zone at 4,245 as USD Weakens!!Hey Traders,
In today’s trading session, we are monitoring XAUUSD for a potential buying opportunity around the 4,245 zone. Gold remains in a well-defined uptrend and is currently undergoing a healthy corrective phase, pulling back toward the 4,245 support area, which aligns with the broader trend structure.
Technical context:
The bullish structure remains intact, with price respecting higher highs and higher lows. This retracement toward trend support offers a potential continuation setup within the prevailing uptrend.
Macro & Dollar backdrop:
The US Dollar remains under pressure following the recent 25bps Fed rate cut, alongside signs of cooling US labor market data. With balance sheet expansion resuming and markets increasingly sensitive to incoming employment figures, the risk remains skewed toward further USD weakness. Any additional deterioration in labor data could accelerate expectations for another rate cut, reinforcing the bearish Dollar narrative.
Gold correlation:
A softer USD environment continues to support Gold via its negative correlation with the Dollar, keeping the upside bias intact as long as trend support holds.
Watching price behavior closely around 4,245 for confirmation of renewed buying interest.
Trade safe,
Joe

AUDUSD Breakout Retest as Dollar Weakens!Hey Traders,
In today’s trading session, we are monitoring AUDUSD for a potential buying opportunity around the 0.66000 zone. The pair previously traded within a downtrend but has successfully broken out, signaling a shift in market structure.
Price is now in a healthy corrective phase, retracing toward the 0.66000 support zone, which aligns with prior resistance turned support — a classic breakout–retest setup.
Fundamental backdrop:
The US Dollar remains under pressure following softer macro conditions and fading expectations of sustained Fed hawkishness. Recent data continues to point toward a cooling US labor market, reinforcing a weaker USD environment and improving the risk-reward profile for AUDUSD on pullbacks.
Focus: Watching price behavior around 0.66000 for confirmation of bullish continuation.
Trade safe,
Joe

AUDUSD at Decision Point — Trend or Trap?Hey Traders,
In today’s trading session, we are monitoring AUDUSD for a potential buying opportunity around the 0.66200 zone.
Structure:
AUDUSD remains in a well-defined uptrend, and price is currently undergoing a healthy pullback toward the rising trend structure. The 0.66200 area stands out as a key zone of confluence, acting as both dynamic trend support and a prior reaction level.
Context:
As long as price holds above this level, the broader bullish structure remains intact, keeping the path open for a continuation toward recent highs.
Plan:
Watching for bullish reaction and confirmation around 0.66200 before considering continuation setups.
Trade safe,
Joe

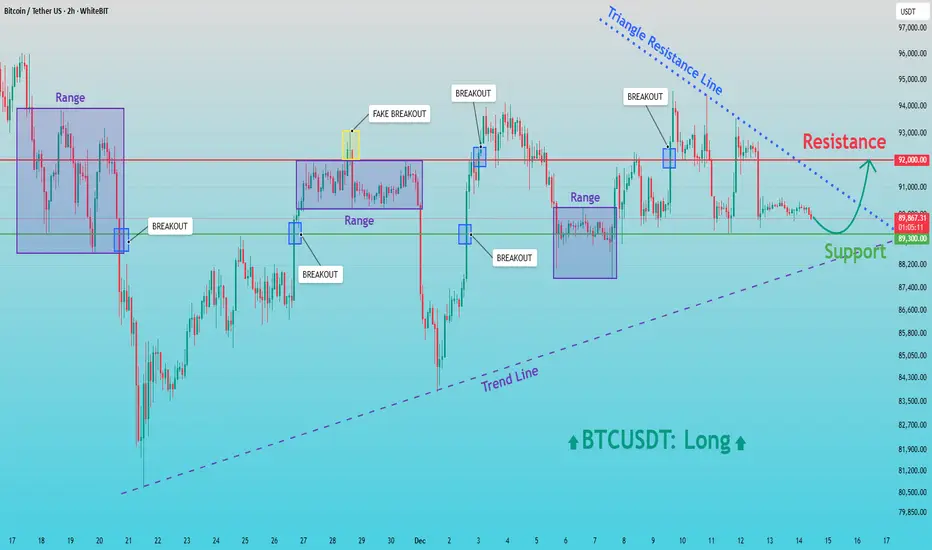
BTCUSD: Buyers in Control - Resistance Retest AheadHello everyone, here is my breakdown of the current BTCUSDT setup.
Market Analysis
BTCUSDT is currently trading within a broadly bullish structure, supported by a rising trend line that has been respected after the major sell-off and subsequent recovery. Following the strong decline, price formed a base near the lower levels and initiated a reversal, creating higher lows and shifting market control back to buyers. After the initial rebound, Bitcoin entered multiple Range phases, where price consolidated and built liquidity. Each range was followed by a breakout, confirming sustained buying interest. Some of these moves included fake breakouts, which briefly trapped participants before price continued to respect the broader bullish structure.
Currently, BTCUSDT is holding above the key Support Zone around 89,300, which has repeatedly acted as a demand area. Price is also compressing under a descending Triangle Resistance Line, while the rising trend line continues to support the market from below. This creates a tightening structure, suggesting that a decisive move is approaching. The 92,000 Resistance level remains the main barrier overhead, where sellers have previously stepped in and rejected higher prices.
My Scenario & Strategy
My scenario remains bullish as long as BTCUSDT holds above the 89,300 Support Zone and continues to respect the ascending trend line. I expect buyers to defend this area and gradually build pressure toward the upper resistance. A clean breakout above the 92,000 Resistance, especially with strong momentum, would confirm bullish continuation and open the path for a move toward higher levels, aligned with the broader trend.
However, if price fails to break the triangle resistance and loses the 89,300 Support, a deeper pullback toward the trend line could occur before buyers attempt another recovery. Until such a breakdown happens, the structure favors buyers. For now, the market remains constructive, with support holding and resistance at 92,000 as the key level to watch.
That’s the setup I’m tracking. Thank you for your attention, and always manage your risk.
USDJPY: Will Keep Growing! Here is Why:
The price of USDJPY will most likely increase soon enough, due to the demand beginning to exceed supply which we can see by looking at the chart of the pair.
Disclosure: I am part of Trade Nation's Influencer program and receive a monthly fee for using their TradingView charts in my analysis.
❤️ Please, support our work with like & comment! ❤️

GOLD On The Rise! BUY!
My dear friends,
Please, find my technical outlook for GOLD below:
The instrument tests an important psychological level 4283.9
Bias - Bullish
Technical Indicators: Supper Trend gives a precise Bullish signal, while Pivot Point HL predicts price changes and potential reversals in the market.
Target - 4298.8
Recommended Stop Loss - 4274.0
About Used Indicators:
Super-trend indicator is more useful in trending markets where there are clear uptrends and downtrends in price.
Disclosure: I am part of Trade Nation's Influencer program and receive a monthly fee for using their TradingView charts in my analysis.
———————————
WISH YOU ALL LUCK

XAUUSD Defends Support – Upside Move Toward 4,380 ExpectedHello traders! Here’s my technical outlook on XAUUSD based on the current market structure. Gold continues to trade within a well-established bullish trend, supported by a clear ascending Trend Line that has been respected after multiple pullbacks. After an earlier rejection from the upper Resistance Level, price experienced a corrective decline but successfully turned around near the trend line, confirming strong buyer interest at lower levels. Following this reaction, XAUUSD broke above the descending Resistance Line, signaling a shift in momentum back in favor of buyers. The market then entered a Range phase, where price consolidated between the Support Level around 4,260 and the Buyer Zone near 4,300, indicating accumulation and balance before the next impulse move. A confirmed breakout from the range occurred to the upside, with buyers aggressively pushing price above the Buyer Zone. Currently, gold is trading firmly above 4,300, showing sustained bullish strength and acceptance above previous resistance. The next key area of interest is the upper Seller Zone / Resistance Level around 4,380, which has acted as a strong reaction zone in the past. As long as price holds above the 4,260 Support Level and continues to respect the ascending trend line, the bullish scenario remains valid. My primary scenario is a continuation toward the 4,380 resistance, where a reaction or short-term rejection may occur. A clean breakout above this Seller Zone could open the door for further upside expansion, while rejection may lead to a healthy pullback toward the Buyer Zone or trend line support. For now, the structure clearly favors buyers, with 4,380 as the main upside target. Please share this idea with your friends and don’t forget to manage your risk 🚀

USOIL Will Go Up From Support! Long!
Please, check our technical outlook for USOIL.
Time Frame: 1h
Current Trend: Bullish
Sentiment: Oversold (based on 7-period RSI)
Forecast: Bullish
The market is approaching a key horizontal level 56.995.
Considering the today's price action, probabilities will be high to see a movement to 57.830.
P.S
We determine oversold/overbought condition with RSI indicator.
When it drops below 30 - the market is considered to be oversold.
When it bounces above 70 - the market is considered to be overbought.
Like and subscribe and comment my ideas if you enjoy them!

CADJPY: Long Signal with Entry/SL/TP
CADJPY
- Classic bullish formation
- Our team expects growth
SUGGESTED TRADE:
Swing Trade
Buy CADJPY
Entry Level - 112.73
Sl - 112.61
Tp - 112.96
Our Risk - 1%
Start protection of your profits from lower levels
Disclosure: I am part of Trade Nation's Influencer program and receive a monthly fee for using their TradingView charts in my analysis.
❤️ Please, support our work with like & comment! ❤️

NZDJPY Will Explode! BUY!
My dear subscribers,
NZDJPY looks like it will make a good move, and here are the details:
The market is trading on 89.853 pivot level.
Bias - Bullish
Technical Indicators: Both Super Trend & Pivot HL indicate a highly probable Bullish continuation.
Target - 90.313
About Used Indicators:
The average true range (ATR) plays an important role in 'Supertrend' as the indicator uses ATR to calculate its value. The ATR indicator signals the degree of price volatility.
Disclosure: I am part of Trade Nation's Influencer program and receive a monthly fee for using their TradingView charts in my analysis.
———————————
WISH YOU ALL LUCK

GBPNZD – 30-Minute Timeframe Tradertilki AnalysisMy friends, greetings,
I have prepared a GBPNZD analysis for you on the 1-hour timeframe.
My friends, if GBPNZD reaches the positive levels between 2.30310 and 2.29957, I will open a buy position and target the 2.31646 level.
My friends, I share these analyses thanks to each like I receive from you. Your likes increase my motivation and encourage me to support you in this way.🙏✨
Thank you to all my friends who support me with their likes.❤️

GBPNZD | Long IdeaGBPNZD Showing double bottom on lower time frames at key point.
Expecting a bounce here.

BITCOIN Very strong zonesThese zones represent strong structural support. Should Bitcoin trade into these areas, they offer high-probability long opportunities.
BINANCE:BTCUSDT CME:BTC1! BYBIT:BTCUSDT

GBPCHF remains in a bearish market structure.Price is approaching the lower Fibonacci support zone, where a bullish reaction is expected.
Buying from this lower Fibonacci area is reasonable if price shows confirmation, as this level aligns with a strong retracement support.
A bullish response from this zone could initiate a corrective move upward.
Always wait for confirmation and manage risk properly.
61.8%
0.75%
FOREXCOM:GBPCHF
OANDA:GBPCHF FX:GBPCHF FPMARKETS:GBPCHF

EUR/JPY SENDS CLEAR BULLISH SIGNALS|LONG
EUR/JPY SIGNAL
Trade Direction: long
Entry Level: 181.978
Target Level: 182.588
Stop Loss: 181.571
RISK PROFILE
Risk level: medium
Suggested risk: 1%
Timeframe: 1h
Disclosure: I am part of Trade Nation's Influencer program and receive a monthly fee for using their TradingView charts in my analysis.
✅LIKE AND COMMENT MY IDEAS✅

BTCUSD Holds Buyer Zone - Push Toward 96,700 LikelyHello traders! Here’s my technical outlook on BTC/USD based on the current market structure. After a prolonged decline, Bitcoin reversed from the Support Level and broke out of the downward channel, shifting momentum in favor of buyers. The price then moved into a consolidation Range, where accumulation formed before a confirmed Breakout pushed BTC higher. Since then, Bitcoin has been respecting the rising Triangle Support Line, forming higher highs and higher lows. Buyers consistently defend this structure, keeping the bullish trend intact despite local corrections. Currently, BTC is holding above the 90,500–88,800 Buyer Zone, which serves as the key demand area maintaining bullish pressure. As long as the price stays above this zone, the upward scenario remains valid. The market is now heading toward the major 96,700 Resistance Level, located inside the broader Seller Zone. A breakout above this level may open the door for further continuation, while rejection could trigger a pullback toward the Triangle Support Line. For now, the structure favors buyers, with 96,700 as the main upside target. Please share this idea with your friends and click Boost 🚀

GBPJPY Trading Opportunity! BUY!
My dear followers,
This is my opinion on the GBPJPY next move:
The asset is approaching an important pivot point 207.45
Bias - Bullish
Technical Indicators: Supper Trend generates a clear long signal while Pivot Point HL is currently determining the overall Bullish trend of the market.
Goal - 208.16
About Used Indicators:
For more efficient signals, super-trend is used in combination with other indicators like Pivot Points.
Disclosure: I am part of Trade Nation's Influencer program and receive a monthly fee for using their TradingView charts in my analysis.
———————————
WISH YOU ALL LUCK

Gold Holding Key Structure as Dollar Loses MomentumHey Traders,
In today’s trading session, we are monitoring XAUUSD for a potential buying opportunity around the 4,300 zone. Gold remains in a well-defined uptrend and is currently undergoing a healthy corrective phase, approaching a key trend-aligned support area near 4,300.
From a macro perspective, the backdrop continues to favor Gold. The US Dollar remains under pressure following the recent rate cut, ongoing balance-sheet expansion, and growing sensitivity to US labor-market data, which could reopen the door for additional easing ahead. This environment reinforces the negative correlation between Gold and the Dollar, supporting upside continuation in XAUUSD.
Price reaction at 4,300 will be key — bullish confirmation at this level could signal trend continuation toward higher highs.
Trade safe,
Joe

USDJPY What Next? BUY!
My dear followers,
I analysed this chart on USDJPY and concluded the following:
The market is trading on 155.16 pivot level.
Bias - Bullish
Technical Indicators: Both Super Trend & Pivot HL indicate a highly probable Bullish continuation.
Target - 155.46
Safe Stop Loss - 154.98
About Used Indicators:
A super-trend indicator is plotted on either above or below the closing price to signal a buy or sell. The indicator changes color, based on whether or not you should be buying. If the super-trend indicator moves below the closing price, the indicator turns green, and it signals an entry point or points to buy.
Disclosure: I am part of Trade Nation's Influencer program and receive a monthly fee for using their TradingView charts in my analysis.
———————————
WISH YOU ALL LUCK

SILVER Set To Grow! BUY!
My dear friends,
SILVER looks like it will make a good move, and here are the details:
The market is trading on 61.986 pivot level.
Bias - Bullish
Technical Indicators: Supper Trend generates a clear long signal while Pivot Point HL is currently determining the overall Bullish trend of the market.
Goal - 62.997
Recommended Stop Loss - 61.372
About Used Indicators:
Pivot points are a great way to identify areas of support and resistance, but they work best when combined with other kinds of technical analysis
Disclosure: I am part of Trade Nation's Influencer program and receive a monthly fee for using their TradingView charts in my analysis.
———————————
WISH YOU ALL LUCK
