Bulls continue to pressure new ATH⭐️GOLDEN INFORMATION:
Gold (XAU/USD) retreats slightly from record highs in Tuesday’s Asian session, though a deeper pullback remains limited by a supportive fundamental outlook. The US Dollar’s three-day rebound weighs on the metal, while upbeat equity sentiment further restricts its safe-haven appeal.
⭐️Personal comments NOVA:
forming a bullish DOW structure on the H1 frame, gold price returns to the old ATH 4380
⭐️SET UP GOLD PRICE:
🔥SELL GOLD zone: 4450 - 4452 SL 4457
TP1: $4430
TP2: $4410
TP3: $4390
🔥BUY GOLD zone: $4279-$4277 SL $4272
TP1: $4290
TP2: $4315
TP3: $4330
⭐️Technical analysis:
Based on technical indicators EMA 34, EMA89 and support resistance areas to set up a reasonable BUY order.
⭐️NOTE:
Note: Nova wishes traders to manage their capital well
- take the number of lots that match your capital
- Takeprofit equal to 4-6% of capital account
- Stoplose equal to 2-3% of capital account
Longposition

When will gold continue to rise? 4300?⭐️GOLDEN INFORMATION:
Gold (XAU/USD) advances toward $4,210 during Thursday’s Asian session, hovering near a fresh record high as Fed rate-cut expectations and renewed trade tensions lift safe-haven demand. Traders now await comments from Fed officials, including Michael Barr, Stephen Miran, Christopher Waller, and Michelle Bowman, for policy cues. Earlier this week, Fed Chair Jerome Powell warned that slowing job growth poses a risk to the US economy, reinforcing prospects for two more rate cuts this year—supportive of the non-yielding yellow metal.
⭐️Personal comments NOVA:
The buying power shows no signs of stopping, breaking 4217 and continuing to increase in price. The whole market is very excited and focusing on investing in gold as the safest asset.
⭐️SET UP GOLD PRICE:
🔥SELL GOLD zone: 4275 - 4277 SL 4282
TP1: $4265
TP2: $4250
TP3: $4240
🔥BUY GOLD zone: $4154-$4152 SL $4147
TP1: $4165
TP2: $4180
TP3: $4190
⭐️Technical analysis:
Based on technical indicators EMA 34, EMA89 and support resistance areas to set up a reasonable BUY order.
⭐️NOTE:
Note: Nova wishes traders to manage their capital well
- take the number of lots that match your capital
- Takeprofit equal to 4-6% of capital account
- Stoplose equal to 2-3% of capital account

Gold price continues to break above 4200⭐️GOLDEN INFORMATION:
Gold (XAU/USD) surges to a new all-time high in Wednesday’s Asian session, with bulls eyeing the $4,200 mark amid mounting global uncertainty. Renewed US-China trade tensions, the prolonged US government shutdown, and ongoing geopolitical risks continue to drive safe-haven demand. Meanwhile, dovish Federal Reserve expectations and a softer US Dollar further support the metal’s strong uptrend, with buyers largely unfazed by overbought conditions.
⭐️Personal comments NOVA:
Gold price continues to break out near 4200, strong buying power continues to increase price, US government is still closed, gold price continues to increase
⭐️SET UP GOLD PRICE:
🔥SELL GOLD zone: 4235 - 4237 SL 4242
TP1: $4220
TP2: $4210
TP3: $4200
🔥BUY GOLD zone: $4093-$4091 SL $4086
TP1: $4105
TP2: $4120
TP3: $4130
⭐️Technical analysis:
Based on technical indicators EMA 34, EMA89 and support resistance areas to set up a reasonable BUY order.
⭐️NOTE:
Note: Nova wishes traders to manage their capital well
- take the number of lots that match your capital
- Takeprofit equal to 4-6% of capital account
- Stoplose equal to 2-3% of capital account

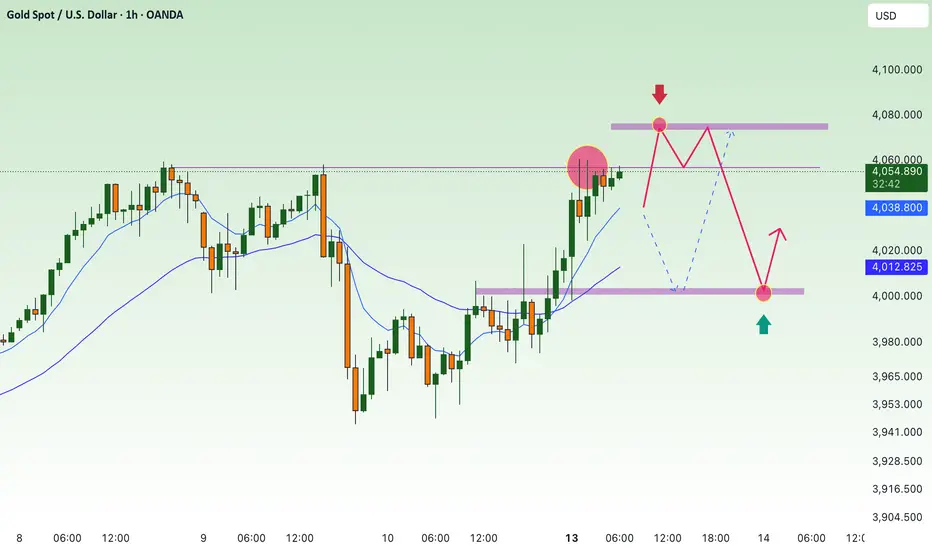
The bulls are too dominant, prices continue to increase⭐️GOLDEN INFORMATION:
Gold (XAU/USD) extends its record-breaking rally above $4,100 in Tuesday’s Asian session, fueled by safe-haven demand amid the ongoing US government shutdown and renewed US-China trade tensions. Geopolitical risks and rising expectations of further Federal Reserve rate cuts also continue to underpin the non-yielding metal.
⭐️Personal comments NOVA:
Selling pressure is almost absent in the market, buying pressure continues to push gold prices up. Continue waiting for a new ATH today.
⭐️SET UP GOLD PRICE:
🔥SELL GOLD zone: 4212 - 4214 SL 4219
TP1: $4200
TP2: $4185
TP3: $4162
🔥BUY GOLD zone: $4058-$4056 SL $4051
TP1: $4070
TP2: $4090
TP3: $4105
⭐️Technical analysis:
Based on technical indicators EMA 34, EMA89 and support resistance areas to set up a reasonable BUY order.
⭐️NOTE:
Note: Nova wishes traders to manage their capital well
- take the number of lots that match your capital
- Takeprofit equal to 4-6% of capital account
- Stoplose equal to 2-3% of capital account

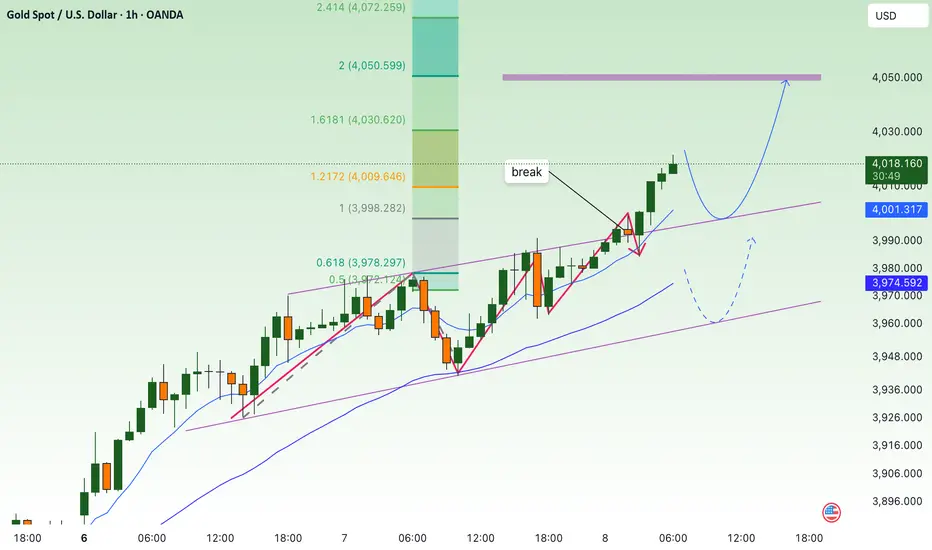
find new ATH 4074 , price increase⭐️GOLDEN INFORMATION:
Gold (XAU/USD) extends gains for a second day, reaching a new record high near $4,060 in Monday’s Asian session. Persistent economic uncertainty from the prolonged US government shutdown, renewed US-China trade tensions, and growing expectations of further Federal Reserve rate cuts continue to support the safe-haven metal. Markets now anticipate two additional rate cuts this year, pressuring the US Dollar and bolstering Gold. However, President Trump’s softer tone on China tariffs has improved overall risk sentiment, capping the metal’s upside for now.
⭐️Personal comments NOVA:
Tariffs, adding momentum for gold prices to continue growing, creating new ATH this week
⭐️SET UP GOLD PRICE:
🔥SELL GOLD zone: 4074 - 4076 SL 4081
TP1: $4060
TP2: $4050
TP3: $4040
🔥BUY GOLD zone: $4000-$4002 SL $3995
TP1: $4010
TP2: $4020
TP3: $4030
⭐️Technical analysis:
Based on technical indicators EMA 34, EMA89 and support resistance areas to set up a reasonable BUY order.
⭐️NOTE:
Note: Nova wishes traders to manage their capital well
- take the number of lots that match your capital
- Takeprofit equal to 4-6% of capital account
- Stoplose equal to 2-3% of capital account
Tariff tensions - the driving force behind gold price increases✍️ NOVA hello everyone, Let's comment on gold price next week from 10/13/2025 - 10/17/2025
⭐️GOLDEN INFORMATION:
Gold (XAU/USD) climbs during the North American session on Friday, trading near $3,997, up 0.6%, as renewed US-China trade tensions, the ongoing US government shutdown, and expectations of further Fed easing fuel safe-haven demand. Risk sentiment deteriorated after President Donald Trump warned of new tariffs on China, which threatened countermeasures on rare earth exports, while Trump dismissed the need to meet President Xi Jinping later this month.
⭐️Personal comments NOVA:
Tariff tensions return, US government remains shut. Gold price maintains bullish momentum above 4000
🔥 Technically:
Based on the resistance and support areas of the gold price according to the H4 frame, NOVA identifies the important key areas as follows:
Resistance: $4058, $4100
Support: $3980, $3942, $3895
🔥 NOTE:
Note: Nova wishes traders to manage their capital well
- take the number of lots that match your capital
- Takeprofit equal to 4-6% of capital account
- Stoplose equal to 2-3% of capital account
- The winner is the one who sticks with the market the longest

USDJPY: Waiting for bullish pullback signalsNews about Japan’s incoming Prime Minister has fueled expectations for more accommodative monetary policy.
* Trend: assessed using at least three trend indicators, with market structure as the primary guide.
** Weak or Reversal Signals: Assessed based on one of our criteria for trend reversal signals.
*** Support/Resistance: Selected from multiple factors – static (Swing High, Swing Low, etc.), dynamic (EMA, MA, etc.), psychological (Fibonacci, RSI, etc.) – and determined based on the trader’s discretion.
**** Our advice takes into account all factors, including both fundamental and technical analysis. It is not intended as a profit target. We hope it can serve as a reference to help you trade more effectively. This advice is for informational purposes only and we assume no responsibility for any trading results based on it.
Please like and comment below to support our traders. Your reactions will motivate us to do more analysis in the future 🙏✨
George Vann @ ZuperView

Gold ATH continues to set, looking to 4050⭐️GOLDEN INFORMATION:
Gold (XAU/USD) extends its rally in the Asian session on Wednesday, breaking above the $4,000 mark for the first time ever. Expectations of further Fed rate cuts, persistent geopolitical tensions, and mounting economic uncertainty from the ongoing US government shutdown continue to fuel demand for the precious metal.
⭐️Personal comments NOVA:
The current gold buying power in the market is very large, the weakening of DXY this year is the main reason for the very strong growth in gold prices.
⭐️SET UP GOLD PRICE:
🔥SELL GOLD zone: 4048 - 4050 SL 4055
TP1: $4040
TP2: $4030
TP3: $4020
🔥BUY GOLD zone: $3960-$3962 SL $3955
TP1: $3975
TP2: $3990
TP3: $4000
⭐️Technical analysis:
Based on technical indicators EMA 34, EMA89 and support resistance areas to set up a reasonable BUY order.
⭐️NOTE:
Note: Nova wishes traders to manage their capital well
- take the number of lots that match your capital
- Takeprofit equal to 4-6% of capital account
- Stoplose equal to 2-3% of capital account
Taking a trade on DOGE/USDTI’m a new trader and just started sharing my experience here. This is not financial advice, so take your own risk

Gold price conquers 4000, strong price increase⭐️GOLDEN INFORMATION:
France’s new Prime Minister Sebastien Lecornu and his cabinet resigned just hours after taking office on Monday, deepening the nation’s political turmoil. At the same time, the US government shutdown entered its sixth day, with the Trump administration signaling plans to cut federal jobs. “A wave of global political and economic concerns — from France’s crisis to rising Japanese yields and the prolonged US shutdown — continues to fuel gold’s rally,” noted Edward Meir, analyst at Marex.
⭐️Personal comments NOVA:
Big fomo market, buyers are in complete control. Continue to conquer the 4000 price zone today.
⭐️SET UP GOLD PRICE:
🔥SELL GOLD zone: 4000 - 4002 SL 4007
TP1: $3990
TP2: $3980
TP3: $3970
🔥BUY GOLD zone: $3910-$3908 SL $3903
TP1: $3920
TP2: $3930
TP3: $3940
⭐️Technical analysis:
Based on technical indicators EMA 34, EMA89 and support resistance areas to set up a reasonable BUY order.
⭐️NOTE:
Note: Nova wishes traders to manage their capital well
- take the number of lots that match your capital
- Takeprofit equal to 4-6% of capital account
- Stoplose equal to 2-3% of capital account

Taking a trade on DOGE/USDTI’m a new trader and just started sharing my experience here. This is not financial advice, so take your own risk

Long Setup — FIG (130m)🎯 Strategy Overview
We’re positioning long from the retracement zone between $59.65 – $49.52, aligning with Fibonacci retracement levels and anchored VWAP support.
⚙️ Trade Plan
We’ll execute this setup in two steps to scale into strength.
🟩 Trade #1
Entry: $53.50
Stop: Below $49.52
Target: $58.44
Risk/Reward: 2.3 R
Rationale: Entry at the 0.382 Fib level after a bullish reaction around the VWAP and reclaim of short-term structure.
🟩 Trade #2 (Add-Up Position)
Entry: $56.21
Stop: Below $49.52
Target: $62.32
Risk/Reward: 2.1 R
Rationale: Add exposure once price clears the local resistance and confirms strength above the 80 MA, signaling momentum continuation.
📊 Technical Context
Retracement range: $59.65 → $49.52
Confluence: Fibonacci + VWAP + volume confirmation
RSI recovering from mid-40s and turning upward
Volume expansion near breakout attempt suggests accumulation


Is it time for gold price to adjust? down⭐️GOLDEN INFORMATION:
Gold (XAU/USD) fails to extend its rebound from $3,820 and faces renewed selling pressure in Friday’s Asian session. A resilient risk appetite, despite the ongoing US government shutdown, along with a firmer US Dollar, weighs on the safe-haven metal and limits its upside.
⭐️Personal comments NOVA:
Gold prices are fluctuating quite a bit around the price range of 3800 - 3900. The context of the US government shutdown.
⭐️SET UP GOLD PRICE:
🔥SELL GOLD zone: 3914- 3916 SL 3921
TP1: $3900
TP2: $3890
TP3: $3880
🔥BUY GOLD zone: $3794-$3792 SL $3787
TP1: $3802
TP2: $3815
TP3: $3830
⭐️Technical analysis:
Based on technical indicators EMA 34, EMA89 and support resistance areas to set up a reasonable BUY order.
⭐️NOTE:
Note: Nova wishes traders to manage their capital well
- take the number of lots that match your capital
- Takeprofit equal to 4-6% of capital account
- Stoplose equal to 2-3% of capital account
slight decrease, long term uptrend 3910⭐️GOLDEN INFORMATION:
Gold (XAU/USD) recovered from a brief dip to the $3,853 zone on Thursday, holding close to its record high from the prior session. A positive equity tone and overbought conditions cap upside momentum, yet expectations of Fed easing and lingering geopolitical risks keep the metal supported, making a decisive top uncertain.
⭐️Personal comments NOVA:
Gold prices continuously set new peaks, short-term adjustments and continued the upward trend.
⭐️SET UP GOLD PRICE:
🔥SELL GOLD zone: 3908- 3910 SL 3915
TP1: $3900
TP2: $3890
TP3: $3880
🔥BUY GOLD zone: $3833-$3831 SL $3826
TP1: $3845
TP2: $3860
TP3: $3870
⭐️Technical analysis:
Based on technical indicators EMA 34, EMA89 and support resistance areas to set up a reasonable BUY order.
⭐️NOTE:
Note: Nova wishes traders to manage their capital well
- take the number of lots that match your capital
- Takeprofit equal to 4-6% of capital account
- Stoplose equal to 2-3% of capital account

Gold price increase - towards 3825⭐️GOLDEN INFORMATION:
Gold (XAU/USD) hovers near $3,800 in Monday’s Asian session, supported by in-line US inflation data that reinforced expectations of further Fed rate cuts this year. Geopolitical uncertainty also underpins safe-haven demand, though upcoming remarks from several Fed officials could sway the Dollar and limit gains for bullion.
⭐️Personal comments NOVA:
continue to rise - above 3790 and hit 3825 resistance today
⭐️SET UP GOLD PRICE:
🔥SELL GOLD zone: 3825- 3827 SL 3832
TP1: $3817
TP2: $3808
TP3: $3792
🔥BUY GOLD zone: $3759-$3757 SL $3752
TP1: $3770
TP2: $3780
TP3: $3790
⭐️Technical analysis:
Based on technical indicators EMA 34, EMA89 and support resistance areas to set up a reasonable BUY order.
⭐️NOTE:
Note: Nova wishes traders to manage their capital well
- take the number of lots that match your capital
- Takeprofit equal to 4-6% of capital account
- Stoplose equal to 2-3% of capital account

Long Trade Setup As u can See the Overall View is Bullish as per Market Structure so we are Looking for Buys at Discount with proper Risk management.

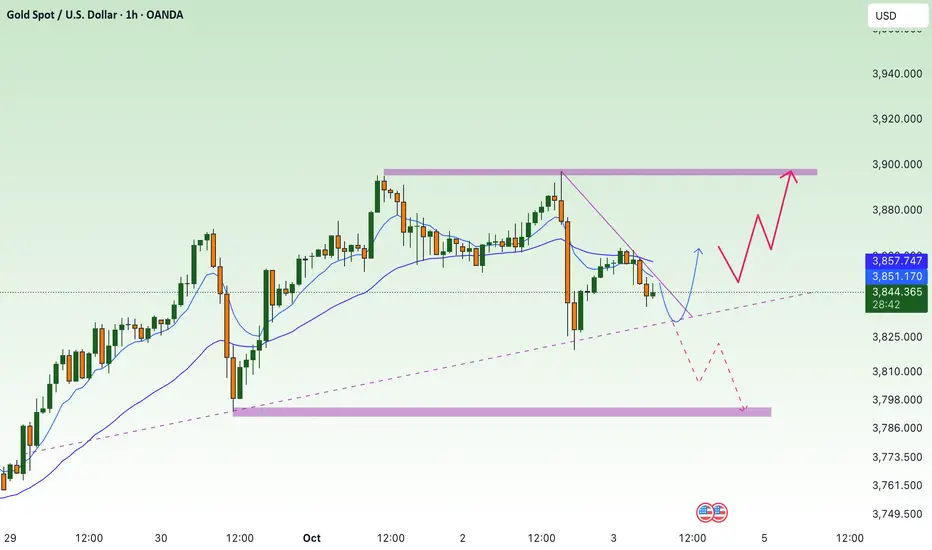
Gold price accumulates around ATH 3790✍️ NOVA hello everyone, Let's comment on gold price next week from 09/29/2025 - 10/03/2025
⭐️GOLDEN INFORMATION:
Gold climbs as PCE data reinforces Fed easing bets, with the core index holding below 3%. Market sentiment stays upbeat despite weaker Michigan Consumer Sentiment, as inflation expectations point to gradually easing price pressures and lingering concerns over the labor market.
⭐️Personal comments NOVA:
The bulls continue to try to break through ATH and increase the price. The momentum of interest rate reduction in the next rounds in 2025
🔥 Technically:
Based on the resistance and support areas of the gold price according to the H4 frame, NOVA identifies the important key areas as follows:
Resistance: $3812, $3832
Support: $3727, $3697
🔥 NOTE:
Note: Nova wishes traders to manage their capital well
- take the number of lots that match your capital
- Takeprofit equal to 4-6% of capital account
- Stoplose equal to 2-3% of capital account
- The winner is the one who sticks with the market the longest

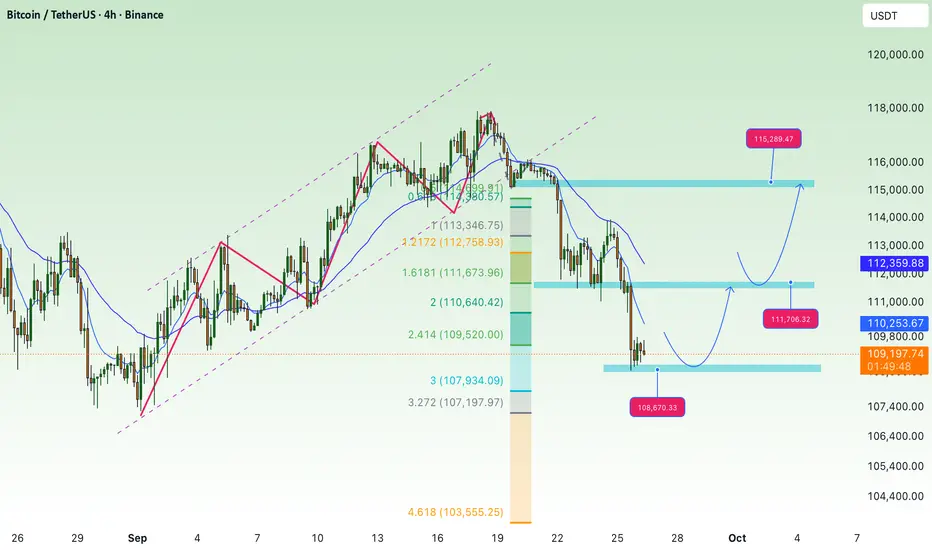
waiting for BTC to recover, accumulate above 107KBTC Technical Analysis (4H Chart):
After breaking down from the rising channel, BTC has confirmed a bearish structure, forming lower highs and lower lows.
Price recently bounced from the 108,800–109,000 support zone, which aligns with the 2.618 Fibonacci extension. This is a key short-term support area to watch.
If buyers can hold this support, BTC may retest the 111,600–111,700 resistance zone. A breakout above could open the path toward the higher resistance at 115,300–115,400.
On the downside, if the 109,000 zone fails, the next bearish targets lie at 105,900 and deeper Fibonacci projections around 104,200–103,100.
Trend Outlook:
Short-term: Possible recovery toward 111,600 or even 115,300 if demand holds above 109,000.
Medium-term: Still bearish-biased as long as price stays under the 200 EMA (~114,000).
Key Levels to Note:
Resistance: 111,600 – 111,700, 115,300 – 115,400
Support: 109,000, 105,900, 104,200 – 103,100
Going long in Bajaj_AutoI believe it will reach to its all time high in next 3 to 4 months as it has broken its near resistance and taken support of it as well.
Share your views

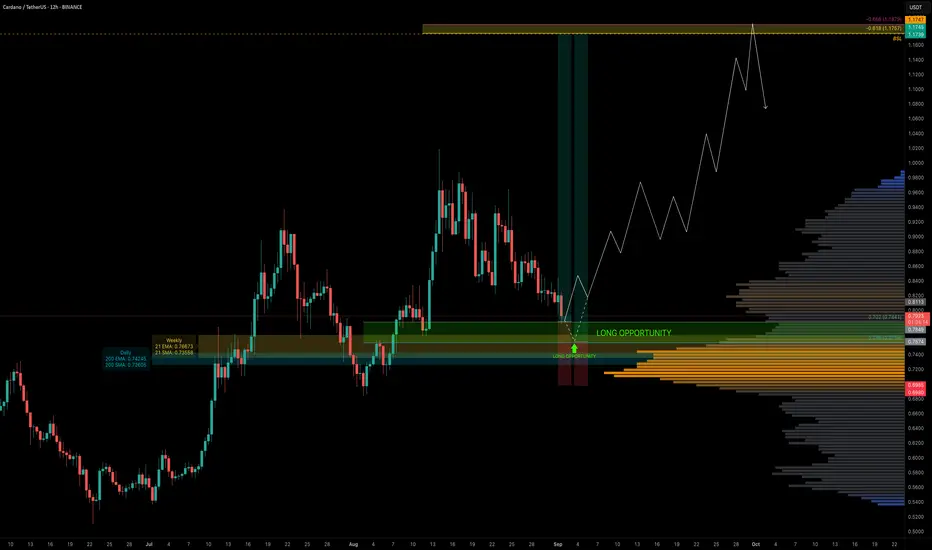
ADA — Fib Harmony With EMA/SMA SupportADA has been in a downtrend for the past 18 days and is now approaching a cluster of key support levels. Today, price tapped the 0.702 Fib retracement ($0.7841) — an optimal area for long entries.
The main focus, however, is the 0.786 Fib retracement, which aligns with a liquidity pocket and multiple layers of confluence, making it the most ideal entry zone.
🧩 Confluence at 0.702–0.786 Fib Zone
0.702–0.786 Fib retracement → prime long entry range
Liquidity pocket → sitting around the 0.786 Fib
200 EM ($0.7424) / 200 SMA ($0.726) (daily)
21 EMA ($0.766) / 21 SMA ($0.735) (weekly)
Pitchfork lower support line → intersecting the zone
0.618/0.666 Fib Speed Fan → adding another support layer
🟢 Long Trade Setup
Entry Zone: 0.702–0.786 Fib retracement
Best Entry: Around the 0.786 Fib
Stop-Loss: Below $0.70 (to be adjusted after seeing more price action)
Target (TP): $1.1757 (–0.618 Fib, in confluence with key high & buy-side liquidity at $1.1747)
Potential Move: +50%
R:R: ~1:4.5 up to 1:7 (depending on entry)
Technical Insight
ADA is testing deeper retracements within its current downtrend, the 0.702–0.786 Fib zone combines structural, dynamic, and liquidity-based confluence.
The added support of the weekly 21 EMA/SMA strengthens this area as a pivotal level for bulls to defend.
If held, this zone could fuel a swing long setup with great upside potential.
The $1.1747–$1.1757 zone is both a high-confluence take-profit area and a potential short opportunity, given the liquidity resting above that level.
🔍 Indicators used
LuxAlgo — Liquidity Sentiment Profile (Auto-Anchored)
Multi Timeframe 8x MA Support Resistance Zones → to identify support and resistance zones such as the weekly 21 EMA/SMA
➡️ Available for free. You can find it on my profile under “Scripts” and apply it directly to your charts for extra confluence when planning your trades.
_________________________________
💬 If you found this helpful, drop a like and comment!
Strong uptrend, above ATH 3700 next week ✍️ NOVA hello everyone, Let's comment on gold price next week from 09/22/2025 - 09/26/2025
⭐️GOLDEN INFORMATION:
Gold (XAU/USD) rebounds on Friday, snapping a two-day losing streak and climbing 0.69% to $3,670 during the North American session, despite broad USD strength. Buyers stepped in near weekly lows at $3,630, lifting the metal higher. The move follows the Fed’s 25 bps cut and signals of two more reductions this year, though Powell’s “risk-management cut” remarks were viewed as hawkish. Still, bullion’s outlook remains constructive, supported by a low-rate environment and resilient Asian demand.
⭐️Personal comments NOVA:
Gold prices recovered and continued to maintain a strong upward trend, thanks to optimism about interest rate cuts this year.
🔥 Technically:
Based on the resistance and support areas of the gold price according to the H4 frame, NOVA identifies the important key areas as follows:
Resistance: $3702, $3719, $3745
Support: $3646, $3593
🔥 NOTE:
Note: Nova wishes traders to manage their capital well
- take the number of lots that match your capital
- Takeprofit equal to 4-6% of capital account
- Stoplose equal to 2-3% of capital account
- The winner is the one who sticks with the market the longest

EURUSD LONG 15MThe trend still bullish, It will go short first then fulfill the unmitigated imbalance. This is just my analysis sorry if i'm wrong.
