PENDLE / USDT preparing for next bullish leg up After FVG tapPendle / USDT is looking strong, but I’m expecting price to first tap the 4H FVG zone before continuing its trend towards $3 – $3.5…
A clean reaction from that zone can trigger the next bullish wave, so waiting for confirmation is important here. Momentum is still in favor of buyers, but entries should always be planned with patience.
Manage risk wisely and only enter after a clear confirmation.
Longsetup

XAUUSD – The Golden Wave Awaits the Next U.S. TriggerIf there is one asset being favored by the current macro environment , it is undoubtedly gold. The U.S. dollar is weakening due to expectations that the Fed will soon shift toward policy easing, while global investors await key U.S. data such as ADP, ISM, and the Fed meeting next week. This “waiting mode,” combined with the dollar dropping to its lowest level since mid-November , is creating a highly supportive backdrop for XAUUSD to continue its bullish momentum.
Looking at the chart, gold continues to move smoothly within its ascending channel . Price repeatedly rebounds from the lower boundary, rides along the Ichimoku cloud, and forms higher lows — all signatures of a healthy bullish market with real buying pressure . Every small pullback is absorbed almost immediately, showing that buyers remain firmly in control.
My preferred scenario: XAUUSD may fluctuate slightly around 4,180–4,200 to collect liquidity, then continue climbing toward 4,280 — an area aligning with the upper channel boundary and a level where the market has reacted strongly in the past. If ADP and ISM come out weaker than expected , a clean breakout above 4,280 becomes highly likely.
Overall, gold currently has macro momentum, technical alignment, and market sentiment all on its side . As long as you avoid FOMO and wait for minor pullbacks, you’ll find it much easier to ride along with the major flow of capital as the market prepares for the next wave of volatility.

Is Gold Just Resting — or Ready to Rise Again?Hello traders, let’s take a look at XAUUSD together today!
At the moment, XAUUSD looks like a wave pulling back only to gather momentum — not weakening, but preparing for the next upward move . After hitting a six-week high, gold is seeing some light profit-taking, but the macro backdrop still leans strongly toward the bulls: the Fed is sending dovish signals , the USD is weakening, and soft U.S. data continues to support this mild bullish trend .
Looking at the chart, price was previously rejected at the upper resistance zone and has now pulled away from the descending resistance line. Even so, the overall bullish structure remains intact . Gold is heading toward the 4,170 support zone, which aligns with a strong previous reaction area — and may dip slightly deeper into 4,120, a confluence of old lows and a strong rejection zone. These are the two areas where buyers are most likely to return .
The high-probability scenario: XAUUSD taps 4,170, forms a consolidation base, and then rebounds toward 4,250. If sellers push price further to 4,120, this will become the last critical support before gold triggers its next upward wave. Only a clear break below 4,120 would significantly threaten the mild bullish outlook.
For now, the main story remains unchanged: gold is correcting, not reversing . And every pullback toward support continues to be an opportunity to watch for the buyers’ return — to fuel the next bullish leg in the days ahead.

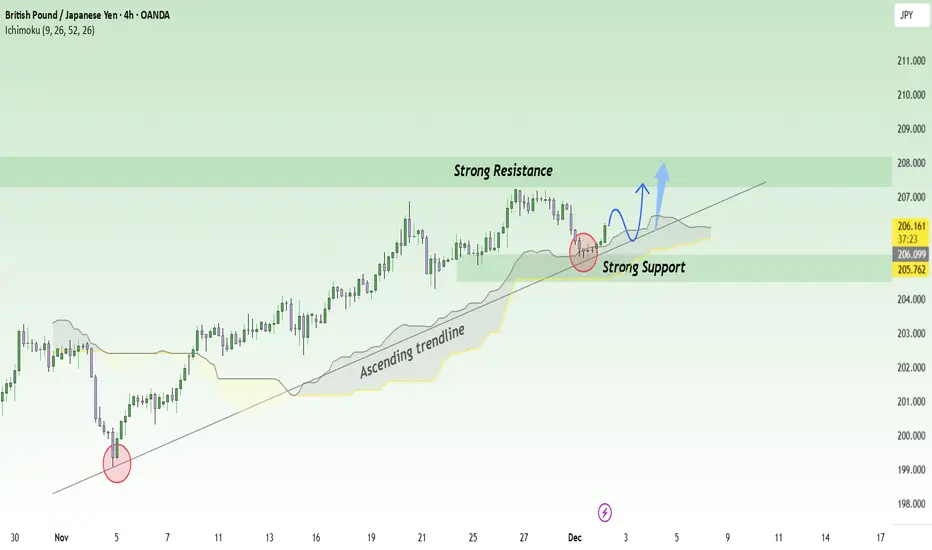
GBPJPY Gearing Up for a New Bullish Wave?If we were to describe GBPJPY at this moment, it would be the picture of a market gathering momentum to climb higher . After a mild pullback, the macro backdrop still leans toward further upside: the JPY continues to weaken as risk-aversion eases, while the GBP remains supported by a stable economy and higher interest rates . This combination forms a solid foundation for the current recovery phase.
Looking at the 4H chart, the uptrend is clearly intact with an ascending trendline that has been respected consistently since early November. Each touch of this trendline has triggered strong buying pressure — a clear sign that bulls are still in control . Most recently, price has bounced again from the 205.6 support confluence , aligning perfectly with the trendline and the nearest support zone.
With the current structure, the primary scenario remains bullish. Price is likely to consolidate slightly above the trendline before moving toward the 207.3 resistance — the next key target of the trend. If buying pressure stays firm, GBPJPY could even extend higher toward 207.8–208.0.
Only a break below 205.5 and a candle close under the trendline would threaten the bullish outlook. But for now, market flow continues to favor the buy side, and every pullback still presents an opportunity to observe the potential continuation of the uptrend .
Fed Turns Dovish – Is the Euro Taking the Throne?In the current environment, the market is expecting the Fed to become increasingly dovish , while the ISM Manufacturing PMI—though forecasted to rise slightly—remains below the 50 mark . This indicates that the U.S. manufacturing sector is still not strong enough to support the USD. As a result, the dollar struggles to generate sustainable bullish momentum, unintentionally giving stronger support to the euro . From a sentiment perspective, as long as the data isn’t overly positive for the USD, capital flow will continue to favor EURUSD.
Looking at the H4 chart, the bullish structure is clear: price keeps forming higher lows , respecting the ascending trendline, and trading above the Ichimoku cloud — all signs that the primary trend remains bullish. The 1.1560 zone, aligned with both the trendline and the top of the cloud, acts as critical support , while 1.1650 stands out as the natural upside target for the current bullish wave.
My preferred scenario: EURUSD may make a small pullback toward 1.1560–1.1580 to retest support before bouncing higher toward 1.1650. As long as price stays above the trendline and doesn’t break below 1.1560, I continue to view this market as leaning strongly toward buying rather than selling.
In summary, with news flow putting pressure on the USD and technical structure supporting the bulls, the short-term trend for EURUSD remains decisively bullish .

GBPUSD Set to Break Higher: Buyers Take Back Control!If I had to pick one currency pair that is “warming up” in the most positive way, GBPUSD would easily be the standout . The news is lining up behind the British pound, and the technicals are opening the door for another bullish leg — everything is aligning perfectly for buyers.
From a news perspective, the market reacted positively to the UK’s Autumn Budget , with the OBR noting that the new fiscal plan helps reduce financial-risk pressure . This strengthens confidence in GBP. Meanwhile, the USD continues to weaken as expectations grow that the Fed may cut rates — a factor that makes it difficult for the dollar to stage a strong recovery. When one currency weakens due to fundamentals, the opposing currency — in this case the pound — naturally gains room to rise.
On the H4 chart, the bullish structure is very clean : price is moving inside an ascending channel, printing higher lows, and consolidating above the Ichimoku cloud — a highly important bullish signal. The 1.3170 zone is a confluence of horizontal support and the cloud’s lower boundary, making it an ideal area for a mild pullback before a continuation move. Above, the 1.3260 region stands as the nearest swing high and the most natural target for the next bullish wave.
My preferred scenario: GBPUSD may dip slightly toward 1.3170 to retest support, then gradually bounce and move upward toward 1.3260 following the channel structure. As long as price holds above 1.3170 and does not close an H4 candle below the cloud, I will continue to prioritize BUY setups , rather than attempt counter-trend sells.

Coinbase and Bitcoin Breakout before breakdown In this video I analyse Coinbase and BTC and draw out the idea of the push to the upside although highlighting what levels need to be claimed in order to do so .

Accumulation and recovery - resistance 4275⭐️GOLDEN INFORMATION:
Gold (XAU/USD) extends Tuesday’s rebound from the $4,164 zone in Wednesday’s Asian session, gaining fresh momentum and edging back toward Monday’s two-week high. The metal remains supported by expectations of another Fed rate cut next week, while speculation about a dovish successor to Chair Powell keeps the US Dollar subdued near a two-week low, further boosting the non-yielding asset
⭐️Personal comments NOVA:
Buying power remains above 4200, gold price recovers and grows. The market is waiting for today's ADP-NF results to continue increasing in price.
⭐️SET UP GOLD PRICE:
🔥SELL GOLD zone: 4275 - 4277 SL 4282
TP1: $4260
TP2: $4245
TP3: $4230
🔥BUY GOLD zone: 4193 - 4191 SL 4186
TP1: $4208
TP2: $4220
TP3: $4235
⭐️Technical analysis:
Based on technical indicators EMA 34, EMA89 and support resistance areas to set up a reasonable BUY order.
⭐️NOTE:
Note: Nova wishes traders to manage their capital well
- take the number of lots that match your capital
- Takeprofit equal to 4-6% of capital account
- Stoplose equal to 2-3% of capital account

Bad US Data — Will EURUSD Seize the Chance to Surge?Hello everyone, today let’s take a look at the current movement of the EURUSD pair.
Following recent news, we can see that the ADP and ISM US reports are expected to come in worse than before , putting pressure on the USD while the euro takes advantage of the momentum. When fundamentals lean toward selling the USD, every pullback on EURUSD naturally becomes an opportunity for buyers to step in.
Looking at the chart, EURUSD is moving beautifully inside an uptrend channel , forming higher highs and higher lows . Price is respecting the lower boundary of the channel and bouncing strongly, showing that the bullish structure is still intact . The Ichimoku cloud lies below price , and price has broken above the cloud and held — a classic sign of a strong bullish market.
The area around 1.1610 is a key support zone : aligned with the channel bottom, the Ichimoku cloud, and an area where price has reacted multiple times. As long as this level holds, any dip is simply a setup for the next leg up. The ideal scenario: price may fluctuate slightly around 1.1610–1.1630, then push upward to retest the resistance zone at 1.1680 — the natural target of the current uptrend channel.
In summary, with bearish expectations for the USD and a technical structure that strongly supports the bulls, my priority remains buying on pullbacks , waiting for price to revisit 1.1610–1.1630 and aiming toward 1.1680, rather than fighting the bullish flow currently driving EURUSD upward.

BTC Macro Rising Wedge: Arithmetic Trend SupportsThis monthly Bitcoin chart is on an arithmetic scale. The red line marks macro resistance connecting the major cycle peaks since 2017, forming the upper boundary of a large rising wedge, while the green line tracks macro support from the 2022 bear‑market low.
Price has recently pulled back from near the resistance and is now reacting around the support, showing that this trend channel is still respected on a closing‑basis. As long as monthly candles hold above the green line, the primary uptrend from the last bear‑market bottom remains intact and the wedge structure continues to guide expectations.
From this perspective, the chart suggests a path where Bitcoin can bounce off macro support and travel once more toward the resistance line before a larger cycle top and subsequent bear market.
This aligns with my main strategy that calls for a new high before the next major downturn.

XAUUSD – Fresh Intraday + Weekly OutlookGold is sitting in a key decision zone right now. After last week’s strong push, the market is correcting but still holding the broader bullish structure. We’re basically in the classic phase where the market tests whether the upside trend is ready to continue or if we’ll get a deeper pullback first.
**Where price stands:**
– Still inside the 4H ascending channel.
– Holding above the main support cluster at **4170–4160**, a zone packed with volume and previous absorption.
– Trading beneath the heavy supply area **4235–4245**, which rejected price last time.
– The current pullback has only reached the 38–50% retracement of the latest rally, which is typical of a healthy correction, not a trend reversal.
**Intraday scenarios I’m watching:**
**1. Bullish rotation back into 4230–4240 (most likely while above 4190–4180)**
Signs to confirm:
– Price holds above VWAP or reclaims it.
– 5m–15m MACD turns up or shows bullish divergence.
– Volume drops on the downside and reappears on the buy side near the mid-Bollinger band.
Targets: **4230 first**, then **4235–4240** where the real test sits.
**2. Deeper correction toward 4175–4160**
Triggers:
– Clean breakdown below 4190 with growing sell volume.
– 15m MACD accelerating below zero.
– Price failing to re-enter the Bollinger mid-band after pushes.
Support zones:
– **4180–4175**
– **4170–4160** (major support / best demand zone)
If buyers defend that region again, it becomes a solid area to look for upside continuation.
**3. Full breakout squeeze above 4240**
Less likely immediately, but possible if USD/yields stay weak. In that case, **4245–4250** comes quickly into play, and a move toward the upper side of the 4H channel could follow.
**For the rest of the week:**
As long as 4160–4170 holds, the higher-timeframe trend stays bullish. The only thing stopping gold right now is the supply layer at 4235–4245. If the market spends several sessions failing there, we could see a wider range forming between 4170–4240. If it breaks with volume, the trend extends.
**What I’m monitoring now:**
– Price reaction vs. VWAP
– Volume behavior at both extremes
– Divergences on 5m–15m
– USD and yields (still the biggest driver this month)
This type of movement — impulse → range → sharp pullback → decision — is extremely typical for gold before choosing its next leg. The structure still slightly favors continuation higher, but the real confirmation will happen around **4235–4245**.

AUD/USD Breakout Above Trendline – Bullish Momentum BuildingMarket Structure:
Price has been trading within a descending structure, respecting a downward trendline resistance. Recently, the pair has broken above this trendline, signaling a potential shift in short-term momentum from bearish to bullish.
Key Levels:
Trendline Resistance (Broken): Price has successfully closed above the declining trendline, indicating a possible breakout.
Horizontal Support Zone (Purple Region): This zone has been acting as a strong demand area, with multiple rejections showing buyers defending this level.
Breakout Confirmation:
After the breakout, price is currently retesting the trendline and showing signs of holding above it. A successful retest followed by bullish momentum would strengthen the probability of continued upward movement.
Bullish Scenario:
If buyers maintain control above the breakout level, the market is likely to form a higher low and push upward toward the next target zone around 0.65600–0.65650. This aligns with the projected bullish path illustrated on the chart.
Bias:
Bullish, as long as price remains above the retested trendline and the horizontal support zone.
Invalidation:
A strong move back below the trendline and into the support zone would invalidate the breakout and potentially resume bearish pressure.

2nd of December GBPUSD OUTLOOK sellside has been taken and price is approaching the 30min FVG that we marked last week. once it hits it, will look to long GU. you can also wait for a break of structure after price hits the fvg to go long

CHF/USD 4H: High-Probability Reversal Play at Unmitigated Demand🚀 CHF/USD 4H: High-Probability Reversal Play at Unmitigated Demand Zone
📝 Market Overview and Structural Context
The CHF/USD pair has recently experienced a significant downward correction from a prior high (marked by the long vertical line). This bearish move effectively tested and breached minor support levels, indicating a strong influx of sellers in the short term.
The current price action is situated near a major unmitigated Demand Zone—the area responsible for initiating the last aggressive buying rally. The trading hypothesis focuses on the expectation that institutional buyers will defend this critical base, leading to a strong bullish reversal.
🔑 Key Technical Zones and Order Flow
The analysis highlights two main zones that form the basis of the long hypothesis:
1. Reversal Zone (Demand Entry) 🟢
Zone Location: The upper green shaded box, spanning approximately 1.23300 to 1.23500.
Significance: This is identified as the high-probability Demand Zone. It represents the area where price stalled and reversed aggressively, establishing the structure that led to the prior swing high (the Order Flow Origin). This zone contains a concentration of unexecuted buy orders, making it the ideal location for a bullish reversal to begin.
2. Volume Burst (Liquidity Sweep) 🟢
Zone Location: The lower green shaded box, extending down to approximately 1.23100.
Significance: This zone often acts as a Stop-Loss/Liquidity Pool. While the main entry is the "Reversal Zone," the "Volume Burst" area accounts for a potential liquidity sweep—a maneuver where price briefly dips below the main demand area to trigger stop losses before launching the intended move. Traders often place their absolute Stop Loss below this entire structure.
3. Order Flow (OF) / Target Origin
Location: The level where the strong initial impulse move started before the reversal.
Significance: This marks the last major structural high before the drop. A successful reversal from the Demand Zone would target this level (around 1.24800 to 1.25000) as the initial Take Profit area, confirming a shift back to bullish momentum.
📊 Trading Hypothesis: Buying the Demand
The trade plan is contingent on confirming demand in the entry zone:
Trade Direction: Long (Buy)
Entry Strategy : Entry is anticipated upon price entering the Reversal Zone (1.23300-1.23500). Traders should wait for a bullish confirmation pattern (e.g., a bullish engulfing candle or a clear rejection wick) on a lower timeframe (e.g., 1H or 30M) to validate the entry and refine the risk-to-reward ratio.
Stop Loss (S/L): The Stop Loss must be placed securely below the entire demand structure, safely below the Volume Burst zone (e.g., below 1.23000).
Take Profit (T/P) 1: The Order Flow (OF) / Target Origin area around 1.24800 to 1.25000.
Take Profit (T/P) 2 : Potential continuation to retest the recent swing high around 1.26800.
⚠️ Risk Management and Invalidation
The depth and aggressive nature of the preceding drop demand caution. The primary risk is that the current bearish pressure is strong enough to break the historical demand zone.
Invalidation: A decisive close below the Volume Burst area (e.g., below 1.23000) would completely invalidate this bullish setup, signaling a deeper structural break and the likely continuation of the bearish trend.

Gold Holds Its Breath Ahead of PMI: Breakout or Breakdown?If I had to describe gold right now, I’d call XAUUSD a “predator hiding in the bushes” — no longer in a wild breakout phase, but quietly waiting, watching, and preparing for the next news-driven move.
In terms of fundamentals, the market is awaiting the U.S. ISM Manufacturing PMI, forecast at 49.0, slightly higher than the previous 48.7, but still below the 50 threshold . In other words, the U.S. manufacturing sector is expected to look “less bad,” but not strong enough to change the bigger picture. With that backdrop, neither the USD nor gold has a solid reason to break out before the data — sentiment is simply: wait for the actual numbers, then move.
On the H4 chart, gold is pressing against the upper trendline, right at the 4,300–4,310 resistance zone , while support sits below at the 4,220 level overlapping the rising trendline and the Ichimoku cloud . These two areas form a natural “price box”: the top attracts profit-taking from buyers, the bottom attracts fresh dip-buyers — a classic setup for a healthy sideway accumulation phase.
My preferred scenario: XAUUSD may continue oscillating between 4,220–4,310, where spikes toward 4,30 tend to trigger selling, while dips to around 4,22 draw in buyers. As long as price does not clearly break out of either boundary, I consider this a sideway market within a larger bullish structure , ideal for trading the range rather than trying to predict the next breakout.

Accumulated price increase - bulls expect rate cut⭐️GOLDEN INFORMATION:
Expectations of further Fed rate cuts and inflation still above target continue to underpin gold and silver, said David Meger, director of metals trading at High Ridge Futures.
However, China’s physical gold demand has weakened at elevated price levels, which could weigh on the metal. According to the Financial Times, major retail chains have scaled back their presence in mainland China this year, while smaller sellers report that soaring prices and higher taxes have severely hurt sales.
⭐️Personal comments NOVA:
Gold price took H1 4193 breakout liquidity and reacted bullishly, still maintaining the uptrend, continuing to expect December rate cut
⭐️SET UP GOLD PRICE:
🔥SELL GOLD zone: 4274 - 4276 SL 4281
TP1: $4260
TP2: $4245
TP3: $4230
🔥BUY GOLD zone: 4145 - 4143 SL 4138
TP1: $4160
TP2: $4175
TP3: $4190
⭐️Technical analysis:
Based on technical indicators EMA 34, EMA89 and support resistance areas to set up a reasonable BUY order.
⭐️NOTE:
Note: Nova wishes traders to manage their capital well
- take the number of lots that match your capital
- Takeprofit equal to 4-6% of capital account
- Stoplose equal to 2-3% of capital account

Gold prices continue to recover 4277⭐️GOLDEN INFORMATION:
Gold (XAU/USD) trades firmer near $4,230 in early Asian hours on Monday, supported by rising expectations of a Fed rate cut in December. Markets now look ahead to Monday’s US ISM Manufacturing PMI for further direction.
Speculation of continued Fed easing remains a key driver for gold, with weaker US data and dovish comments from policymakers boosting bets on a December cut. The CME FedWatch Tool now shows an 87% probability of a rate reduction at the December 9–10 meeting, up from 71% last week. Lower rates reduce the opportunity cost of holding non-yielding gold, further supporting the metal
⭐️Personal comments NOVA:
Continued recovery momentum - gold price maintained its increase above 4205. Bulls believe in the last rate cut in December 2025
⭐️SET UP GOLD PRICE:
🔥SELL GOLD zone: 4275 - 4277 SL 4282
TP1: $4260
TP2: $4245
TP3: $4230
🔥BUY GOLD zone: 4195 - 4193 SL 4188
TP1: $4210
TP2: $4225
TP3: $4240
⭐️Technical analysis:
Based on technical indicators EMA 34, EMA89 and support resistance areas to set up a reasonable BUY order.
⭐️NOTE:
Note: Nova wishes traders to manage their capital well
- take the number of lots that match your capital
- Takeprofit equal to 4-6% of capital account
- Stoplose equal to 2-3% of capital account

GBP/USD Intraday Buy Setup – Targeting 1.32700Price has recently reacted strongly from the marked demand/support zone below, creating a bullish rejection wick and shifting short-term momentum upward. After the rebound, price is now attempting to break above the minor intraday resistance level (blue circle area).
A clean break and retest of this zone could signal the start of a bullish continuation move. If buyers maintain control, the structure suggests a potential push toward the 1.32650 – 1.32750 target zone, aligning with the projected higher-high shown on the chart.
Key Points
🔵 Support/Demand Zone: Strong buying pressure observed.
🔄 Potential Break & Retest: Price attempting to reclaim short-term resistance.
📈 Bullish Structure Forming: Higher-lows and higher-highs beginning to develop.
🎯 Target Area: 1.32700 region if bullish momentum holds.
What to Watch
Confirmation of a break and retest above the circled zone
Continuation of bullish candles with strong closes
Failure to hold above the zone may lead to a retest of the demand area below

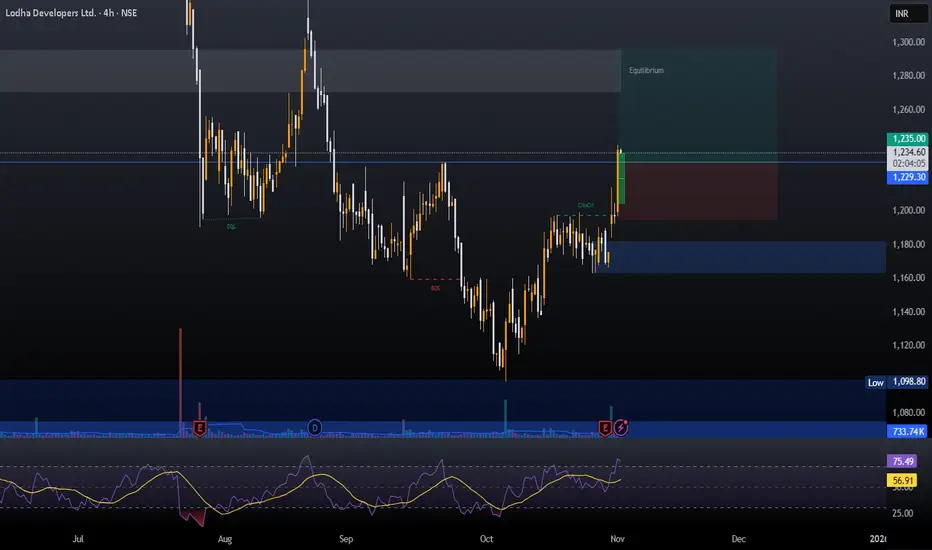
LODHAOne can look for long entry in LODHA here its giving a good breakout. The whole real estate sector is looking for a bull run.
Entry- 1229-1230.
Target 1280, 1300, 1320
Stoploss- 1190.
Disclaimer- This is just for educational purpose.
Jai Shree Ram.
XAUUSD: Strong Growth and Buying OpportunityWith the prospect of a Fed interest rate cut and the weakening of the USD, XAUUSD is showing signs of a strong growth phase. Based on macroeconomic news and technical charts, we can see that the price of gold continues to hold steady above the uptrend line .
XAUUSD is currently pulling back to instant support at 4,120,000 USD . The uptrend is supported by the EMA (34, 89) indicators and the current upward trend. The strong support at 4,120,000 USD plays a crucial role in maintaining this upward momentum.
Short-Term Forecast:
XAUUSD could continue to rise to higher levels if it holds above 4,120,000 USD, with the next target being the TP1 level at 4,200,000 USD , and even the TP2 level at 4,250,000 USD . This is supported by market expectations that the Fed will continue to lower interest rates in December, weakening the USD and boosting demand for gold as a safe-haven asset.
Conclusion:
With a stable upward trend and support from both the market and chart indicators, XAUUSD is likely to continue its upward movement. If there is a pullback to the support level, it will provide an excellent opportunity for buying.

ETH BREAKOUT: DON’T MISS THE NEXT BIG MOVE!📌 ETH/USD MARKET ANALYSIS – 30M (Professional Trader Style)
1. Overall Market Structure
- Price has been consolidating inside a descending channel.
- Forming consistent lower highs – lower lows, but selling pressure is weakening near the demand zone.
- Finally, price created a rectangle compression and then broke out aggressively above the descending trendline.
2. Key Zones
✔ Demand Zone (Strong Support): 2980 – 3010
Multiple rejections + strong bullish reactions → buyers clearly defend this area.
✔ Supply Zone (Key Resistance): 3065 – 3090
Price is approaching this zone again, but momentum suggests a high probability of BREAKING THROUGH.
3. Breakout Confirmation
The breakout candle shows:
- Strong bullish body
- Increased volume
- Clear break of previous lower high → CHOCH (Change of Character)
This signals that ETH is transitioning from a correction phase into a renewed bullish trend.
4. Trading Plan (Price Action Style)
📌 Primary Scenario – BUY the Retest
Wait for price to pull back into the broken supply zone (now a demand flip) at 3065–3075.
Enter BUY when you see:
- Rejection wicks
- Bullish engulfing
- FVG reaction
- Or any PA confirmation
🎯 TP1: 3120
🎯 TP2: 3160
🎯 TP3: 3200+
⛔ SL: Below 3045 (below breakout structure)
5. Why This BUY Setup Is High Probability
✔ Clean breakout of the descending channel
✔ Strong momentum push (not a weak fake-out)
✔ Beautiful defense at demand zone
✔ Trendline tested 3 times → valid breakout
✔ Market structure shift from bearish → bullish
6. Pro Tips
Don’t FOMO buy the breakout candle
Wait for a clean retest for better R:R
Focus on zone reaction + CHOCH + bullish momentum
Stay patient. The market always rewards disciplined traders.

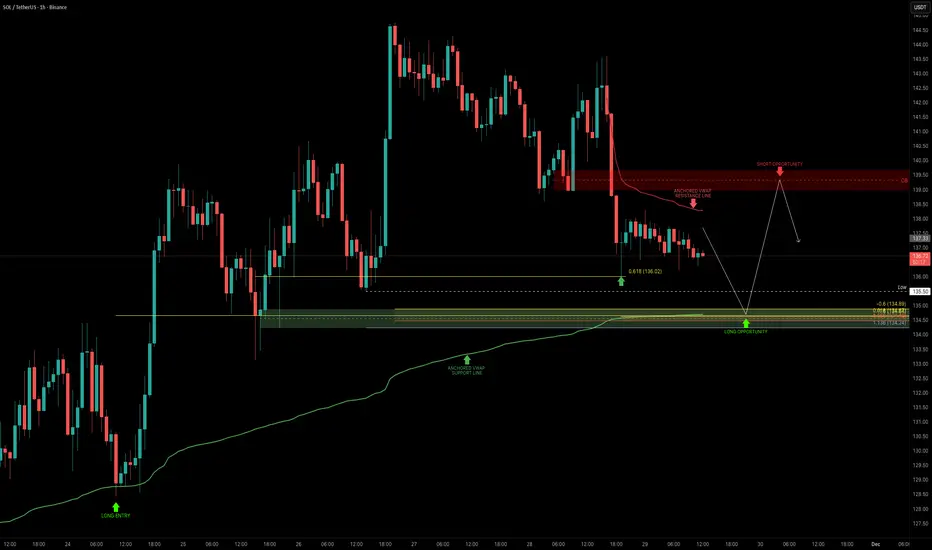
SOL — Fibonacci & Anchored VWAP ConfluenceSOL continues to be one of the most technically reliable assets, consistently respecting Fibonacci levels and key market structures. The zone between $135–$134 stands out as the next high-probability long opportunity, with multiple Fibonacci clusters lining up with the anchored VWAP from the swing low. The $134 level also aligns with the 75B market cap, adding an additional layer of confluence.
I’m looking for a long setup in this zone, targeting the $139–$140 order block for TP. This gives a clean 1:3 R:R, with the stop placed just below $133.
I’m currently developing a dynamic confluence indicator that highlights stacked support and resistance zones with high-probability reversal zones. The $139–$140 zone is currently showing a cluster of resistance, reinforcing it as the ideal TP target.
_________________________________
💬 If you found this helpful, drop a like and comment!
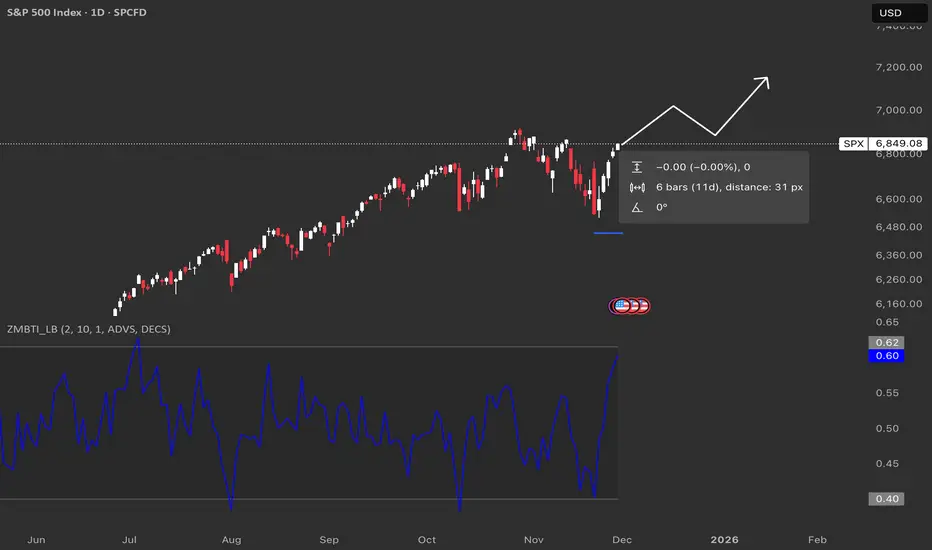
SPX : Potential Zweig Breadth ThrustThe Breadth Thrust Indicator is a technical indicator that looks at how many stocks advance vs. decline over 10 days.
When it snaps from around 0.40 to above about 0.615 in 10 trading days or less, that’s called a Zweig Breadth Thrust and has historically lined up with strong bull runs more often than not.
Historically it doesn’t happen often, but when it does, forward returns over the next several months have usually been positive, which is why traders get excited when the line on your chart surges like this.
Historically, once a full thrust has triggered, the index has often been higher 6–12 months later in the majority of cases.