AUD/USD: Buying Opportunity with Continued UptrendCurrently, AUD/USD is continuing its strong uptrend, and with macroeconomic factors supporting this move, the price is likely to continue rising in the short term. After breaking the 0.65 level, this pair is heading towards higher resistance levels, with the nearest target being 0.6570.
With high inflation in Australia, the Reserve Bank of Australia (RBA) is less likely to cut interest rates , which provides stability and support for the AUD. In addition, the expectation that the Federal Reserve will cut rates in December continues to weaken the USD, creating an opportunity for AUD/USD to rise. The current chart shows a recovery price pattern with solid support at the 0.6520 level, reinforcing the uptrend.
The next resistance level that AUD/USD could reach is 0.6570. If the price corrects to the 0.6520 area and holds, it will be an ideal buying opportunity to continue the uptrend. However, traders should be cautious with upcoming economic data from the US. If there is positive news from the US, the USD may quickly recover, causing a pullback for AUD/USD.
Longsetup

Scalp LONG – BOB🐂 Scalp LONG – BOB
BOB has broken its downtrend and successfully retested the breakout zone, confirming a structural shift in momentum. Price is now sitting firmly on a major multi-frame support, indicating strong buy-side defense. With sellers exhausted and structure reclaimed, a short-term recovery leg is highly probable.
Key Signals
Downtrend break + confirmed retest
Strong multi-timeframe support holding
Momentum recovery forming from the base
🎯 TP: 0.017783
🛡️ SL: 0.014713
📊 RR: 1 : 4.92
Một setup long rõ ràng, dựa trên cấu trúc đảo chiều và hỗ trợ vững chắc.

Gold prices continue to recover - above 4200⭐️GOLDEN INFORMATION:
Gold (XAU/USD) picks up fresh demand in Friday’s Asian session, rising to a two-week high as bulls target a move back toward $4,200. Growing expectations of a December Fed rate cut remain a major tailwind for the non-yielding metal, while a break above the $4,170–4,175 resistance zone has also fueled additional technical buying
⭐️Personal comments NOVA:
Continue to recover - break resistance and increase price. Gold price approaches resistance zone 4210 at the end of the week
⭐️SET UP GOLD PRICE:
🔥SELL GOLD zone: 4210 - 4212 SL 4217
TP1: $4200
TP2: $4185
TP3: $4170
🔥BUY GOLD zone: 4113 - 4115 SL 4108
TP1: $4130
TP2: $4140
TP3: $4160
⭐️Technical analysis:
Based on technical indicators EMA 34, EMA89 and support resistance areas to set up a reasonable BUY order.
⭐️NOTE:
Note: Nova wishes traders to manage their capital well
- take the number of lots that match your capital
- Takeprofit equal to 4-6% of capital account
- Stoplose equal to 2-3% of capital account

LULU Analysis | Crucial Support & Resistance Before EarningsIn this video, I break down a complete Lululemon (LULU) stock analysis ahead of its upcoming earnings.
You’ll learn the key support & resistance levels, expected volatility zones, and the technical signals that matter most.
🔍 What’s Inside the Video:
Lululemon’s current trend & momentum
Technical breakdown (chart pattern + volume + indicators)
Key support & resistance levels to watch
Earnings expectations & potential price reactions
Upside and downside targets
Risk zones and invalidation levels
Short-term and swing-trade ideas
📈 Why This Matters
LULU earnings often create huge price swings.
This video gives you a clear, actionable view of how the stock might react and what levels traders should focus on.

GBP/JPY: Strong Uptrend, Breakout or Correction?Hello traders! Today, we will analyze the GBP/JPY pair , which is currently in a strong uptrend and looking for opportunities to break higher.
The latest news from the UK shows expectations for a dovish policy from the Bank of England (BoE) , along with the weakening of the Japanese Yen (JPY) , which has pushed GBP/JPY higher. Additionally, the stability of the UK labor market has boosted confidence in the British Pound.
From a technical analysis perspective, on the H1 chart, GBP/JPY is moving in a clear uptrend channel . The price has surpassed 206.700 USD and is currently hovering near the resistance zone of 207.700 USD. The EMA 34 and EMA 89 are both supporting the upward trend, indicating a strong possibility of further gains in the short term.
The trading strategy is to buy when the price corrects to 206.700 USD and shows signs of reversal. The target for the uptrend could be 207.700 USD, and if the price breaks this level, we can expect it to move towards the 208.00 USD range. A stop loss should be placed at 205.500 USD to manage risk.

Interest Rate Cut – EUR/USD Soars, Great Buying Opportunity!We are witnessing a very exciting phase for EUR/USD. In the context of the US dollar continuing to face downward pressure due to expectations that the Fed will cut interest rates in December 2025, the euro is in a great position to continue its upward trend. Let’s take a closer look at the chart and key support levels to make the right decision.
The H4 chart of EUR/USD shows a clear bullish structure, with the price attempting to break the key resistance level around 1.1600 and continuing to rise strongly. Currently, the price is fluctuating around 1.1602, and according to technical forecasts, EUR/USD could continue to rise toward the 1.1650 level if it maintains support above the 1.1600 resistance.
Below the price, the area around 1.15500 serves as a strong support, where the price could bounce back in the case of a minor pullback. The appearance of higher lows indicates that the bullish trend remains intact.
With positive signals from both the market and technical analysis, buying EUR/USD during pullbacks remains a reasonable strategy. If the price continues to hold above the 1.1550 support, we can look to buy with a target at 1.1620, where a short-term sell-off might occur. If the trend remains strong, the next resistance level is at 1.1650, where EUR/USD may face selling pressure, but the preference remains to buy in line with the overall trend.

XAUUSD: Gold Continues to Rise on Rate Cut ExpectationsGold continues its upward trend from yesterday, with the current price at 4,159.455 USD. The chart shows that gold is moving within a stable upward channel, and if it maintains above this support level, there is a high likelihood that the price will continue towards the 4,190,000 USD level.
Why is gold continuing to rise?
Weaker-than-expected U.S. retail sales data has reinforced the forecast that the U.S. Federal Reserve (Fed) will cut interest rates in December 2025. This has weakened the USD, which in turn reduces yields and increases gold's appeal as a safe-haven asset. These factors, combined with expectations of rate cuts, suggest that gold has the potential to continue rising sharply.
Next Scenario:
If the price of gold stays above the 4,120,000 USD support zone, there is a high probability it will break through the 4,190,000 USD resistance level. The potential for continued upward movement could push gold to 4,230,000 USD in the near future.
With strong support and a favorable market backdrop, XAUUSD is likely to continue this upward trend, especially as labor market data from the U.S. is released.

Swiss Franc: Approaching Key ER SupportThe Swiss franc is now testing the lower boundary of the Expected Range (ER) — a zone for potential pause or bounce.
Also
this ER level aligns perfectly with a visible liquidity cluster (marked with arrow) .
📌 In other words:
It's not only a statistical support — it’s a confluence = higher probability reaction.

Gold price tries to return to 4194⭐️GOLDEN INFORMATION:
Gold (XAU/USD) edges lower in Thursday’s Asian session, slipping from Wednesday’s near two-week high, though losses remain limited. Expectations of lower US rates and optimism over a potential Russia-Ukraine peace deal are supporting broader risk sentiment, diverting some flows away from safe-haven gold amid light Thanksgiving-thinned trading
⭐️Personal comments NOVA:
maintain uptrend above 4100, continue to accumulate and try to return to 4194. Market is optimistic about December interest rate
⭐️SET UP GOLD PRICE:
🔥SELL GOLD zone: 4193 - 4195 SL 4200
TP1: $4180
TP2: $4170
TP3: $4150
🔥BUY GOLD zone: 4063 - 4061 SL 4056
TP1: $4078
TP2: $4090
TP3: $4108
⭐️Technical analysis:
Based on technical indicators EMA 34, EMA89 and support resistance areas to set up a reasonable BUY order.
⭐️NOTE:
Note: Nova wishes traders to manage their capital well
- take the number of lots that match your capital
- Takeprofit equal to 4-6% of capital account
- Stoplose equal to 2-3% of capital account

EUR/USD: Awaiting Strong Uptrend from Fed Cuts & Ukraine TalksWith promising news that the Fed may soon cut interest rates, the USD is facing downward pressure. At the same time, negotiations surrounding Ukraine are providing significant support for the euro. Combined with the EUR/USD chart on the H4 timeframe, this presents an excellent opportunity for us to expect a strong uptrend for this currency pair.
Chart Analysis and Technical Signals
Currently, the price of EUR/USD is sitting in a key support zone around 1.1500. This area is confirmed by strong support from the EMA 34 and 89 lines. In the current context, the price is expected to move upwards, with the next target being the 1.1600 level, a significant resistance zone.
We can see that after the price retraced to the 1.1500 support zone, if the price reacts well and does not break below 1.1520, this would be the ideal signal to open a buy position.
Trading Strategy:
Potential Buy Zone: When the price retraces to the 1.1500 level.
Take Profit Target: Around 1.1600.
Stop Loss: Below 1.1500.

GBP/JPY Set to Break 206.500 – Bullish Momentum StrongThe GBP/JPY chart shows a clear bullish structure with strong buying momentum being sustained. Since November 21, 2025, the price has stayed above the upward trendline , continuing to form higher lows and higher highs. The strong support zone is around 205.100, while the main resistance is at approximately 206.500.
Buy signals:
Upward trendline: The trendline provides a strong foundation for the next movement.
Lower timeframes: The 2-hour and 1-hour timeframes show strong buying pressure, confirming the bullish trend and the strong rebound after testing the support zone.
Next scenario:
With the current price at 205.500 and approaching 205.900, GBP/JPY may continue to target 206.500 in the short term. If it maintains above the support zones and continues receiving buying pressure, GBP/JPY is likely to break through resistance levels and extend its bullish trend.
Outlook:
The current bullish trend, supported by the strong demand zone and confirmed by lower timeframes, indicates the potential for continued strong upward movement.

Difficult and imperfect swing trade setup on BTCUSD dailyCOINBASE:BTCUSD has broken below its rising channel and is now exhibiting a downward trajectory. This shift creates a potential swing-trading opportunity arising from two distinct scenarios:
A reversal of the current downward trend, leading to a renewed bullish movement, or
A temporary pullback within the continuation of a broader bearish trend.
On the weekly timeframe, the first major traditional moving average above the current price is the 50-week moving average, positioned at approximately 100,000 USD. The daily chart reflects a similar structure: the nearest significant moving average above is again the 50-day moving average, also situated near 100,000 USD. This alignment establishes a notable—albeit high-risk—swing-trade setup. Should the price initiate even a micro bullish trend within a larger bearish context, the most probable target for such a move would be a reversion toward the 50 DMA at around 100,000 USD.
Supporting this thesis, several momentum indicators—specifically the RSI, Rate of Change (ROC), and MACD—are beginning to turn upward from recent troughs. This emerging positive momentum suggests that underlying buying strength may be forming, which would be consistent with the early stages of a bullish swing within a broader bearish structure.
A potential entry trigger on the daily chart would occur once price breaks above and remains above the 10 DMA for a sustained period (e.g., a 1- to 3-day confirmation filter, depending on risk tolerance). Historically, such moves have provided reliable signals on at least four consecutive prior occasions as depicted in the chart.
However, caution is warranted: daily closes above the 10 DMA are common, and many such moves fail to persist. This is why a multi-day filter is proposed—to increase the probability that the breakout represents a genuine shift rather than short-lived noise.
Proposed Trade Parameters
Entry: Break and sustained hold above the 10 DMA (estimated near 90,000 USD).
Take Profit (TP): Reversion to the 50 DMA (approximately 100,000 USD).
Stop Loss (SL): A daily close back below the 10 DMA (likely around 95,000 USD).
Risk–Reward Ratio: ~1:2.
Important Caveats: This setup is inherently imperfect, as both the entry and stop-loss levels are determined by moving averages and the trade itself yields a relatively modest risk–reward profile. Moreover, the rationale for a bullish retracement is based solely on technical patterns—specifically, the observation that counter-trend rallies frequently occur even within pronounced bearish phases. There is, at this point, no anticipated fundamental catalyst or macro-level justification supporting an imminent bullish move; the thesis is grounded entirely in probabilistic technical behaviour.

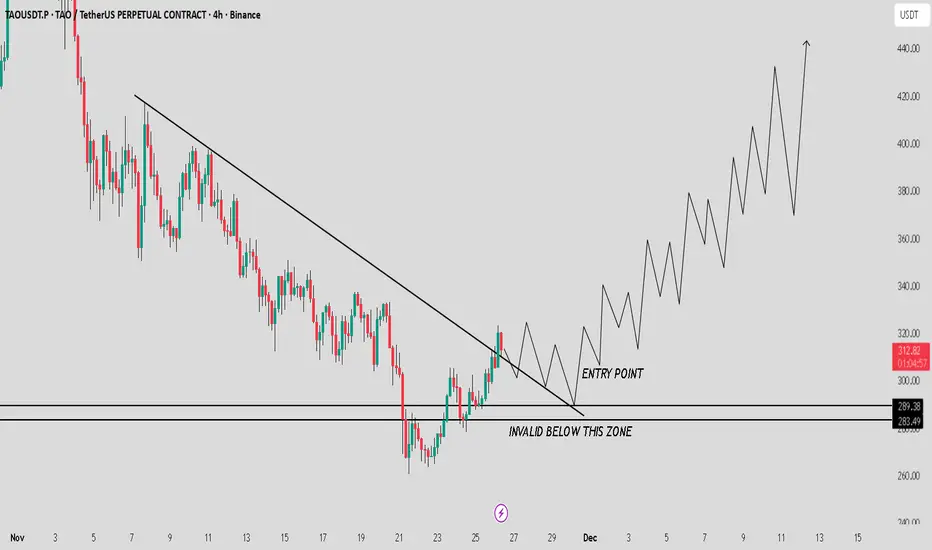
TAO / USDT : Strong above support and Ready for a bullish moveTAO / USDT is looking so good above the $283 – $289 levels…
If we see a clean retest and price holds above this zone, I’m expecting a strong upward movement towards $350 – $400 in the coming days. Momentum is picking up and structure is turning bullish step by step.
Manage risk wisely and follow the chart carefully… Breakdown below this zone will invalidate the setup.
Accumulate - will gold price return to 4200?⭐️GOLDEN INFORMATION:
Gold (XAU/USD) gains fresh momentum on Wednesday, rising above $4,160 to a one-and-a-half-week high after Tuesday’s US data signaled easing inflation and strengthened expectations for further Fed rate cuts. Supportive comments from several Fed officials have also pressured the US Dollar to a one-week low, boosting the non-yielding metal.
Still, the prospect of lower rates has lifted global risk appetite, limiting stronger safe-haven inflows into gold. Hopes for progress toward a Russia-Ukraine peace deal further cap upside. Even so, the broader outlook favors additional gains in XAU/USD as traders await more US data for direction
⭐️Personal comments NOVA:
Gold price accumulates - market recovers back to 4200 soon. Still expectations of interest rate cut in December
⭐️SET UP GOLD PRICE:
🔥SELL GOLD zone: 4194 - 4196 SL 4201
TP1: $4180
TP2: $4170
TP3: $4150
🔥BUY GOLD zone: 4103 - 4101 SL 4096
TP1: $4117
TP2: $4130
TP3: $4150
⭐️Technical analysis:
Based on technical indicators EMA 34, EMA89 and support resistance areas to set up a reasonable BUY order.
⭐️NOTE:
Note: Nova wishes traders to manage their capital well
- take the number of lots that match your capital
- Takeprofit equal to 4-6% of capital account
- Stoplose equal to 2-3% of capital account

AUDNZD at a critical support levelRisky play here but the potential upside is immense. With AUD CPI just dropping hotter at 3.8% vs 3.6% forecast and NZD lowering interest rate, again, this time by 25bps, the liquidity sweep that followed on the pair could be a gift for longs. The RSI is overbought on the daily, and has been due for a correction however fundamentals are screaming for a continuation of the upward move. Currently sitting sitting at a key uptrend support of a large pennant and the daily 50SMA simultaneously. If one were to play this pair, tight SL should be a priority. Anything can happen, nothing is certain.

XAU/USD: Strong Rally Fueled by Fed Rate Cuts and Weak USDGold prices have experienced a strong growth on November 24 , supported by expectations that the Fed will lower interest rates next month. The weakening USD has made gold less expensive for holders of other currencies, thereby driving the price of gold higher. The market is increasingly confident that the Fed will continue to cut interest rates , creating a favorable environment for gold to rise.
Chart Analysis: On the H4 chart, XAU/USD is trading within a clear ascending wedge . After testing the 4,090 support zone, the price could rebound and aim for 4,200. The support at 4,090 remains intact, indicating that the upward trend could continue in the short term. A break above the resistance levels near 4,150 could open up opportunities for gold to continue its upward movement.
Conclusion: With a positive macro backdrop and strong technical indicators , XAU/USD may continue its upward momentum, with a target of 4,200 in the near term, as long as the current trend persists.

Scalp LONG – ZRX🐂 Scalp LONG – ZRX
ZRX has broken its downtrend and is now pressing against the upper boundary of its accumulation range. A clean breakout from this box would open a strong path for price to retest the previous high. Momentum is stabilizing, and structure favors a bullish continuation if liquidity is cleared above the range.
Key Signals
Downtrend already broken → structure shifting bullish
Price compressing at the top of accumulation
Breakout = high probability move toward prior highs
🎯 TP: 0.1791
🛡️ SL: 0.1500
📊 RR: 1 : 2.38
A focused long setup, waiting for confirmation as ZRX escapes the range.

Scalp LONG – ROSE🐂 Scalp LONG – ROSE
ROSE has broken its short-term downtrend and is now stabilizing above a strong multi-timeframe support zone. RSI is turning upward, indicating improving momentum. With structure shifting bullish and overhead resistance nearby, a retest of the recent high is likely.
Key Signals
Short-term downtrend clearly broken
Price holding firmly above strong support
RSI rising → momentum recovery underway
🎯 TP: 0.01631
🛡️ SL: 0.01469
📊 RR: 1 : 2.18
A clean long setup aiming for a continuation push toward the previous high.

It's BLACK FRIDAY on Altcoins (ENA/USDT)Global multi-billion dollar altcoin market currently on support.
Many altcoins showing life after OVERSOLD for a while.
Grab some ENA and let it ride including TP prices such as 0.3450 - 0.5125 and 0.8100 as FINAL target.

GBPUSD Retracement Idea for a new Lower HighHi Traders!
Since my last idea GU reached my short target around 1.30000. I'm now looking for price to retrace to a previous bearish BOS area around 1.32500-1.33000. If price can create a new lower high in that area we could possibly see more bearish movement. In addition, if DXY can hold around 99.000-99.500, and continue reversing to the upside I'd have a new swing target for GU at the next Daily OB around 1.29000-1.28500.
1st alert set just below 1.32500 in case price doesn't make it to my target.
*DISCLAIMER: I am not a financial advisor. The ideas and trades I take on my page are for educational and entertainment purposes only. I'm just showing you guys how I trade. Remember, trading of any kind involves risk. Your investments are solely your responsibility and not mine.*

USDJPY Is About to Break the Channel – Sellers Are Rising?USDJPY is entering a phase of clear exhaustion after a prolonged bullish run. Price has touched the top of the ascending channel and was immediately rejected , leaving multiple upper wicks – a classic sign that buyers are losing momentum.
Around the 157.80 zone, selling pressure becomes increasingly dense. This is a supply area the market has reacted to multiple times. The closer price moves toward it, the stronger the absorption. No more explosive bullish pushes — instead, every slight attempt upward is quickly pulled back down.
The key level to watch now is 156.40. Price structure is showing signs of forming lower highs, and if the market retests 157.00–157.20 but fails to break through, USDJPY is likely to slide toward 156.40.
If 156.40 breaks, the H4 ascending channel is officially invalidated, and the bearish trend becomes clearer. From there, the market could extend downward toward 155.80.
In short, USDJPY is showing strong signs of weakening : slowing bullish momentum, repeated strong rejections, and a structure tilting toward the downside. A small pullback toward the 157.xx area may become the perfect chance for sellers to step back in.

Gold price recovers on accumulation margin⭐️GOLDEN INFORMATION:
Gold (XAU/USD) climbs to a one-and-a-half-week high in Tuesday’s Asian session, extending Monday’s nearly 2% surge as dovish Fed expectations strengthen. Recent remarks from key FOMC officials have boosted bets on a December rate cut, capping the US Dollar’s rally to its highest level since late May and supporting the non-yielding metal.
Geopolitical tensions—from the escalating Russia-Ukraine conflict to renewed unrest in the Middle East—are also lifting safe-haven demand. Still, upbeat equity sentiment limits stronger gains, while traders remain cautious ahead of this week’s major US data releases, starting with PPI and Retail Sales on Tuesday
⭐️Personal comments NOVA:
Gold price recovers - watch the reaction zone 4157. If it continues to break, gold price will continue to increase near 4200
⭐️SET UP GOLD PRICE:
🔥SELL GOLD zone: 4193 - 4195 SL 4200
TP1: $4180
TP2: $4170
TP3: $4150
🔥BUY GOLD zone: 4073 - 4071 SL 4066
TP1: $4085
TP2: $4098
TP3: $4110
⭐️Technical analysis:
Based on technical indicators EMA 34, EMA89 and support resistance areas to set up a reasonable BUY order.
⭐️NOTE:
Note: Nova wishes traders to manage their capital well
- take the number of lots that match your capital
- Takeprofit equal to 4-6% of capital account
- Stoplose equal to 2-3% of capital account

GBPUSD About to Drop Hard? Sellers Are Fully in Control!GBPUSD is entering a high-risk phase as both fundamentals and technicals are leaning strongly toward a bearish trend. With UK inflation falling to 3.6%, markets are now almost certain that the BoE will cut rates in December , which immediately weakens the British pound. Adding to the pressure, the upcoming Autumn Budget is expected to include significant tax increases, further weighing on the UK’s already fragile growth outlook.
Meanwhile, the US dollar continues to hold firm. Markets believe the Fed will keep rates higher for longer, and this week’s PCE and GDP data could further strengthen USD momentum. The DXY hovering around 100.22 shows that USD buyers are still in control.
From a technical standpoint, the chart shows GBPUSD being repeatedly rejected at the descending trendline. The 1.31200 area remains the key resistance zone where price is likely to be rejected again if it retests.
The primary scenario points to a weak pullback toward 1.31200 , followed by another leg down toward 1.30400. If US data comes in strong, 1.30400 may break, opening the door for a deeper bearish continuation.
If you want, I can format this as a YouTube script, a social-media caption, or an ultra-short summary.
