It's BLACK FRIDAY on Altcoins (ENA/USDT)Global multi-billion dollar altcoin market currently on support.
Many altcoins showing life after OVERSOLD for a while.
Grab some ENA and let it ride including TP prices such as 0.3450 - 0.5125 and 0.8100 as FINAL target.
Longsetup

GBPUSD Retracement Idea for a new Lower HighHi Traders!
Since my last idea GU reached my short target around 1.30000. I'm now looking for price to retrace to a previous bearish BOS area around 1.32500-1.33000. If price can create a new lower high in that area we could possibly see more bearish movement. In addition, if DXY can hold around 99.000-99.500, and continue reversing to the upside I'd have a new swing target for GU at the next Daily OB around 1.29000-1.28500.
1st alert set just below 1.32500 in case price doesn't make it to my target.
*DISCLAIMER: I am not a financial advisor. The ideas and trades I take on my page are for educational and entertainment purposes only. I'm just showing you guys how I trade. Remember, trading of any kind involves risk. Your investments are solely your responsibility and not mine.*

USDJPY Is About to Break the Channel – Sellers Are Rising?USDJPY is entering a phase of clear exhaustion after a prolonged bullish run. Price has touched the top of the ascending channel and was immediately rejected , leaving multiple upper wicks – a classic sign that buyers are losing momentum.
Around the 157.80 zone, selling pressure becomes increasingly dense. This is a supply area the market has reacted to multiple times. The closer price moves toward it, the stronger the absorption. No more explosive bullish pushes — instead, every slight attempt upward is quickly pulled back down.
The key level to watch now is 156.40. Price structure is showing signs of forming lower highs, and if the market retests 157.00–157.20 but fails to break through, USDJPY is likely to slide toward 156.40.
If 156.40 breaks, the H4 ascending channel is officially invalidated, and the bearish trend becomes clearer. From there, the market could extend downward toward 155.80.
In short, USDJPY is showing strong signs of weakening : slowing bullish momentum, repeated strong rejections, and a structure tilting toward the downside. A small pullback toward the 157.xx area may become the perfect chance for sellers to step back in.

Gold price recovers on accumulation margin⭐️GOLDEN INFORMATION:
Gold (XAU/USD) climbs to a one-and-a-half-week high in Tuesday’s Asian session, extending Monday’s nearly 2% surge as dovish Fed expectations strengthen. Recent remarks from key FOMC officials have boosted bets on a December rate cut, capping the US Dollar’s rally to its highest level since late May and supporting the non-yielding metal.
Geopolitical tensions—from the escalating Russia-Ukraine conflict to renewed unrest in the Middle East—are also lifting safe-haven demand. Still, upbeat equity sentiment limits stronger gains, while traders remain cautious ahead of this week’s major US data releases, starting with PPI and Retail Sales on Tuesday
⭐️Personal comments NOVA:
Gold price recovers - watch the reaction zone 4157. If it continues to break, gold price will continue to increase near 4200
⭐️SET UP GOLD PRICE:
🔥SELL GOLD zone: 4193 - 4195 SL 4200
TP1: $4180
TP2: $4170
TP3: $4150
🔥BUY GOLD zone: 4073 - 4071 SL 4066
TP1: $4085
TP2: $4098
TP3: $4110
⭐️Technical analysis:
Based on technical indicators EMA 34, EMA89 and support resistance areas to set up a reasonable BUY order.
⭐️NOTE:
Note: Nova wishes traders to manage their capital well
- take the number of lots that match your capital
- Takeprofit equal to 4-6% of capital account
- Stoplose equal to 2-3% of capital account

GBPUSD About to Drop Hard? Sellers Are Fully in Control!GBPUSD is entering a high-risk phase as both fundamentals and technicals are leaning strongly toward a bearish trend. With UK inflation falling to 3.6%, markets are now almost certain that the BoE will cut rates in December , which immediately weakens the British pound. Adding to the pressure, the upcoming Autumn Budget is expected to include significant tax increases, further weighing on the UK’s already fragile growth outlook.
Meanwhile, the US dollar continues to hold firm. Markets believe the Fed will keep rates higher for longer, and this week’s PCE and GDP data could further strengthen USD momentum. The DXY hovering around 100.22 shows that USD buyers are still in control.
From a technical standpoint, the chart shows GBPUSD being repeatedly rejected at the descending trendline. The 1.31200 area remains the key resistance zone where price is likely to be rejected again if it retests.
The primary scenario points to a weak pullback toward 1.31200 , followed by another leg down toward 1.30400. If US data comes in strong, 1.30400 may break, opening the door for a deeper bearish continuation.
If you want, I can format this as a YouTube script, a social-media caption, or an ultra-short summary.

$ALAB just tapped the Golden 618 fibALAB heavily into AI reported very strong earnings and is down $130 and just tapped the 618 golden Fibonacci level support

Algorand ALGO USDT Upcoming TAKE PROFIT POINTSHi Traders, Investors and Speculators of Charts📈📉
New Year 2026 loading....🥂🥳
Algorand is a decentralized network built to solve the Blockchain Trilemma of achieving speed, security, and decentralization simultaneously.
Algorand is designed to be a payments-focused network with rapid transactions and a strong focus on achieving near-instant finality which aims to be processing over 1,000 transactions per second (TPS) and achieving transaction finality in less than five seconds.
As a public smart contract blockchain that relies on staking, Algorand is also capable of hosting decentralized application (dApp) development and providing scalability. Rising gas fees on Ethereum have led many dApp developers and decentralized finance (DeFi) traders to look for alternative blockchain solutions. Algorand is capable of managing the high-throughput requirements of widespread global usage and a variety of use cases.
Technical Chart Analysis:
Algorand is still "in prison", but holding the 50d Moving Averages is the first step towards a new bullish cycle. Look at all of this upside potential!
Technical indicator Analysis:
If ALGO can get back ABOVE the 50d moving averages (0,18), that is when we can expect to see some serious bullish/parabolic price action.
You don't have to wait until then to trade algo. In the daily timeframe, there are some great setups for those who have a bit of patience, with low buy and high sells from 15% - 30% over a few weeks (in both shorts and longs).
Tis market is still moving, even though it doesn't neccesarily seem like it from a macro outlook.

Scalp LONG – WCT🐂 Scalp LONG – WCT
WCT has shifted from a decline into a sideways accumulation phase, indicating that selling pressure has weakened. The price is now holding firmly above a key multi-timeframe support, suggesting strong buyer defense. As momentum builds, a breakout from the current consolidation box could trigger a sharp upward move.
Key Signals
Accumulation after a downtrend → momentum rebuilding
Price holding above strong multi-TF support
High probability of bullish breakout once price escapes the range
🎯 TP: 0.01368
🛡️ SL: 0.1080
📊 RR: 1 : 3
A clean long setup anticipating a volatility expansion to the upside.

Scalp LONG – SAPIEN🐂 Scalp LONG – SAPIEN
Sapien’s price is currently holding above a major support zone on the lower timeframes, indicating weakening selling pressure and short-term market stability. There is no significant resistance overhead, creating favorable conditions for a brief technical rebound.
This setup supports a short-term long position based on strong support, stable price structure, and a clear upside gap.
🎯 TP: 0.14138
🛡️ SL: 0.11925
📊 RR: 1 : 3.14
A short-term bounce is a high-probability scenario as long as price continues to hold above this key support.

XAUUSD: Stuck Above 4,000, Just Waiting for the Next DropThe current context shows gold being “squeezed” between two forces : on one side, improving risk appetite as markets expect the Fed to cut rates; on the other, ongoing geopolitical and global financial concerns . As a result, price is holding above 4,000 but finding it hard to break higher.
On the H1 chart, XAUUSD is moving sideways with a slight downside tilt, spending most of the time inside or below the Ichimoku cloud . The latest bounce only reached the 4,100 area before being sold off again, showing that the cloud and the top of the channel are still acting as a lid on the downtrend. In the middle of the range, price is hovering around the temporary support at 4,050 – which is also the level highlighted on the chart as a potential breakdown point.
Trading idea: if price fails to hold 4,100 and we get a clear H1 close confirming weakness, the intraday bearish trend could resume and drag gold back toward the 4,050 zone.
Good luck and trade safe!

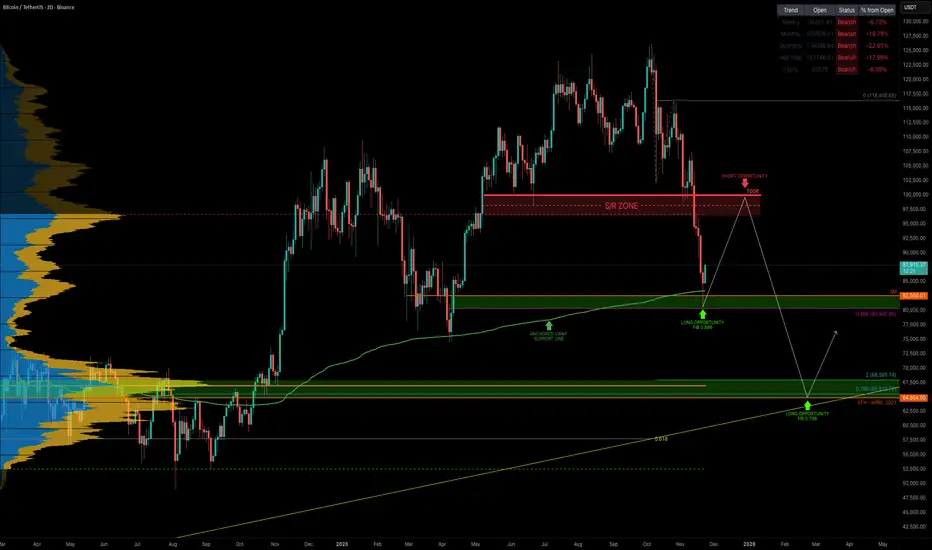
BTC temporary recovery - short term this week📌 BTC Weekly Outlook Update — Plan Remains on Track
Bitcoin continues to follow the expected roadmap with precision. The recent price action confirms a corrective move to the upside before resuming the larger bearish structure.
📍 Current Structure & Price Behavior
BTC has shown a short-term bullish retracement after forming a temporary low. However, the overall outlook remains bearish as price continues to trade below key moving averages and under the major downtrend line.
Price is now heading toward the resistance area between 94,300 and 100,780 USD, where the following confluence exists:
Previous support turned resistance
Fibonacci retracement zone
Trendline rejection zone
Liquidity pool
This area remains the most important zone to watch early this week.
📈 Expected Move — Still Valid
The original plan remains unchanged:
Short-term move upward into the supply zone at 94K → 100K.
Rejection and continuation of the downtrend.
Price targets the Fibonacci 1.618 extension zone at ~80,000 USD.
🎯 Key Target: Fibonacci 1.618 (≈ 80,500 USD)
This level is crucial as it aligns with:
✔ A major demand zone
✔ The 1.618 Fibonacci extension
✔ A deep liquidity sweep level
✔ Potential cycle correction completion
This area is expected to act as the macro support level where buyers step in aggressively.

BTC Euphoria to Fear: Is This the Start of the Bitcoin Winter?Is the Bitcoin bear market here? A deep dive Into cycles, tech risks & what comes next.
Bitcoin has now dropped –36% from its all-time high in just 46 days, and naturally the big questions emerge:
Has the bear market officially begun?
How long could it last?
And what catalysts could accelerate it?
Let’s break this down from cycle structure to macro-technological risks.
BTC Has Turned Bearish Across All Major Timeframes
Bitcoin is now trading below the yearly open at $93,576, flipping all major timeframes into bearish alignment (from the daily to the yearly).
Monthly MACD Bearish Cross Incoming
The monthly MACD is set to print a bearish crossover this month.
The last bullish MACD phase lasted 28 months, which has now ended → a strong macro signal.
Cycle Timing: What History Says
Historically, Bitcoin bottoms approximately one year after the top:
2017 → 2018: 363 days
2021 → 2022: 376 days
If the current cycle repeats, the macro bottom may form around:
October 2026
The previous bull market lasted 1061 days, this one 1050 days → almost identical.
This strongly supports the thesis that the cycle has already peaked.
How Low Could Bitcoin Go?
Macro target:
0.786 Fibonacci Retracement → $39,173
Aligning with:
Half-year 21 EMA confluence
Macro corrective structures
Prior cycle bear market depth
Historical Precedent: The 2022 Bottom Zone
Back in 2022, Bitcoin spent 210 days (over 7 months) consolidating at the bottom of the bear market.
This was especially clear on the weekly timeframe, where price formed a clean multi-month accumulation range.
Weekly TF:
Daily TF:
This is crucial context:
👉 The market gave more than half a year to load up at the bottom.
No chasing, no rushing → anyone paying attention had time to scale into positions for the next cycle.
The 2025 Macro Top Landed Perfectly in the 1.618–1.666 Fib Target
Fib 1.618–1.666
→ $122,056 – $125,218
This area was the ideal sell zone, and Bitcoin respected it perfectly.
What happened after hitting the Fib target?
The market entered a 3-month distribution phase, giving plenty of time to:
scale out
take profit
derisk
rotate into stablecoins or simplified portfolios
Then came the aggressive sell-off → classic macro cycle behavior.
Macro Catalysts That Could Drive the Bear Market Deeper
1️⃣ Quantum Computing Acceleration
A credible quantum breakthrough (or even a strong rumor) could trigger systemic fear.
Bitcoin’s ECDSA signatures are theoretically vulnerable to quantum attack models.
2️⃣ Fast-Paced AI Threats
AI is accelerating:
algorithmic optimization
cryptographic analysis
zero-day discovery
hardware design
The risk matrix is evolving faster than coding standards can update.
3️⃣ Regulatory Momentum
Expect:
stablecoin restrictions
exchange tightening
AML/KYC global enforcement
This would accelerate risk-off behavior.
Technical Confluence: Where BTC Is Now
Monthly 21 EMA/SMA → 86.6K
Current support test.
Quarterly (3M) 21 EMA/SMA
EMA: $58.5K
SMA: $53.5K
Strong structural support zone.
Half-Year (6M) 21 EMA/SMA
EMA: $39.5K
SMA: $29.8K
The EMA aligns perfectly with the 0.786 retracement → $39,173.
Remember that the EMA/SMA levels mentioned are dynamic and will continue to shift over time as new price data comes in, so these confluence zones will gradually adjust.
Additional Confluence: Potential Head & Shoulders (Bars Pattern Symmetry)
A potential Head & Shoulders Pattern is forming in symmetry with the previous bull market top, as shown through the bars pattern overlay.
Trading Playbook: Short the Bull Trap
The most likely scenario:
BTC bounces into $95K–$100K → traps late bulls → rejects → cascade lower
Targets:
TP1: $76K
TP2: $70K
Remaining: trail into $65K → $58K → $39K
Final Outlook
Bitcoin is now deeply aligned with a macro reversal:
Perfect Fib 1.618–1.666 top
Break of yearly open
Cycle timing consistent
Monthly MACD turning bearish
Quantum + AI risk factors accelerating
Structural confluence targets $70K → $40K
Pattern mirroring the previous cycle top
_________________________________
💬 If you found this helpful, drop a like and comment!
EUR/JPY - New ATH after pullback?EUR/JPY - STRONGEST SETUP among the major forex pairs
Current: 180.005
Structure: Bullish trend, AT ALL-TIME HIGHS/major resistance
Conviction: EURX currently strongest currency index, JPYBasket currently among the weakest
KEY LEVELS
Resistance Zones:
180.00-180.50 ← AT RESISTANCE NOW (your line)
181.50-182.00 ← All-time highs / breakout level
Support Zones:
179.50-180.00 ← Immediate support
178.50-179.00 ← Minor pullback zone
176.00-177.00 ← Major pullback support
175.50-176.00 ← Lower support
162.00-165.00 ← Long-term support (your orange box on daily)

Accumulated price zone 4100, there is a recovery✍️ NOVA hello everyone, Let's comment on gold price next week from 11/24/2025 - 11/28/2025
⭐️GOLDEN INFORMATION:
Gold (XAU/USD) holds firm in Friday’s North American session after Fed officials signaled the possibility of a December rate cut. The metal trades near $4,096, up 0.53%, after briefly touching $4,101.
Despite mixed US data and shifting rate expectations, XAU/USD has moved sideways for the past three days as traders remain uncertain about its next direction. Recent Fed commentary and the return of key economic releases suggest a steady economy with a strong labor market and persistent inflation pressures
⭐️Personal comments NOVA:
Gold price accumulates around 4100, showing signs of recovery when breaking the short-term downtrend
🔥 Technically:
Based on the resistance and support areas of the gold price according to the H4 frame, NOVA identifies the important key areas as follows:
Resistance: $4133, $4242
Support: $4033, $3982
🔥 NOTE:
Note: Nova wishes traders to manage their capital well
- take the number of lots that match your capital
- Takeprofit equal to 4-6% of capital account
- Stoplose equal to 2-3% of capital account
- The winner is the one who sticks with the market the longest

XRPUSD testing monthly 20EMA supportCritical area for XRP bulls. If the Monthly 20EMA holds (overlayed on this 4H chart) we could see price retrace to the high 2.20s/low 2.30s to test the resistance at the Monthly 10EMA. Needless to say that the RSI is oversold on multiple time frames but with the algorithm set to "sell off" the RSI has become useless for now. As always, on a play like this, tight SL and sniper entries.

Understanding Forex Money Flow: Risk-on & Risk-offWhen it comes to Forex, most traders focus on technicals, chart patterns, or indicators. But “money flow” — the force that truly moves price — is often overlooked. If you want to read the market like a pro, you must understand Risk-on and Risk-off: the two sentiment states that drive global capital.
Today, let’s break them down clearly, practically, and in a way you can apply immediately.
🔥 What Is Risk-on?
“Risk-on” appears when the market is optimistic, investors seek risk, and money flows strongly into high-return assets.
Signals of a Risk-on Environment:
Strong stock market rallies
Capital shifts into riskier assets
Bond yields rise
Positive economic news or geopolitical easing
Assets That Benefit in Forex:
AUD, NZD, CAD (commodity currencies)
GBP, EUR (when the economy is stable)
Bitcoin, oil, and equities also tend to rise
Risk-on = “The market is excited → money flows into high-yield assets”.
💥 What Is Risk-off?
“Risk-off” occurs when the market fears uncertainty, causing money to move toward safe-haven assets.
Signals of a Risk-off Environment:
Stock markets fall sharply
Money exits risky assets
Gold spikes
USD and JPY strengthen
Negative economic news, war, inflation, or political instability
Assets That Benefit in Forex:
USD, JPY, CHF
Gold (XAUUSD)
U.S. government bonds
Risk-off = “The market is scared → money runs to safety”.
❓ Why Forex Traders MUST Understand Risk-on / Risk-off
No matter what indicator you use, the market ultimately reacts to major capital flow.
Understanding these two states helps you:
Trade with market sentiment → dramatically increases win rate
Avoid entering trades against the money flow → fewer “pointless stop-loss hits”
Identify strong/weak currencies → choose high-probability setups
Many perfect technical setups fail simply because they go against global money flow.
📌 How to Apply This Immediately in Your Forex Trading
1. Check the News → Identify Sentiment
Good news? Strong GDP? Stable markets? → Risk-on
Bad news? War? Inflation? Hawkish Fed? → Risk-off
2. Compare Currency Strength
Simple formula:
Risk-on → prioritize BUY AUD, NZD, CAD
Risk-off → prioritize BUY USD, JPY, CHF
3. Follow the Trend — Avoid Fighting Money Flow
The strongest trends often come from shifts between Risk-on and Risk-off.
Examples:
Bad news → JPY strengthens → XXXJPY pairs fall hard
Risk-on returns → USD weakens → gold rises quickly
Follow the money flow, and you’re already ahead of 80% of traders.
🧠 Conclusion – If You Want to Trade Smart, Trade With the Money Flow
Risk-on and Risk-off aren’t just theory — they’re the compass that reveals market psychology, which is the foundation of every trend.
Want to trade like Smart Money?
→ Watch where the money is moving, not just where the candles are going.

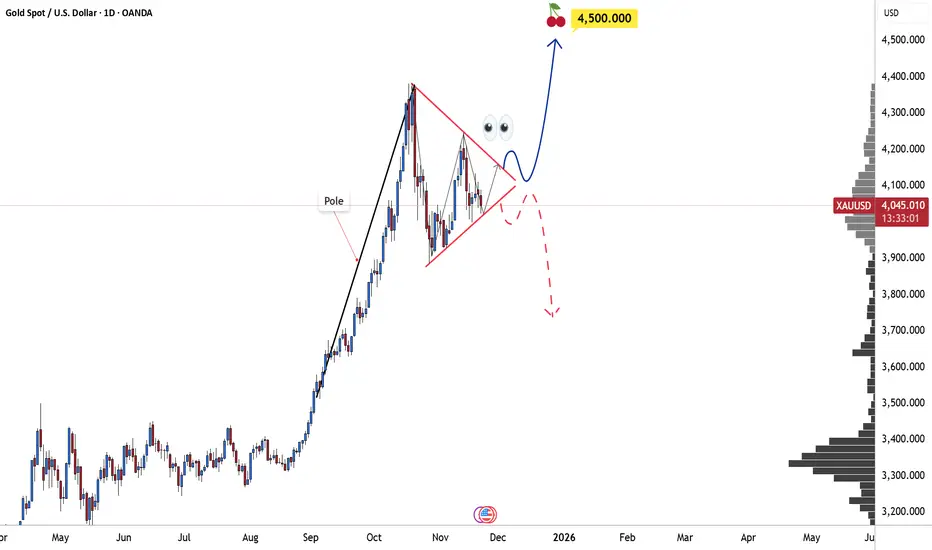
Gold at a Turning Point: Will It Rise or Fall?As we zoom in and take a closer look at how GOLD is moving, one thing becomes immediately clear:
The market has just shown a powerful upward surge, but now something intriguing is happening. The price is compressing, forming a tight, small triangle, a sign that the market is building up energy. In moments like this, there are usually two potential paths, but given the bullish context, I can almost feel that a breakout to the upside is the more likely scenario.
What do you think? Do you agree with me?
Let me know your thoughts in the comments! And trust me, joining the TradingView community is one of the best ways to improve your skills as a trader every single day.
Just a reminder: this isn't financial advice, but rather my personal take on the chart.
BTCUSDT – Blue Box Reversal IncomingHi fellow traders,
On the 1D BTCUSDT chart, I am applying Elliott Wave principles to outline a potential long setup. Price has tapped into the blue box after completing a ZIGZAG correction, and this region may provide the foundation for the next impulsive leg within the higher-degree structure.
I am entering at the current price, with a Stop Loss at 73,900.00. My Take Profit is set at 132,366.25, based on the projected continuation of the larger impulsive count.
If price breaks below the structural low around the stop level, this trade is no longer valid.
Good luck and trade safe!

Is Gold About to Fall? Strong USD Pressures XAUUSD DownThe gold market is entering a sensitive phase as buying momentum gradually weakens, while the USD strengthens again following a series of positive economic releases . There is a sense of “calm before the storm”, and XAUUSD is now tilting toward a bearish direction.
U.S. data shows a clear recovery in the labor market: NFP surged far above expectations , hourly earnings remained stable, and the Fed is expected to maintain a cautious stance. These factors combined have boosted the USD , putting direct pressure on gold.
From a technical perspective, XAUUSD keeps getting rejected at the 4,080 resistance zone . A rounding-top pattern is forming, Ichimoku signals are weakening, and each rebound is becoming smaller. The 4,000 support level has been tested repeatedly , suggesting a rising probability of a breakdown.
If price fails to break above 4,080, gold may continue pulling back toward 4,000, and could even extend the decline to 3,930, the next major support zone. This remains the most reasonable scenario as both fundamentals and technicals align to the downside.

EURUSD is preparing for a major reversal counterattack?There are phases when the market drops so deeply that everyone believes the downtrend is already sealed. Yet right in the quietest moments, buying pressure begins to accumulate the strongest. EURUSD is now sitting precisely at that “compression point”.
The latest economic data shows a clearly weakening USD: lower employment, rising unemployment, declining income, and the Fed signaling a softer stance. Meanwhile, Germany’s PMI came in better than expected, strengthening the EUR.
-> Combined together: Strong EUR – Weak USD → The bullish trend becomes significantly reinforced.
On the chart, EURUSD is forming a bottom around 1.15100 and moving into a highly attractive accumulation zone. The Ichimoku cloud is thinning, and price keeps bouncing from support — signaling an upcoming shift in momentum. The structure suggests a strong likelihood that EURUSD will retest 1.16000 within the next few sessions.
The ideal entry zone sits around 1.15100 – 1.15250, targeting 1.15700 and later 1.16000. When fundamentals and technicals align, the bullish move is often very strong and very fast.
EURUSD is “waking up” again, and unless unexpected volatility strikes, this breakout could happen sooner than most traders think.

GBPJPY: Weak Yen, Strong GBPGBPJPY is currently in a strong uptrend, thanks to the weakening of the Japanese yen . Japan's policies, especially those related to interest rates and financial plans , have put significant pressure on the yen. This has allowed the British pound (GBP) to maintain its strength, especially as investors shift to higher-yielding assets.
The H1 technical chart shows GBPJPY moving within a clear ascending wedge . The price is fluctuating between a solid support level at 205.00 and resistance at 205.80. The EMA indicators support this uptrend, indicating that the price will likely continue to rise as long as it stays above these support levels.
With the weakening yen and supportive factors from the chart , GBPJPY could continue to rise to higher levels, particularly 205.80 in the short term. Traders can look for buying opportunities when the price adjusts to near the 205.00 support level, creating a favorable entry point.
With the combination of fundamental and technical factors , GBPJPY has the potential to continue maintaining its uptrend. The next resistance level will be 205.80, and if it breaks through, the pair could continue to reach higher targets in the near future.

Xau/Usd - Compression Near Support, Breakout ImminentPrice is currently trading around 4057, sitting just above a key support zone highlighted on the chart. This area has been tested multiple times, showing strong buying interest each time price dips into it.
A descending trendline resistance has been respected over several touches, forming a short-term downtrend structure. However, price is now compressing between this trendline and the support zone, suggesting a potential breakout setup.
🔍 What I’m Watching
If buyers continue to defend the support zone, we could see a bullish reversal.
A clean break and retest above the trendline resistance may signal bullish momentum building.
The projected TARGET area aligns with prior reaction levels and the next significant liquidity pocket.
Bullish Scenario
Price bounces from support
Breaks above the descending trendline
Retest confirms the breakout
Targeting the 4100+ area shown on the chart
Bearish Risk
A strong close below the support zone would invalidate the setup
Could lead to further downside pressure

Planning a long swing based on these confluencesHi Traders!
In my opinion, GJ continues to be bullish. I posted a mind on Oct. 31st about how I thought GJ was in a retracement phase, and it seems to be trying to reverse out of that retracement.
A few confluences that stand out to me are- an attempt to make a Invert. Head and Shoulder, and a bullish 4HR CHOCH. Now, I'm looking to take a long swing, but in order for me to do that I need my confluences to be lined up to make the best logical decision.
My desired entry targets would be at 202 or 201.500. 201.500 would bring price to a 4HR OB/consolidation area that price broke out of on Friday, Nov. 7th.
However, if price doesn't make it to my desired areas, I may wait for a break above 203.200 with a strong candle close (Higher TF). That could confirm the bullish 4HR CHOCH.
I like to give GJ room to move, so if 203.200 is the case, my SL would potentially be just below 202/last higher low. This is all depending on how GJ moves. TP swing target 207-207.500 with taking profits in between.
Leave a comment, and let me know your thoughts!
*DISCLAIMER: I am not a financial advisor. The ideas and trades I take on my page are for educational and entertainment purposes only. I'm just showing you guys how I trade. Remember, trading of any kind involves risk. Your investments are solely your responsibility and not mine.*
