Is Gold About to Fall? Strong USD Pressures XAUUSD DownThe gold market is entering a sensitive phase as buying momentum gradually weakens, while the USD strengthens again following a series of positive economic releases . There is a sense of “calm before the storm”, and XAUUSD is now tilting toward a bearish direction.
U.S. data shows a clear recovery in the labor market: NFP surged far above expectations , hourly earnings remained stable, and the Fed is expected to maintain a cautious stance. These factors combined have boosted the USD , putting direct pressure on gold.
From a technical perspective, XAUUSD keeps getting rejected at the 4,080 resistance zone . A rounding-top pattern is forming, Ichimoku signals are weakening, and each rebound is becoming smaller. The 4,000 support level has been tested repeatedly , suggesting a rising probability of a breakdown.
If price fails to break above 4,080, gold may continue pulling back toward 4,000, and could even extend the decline to 3,930, the next major support zone. This remains the most reasonable scenario as both fundamentals and technicals align to the downside.
Longsetup

EURUSD is preparing for a major reversal counterattack?There are phases when the market drops so deeply that everyone believes the downtrend is already sealed. Yet right in the quietest moments, buying pressure begins to accumulate the strongest. EURUSD is now sitting precisely at that “compression point”.
The latest economic data shows a clearly weakening USD: lower employment, rising unemployment, declining income, and the Fed signaling a softer stance. Meanwhile, Germany’s PMI came in better than expected, strengthening the EUR.
-> Combined together: Strong EUR – Weak USD → The bullish trend becomes significantly reinforced.
On the chart, EURUSD is forming a bottom around 1.15100 and moving into a highly attractive accumulation zone. The Ichimoku cloud is thinning, and price keeps bouncing from support — signaling an upcoming shift in momentum. The structure suggests a strong likelihood that EURUSD will retest 1.16000 within the next few sessions.
The ideal entry zone sits around 1.15100 – 1.15250, targeting 1.15700 and later 1.16000. When fundamentals and technicals align, the bullish move is often very strong and very fast.
EURUSD is “waking up” again, and unless unexpected volatility strikes, this breakout could happen sooner than most traders think.

GBPJPY: Weak Yen, Strong GBPGBPJPY is currently in a strong uptrend, thanks to the weakening of the Japanese yen . Japan's policies, especially those related to interest rates and financial plans , have put significant pressure on the yen. This has allowed the British pound (GBP) to maintain its strength, especially as investors shift to higher-yielding assets.
The H1 technical chart shows GBPJPY moving within a clear ascending wedge . The price is fluctuating between a solid support level at 205.00 and resistance at 205.80. The EMA indicators support this uptrend, indicating that the price will likely continue to rise as long as it stays above these support levels.
With the weakening yen and supportive factors from the chart , GBPJPY could continue to rise to higher levels, particularly 205.80 in the short term. Traders can look for buying opportunities when the price adjusts to near the 205.00 support level, creating a favorable entry point.
With the combination of fundamental and technical factors , GBPJPY has the potential to continue maintaining its uptrend. The next resistance level will be 205.80, and if it breaks through, the pair could continue to reach higher targets in the near future.

Xau/Usd - Compression Near Support, Breakout ImminentPrice is currently trading around 4057, sitting just above a key support zone highlighted on the chart. This area has been tested multiple times, showing strong buying interest each time price dips into it.
A descending trendline resistance has been respected over several touches, forming a short-term downtrend structure. However, price is now compressing between this trendline and the support zone, suggesting a potential breakout setup.
🔍 What I’m Watching
If buyers continue to defend the support zone, we could see a bullish reversal.
A clean break and retest above the trendline resistance may signal bullish momentum building.
The projected TARGET area aligns with prior reaction levels and the next significant liquidity pocket.
Bullish Scenario
Price bounces from support
Breaks above the descending trendline
Retest confirms the breakout
Targeting the 4100+ area shown on the chart
Bearish Risk
A strong close below the support zone would invalidate the setup
Could lead to further downside pressure

Planning a long swing based on these confluencesHi Traders!
In my opinion, GJ continues to be bullish. I posted a mind on Oct. 31st about how I thought GJ was in a retracement phase, and it seems to be trying to reverse out of that retracement.
A few confluences that stand out to me are- an attempt to make a Invert. Head and Shoulder, and a bullish 4HR CHOCH. Now, I'm looking to take a long swing, but in order for me to do that I need my confluences to be lined up to make the best logical decision.
My desired entry targets would be at 202 or 201.500. 201.500 would bring price to a 4HR OB/consolidation area that price broke out of on Friday, Nov. 7th.
However, if price doesn't make it to my desired areas, I may wait for a break above 203.200 with a strong candle close (Higher TF). That could confirm the bullish 4HR CHOCH.
I like to give GJ room to move, so if 203.200 is the case, my SL would potentially be just below 202/last higher low. This is all depending on how GJ moves. TP swing target 207-207.500 with taking profits in between.
Leave a comment, and let me know your thoughts!
*DISCLAIMER: I am not a financial advisor. The ideas and trades I take on my page are for educational and entertainment purposes only. I'm just showing you guys how I trade. Remember, trading of any kind involves risk. Your investments are solely your responsibility and not mine.*

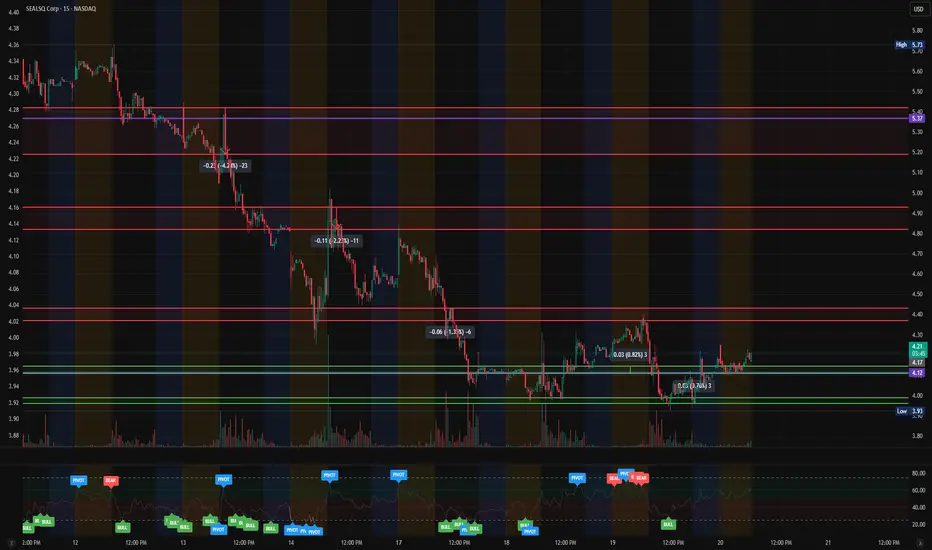
$LAES — Watching for a Reversal Attempt After Finding Bid SupporNASDAQ:LAES has been in a controlled downtrend over the past several sessions, but today’s early movement shows the first signs of stabilization. Price has now tested the $4.12 demand zone multiple times and continues to hold, creating a potential short-term base for a bounce attempt.
This level has acted as the intraday pivot between continuation and reversal — and the more it’s defended, the more likely we get a push back toward the overhead red resistance bands.
Today’s price action is showing small but consistent higher lows on the 15-minute chart, signaling early accumulation.
📊 Technical Overview
Support Levels: $4.12 → $3.93 → $3.88
Resistance Levels: $4.17 → $4.26 → $4.40 → $4.73
Structure: Micro downtrend → flattening momentum → possible short-term base
Momentum: Early intraday bullish signals printed on the RSI with small bullish divergence
Trend Bias: Neutral → modestly bullish above $4.12
Price has not yet broken the larger red zone overhead, meaning buyers still need confirmation before momentum fully shifts.
📈 What to Watch Next
1️⃣ Reclaim of $4.26
This is the first meaningful trigger that would flip intraday momentum bullish.
A break above $4.26 opens the door to a move into:
$4.40
$4.73
And potentially the $5.17–$5.40 zone (major prior liquidity pocket)
This entire area is stacked with prior sell orders — if volume comes in, it can accelerate quickly.
2️⃣ Holding $4.12 Support
This is the key to maintaining the current structure.
A close below $4.12 risks:
A drop into $3.93
And the final support at $3.88
Below $3.88, the chart re-enters the deeper breakdown zone.
For now, buyers are defending this level well.
💡 My Plan
Reversal Entry: $4.17 → $4.22 on higher-low confirmation
Breakout Entry: $4.27+ on volume
Targets: $4.40 → $4.73
Stretch Target: $5.17 / $5.40
Invalidation: Breakdown below $4.12 → back into bearish continuation
This chart is still early in the reversal formation — but if the $4.12 base holds, momentum traders will start stepping in.
🔥 Final Thoughts
NASDAQ:LAES is showing its first signs of stabilization after a multi-session sell cycle.
Now all eyes are on whether it can reclaim $4.26 to flip momentum.
Do you see NASDAQ:LAES attempting a reversal here — or does it need one more pullback before liftoff?
Drop your thoughts ⬇️ and I’ll post the updated chart with new levels.
NASDAQ:WKEY $LAESQ
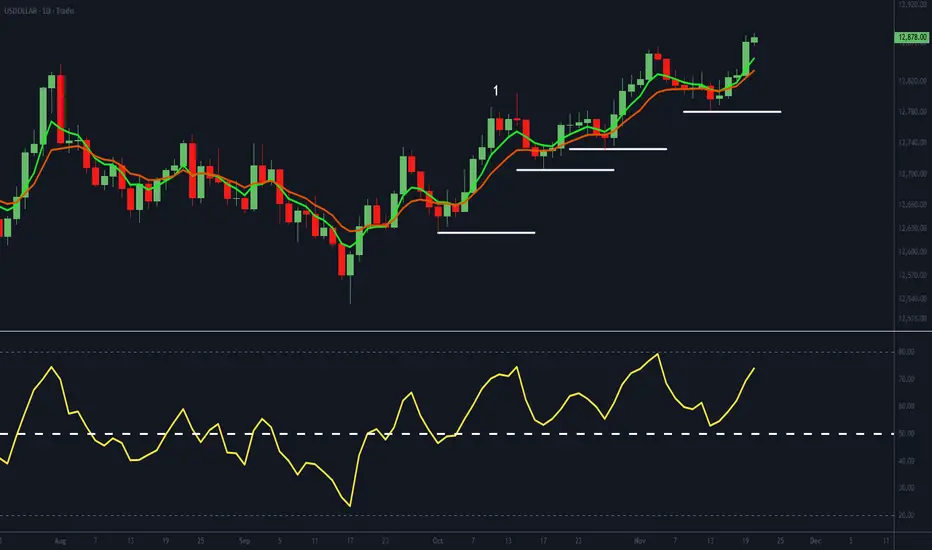
The Dollar’s Climb: A Trend With More Fuel in the Tank?The USDOLLAR daily chart is in a clear uptrend, defined by a sequence of higher troughs and higher peaks. The EMAs are aligned in a bullish formation with strong angle and separation, and the RSI remains above 50 - signalling positive underlying momentum for the greenback.
Market participants positioned themselves well early on, with the first higher peak after a higher trough forming at point 1, even before Fed Chair Jerome Powell pushed back - in unusually blunt terms - against a December rate cut during his 29 October press conference.
Since then, the dollar has been on a tear. A break below the most recent higher trough would warrant a reassessment, but for now the USDOLLAR continues to present a firm uptrend.
Buyers Are Back: Is Gold Ready to Break Higher?Gold is entering a promising recovery phase as macro signals are finally shifting in favor of the bulls. After three consecutive losing sessions, the market received a meaningful boost from weaker-than-expected U.S. labor data — opening up a much clearer upside opportunity for XAUUSD.
The number of Americans receiving unemployment benefits has climbed to a two-month high , with continued claims rising to 1.9 million in the week ending October 18. These figures are fueling expectations that the Fed may cut interest rates in December 2025, weakening the USD and lending strong support to the precious metal.
On the 2H chart, price is rebounding from the 4,060 support area and showing a clear return of buying momentum . XAUUSD will likely continue consolidating within the highlighted zone before targeting the 4,150 level. The rounded bottom formation underneath is also reinforcing the bullish scenario .
Overall, the most reasonable strategy is to favor buying on pullbacks toward 4,080–4,100, aiming for 4,150. A break below 4,060 would invalidate the short-term bullish outlook .

Scalp LONG – TAC🐂 Scalp LONG – TAC
Price is holding firmly above the major support on the 15m and 1h timeframes, a zone that often triggers strong rebounds when selling pressure weakens. Price action shows slowing sell momentum and solid absorption at the lows—signs that a short-term recovery could form here. This is a “do or die” level: if support holds, TAC can bounce sharply.
🎯 Trade Setup:
TP: 0.005636
SL: 0.004367
RR: 1 : 3
A clean long setup: built on strong support, absorption signals, and a clear recovery expectation from the base.

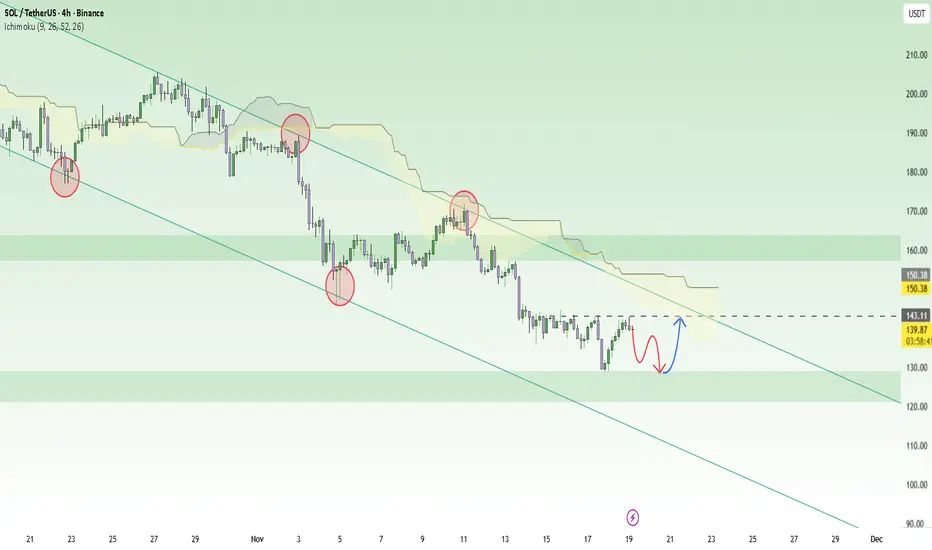
SOLUSDT: The Recovery is Gradually Being ConfirmedAfter a sharp decline, SOLUSDT is currently in the process of recovering and seems ready to return to strong upward momentum. Positive data from the Solana ecosystem is helping SOL regain momentum, and recent technical signals also support this trend.
The 4H chart shows that the price is reacting well at the 128.00 support level and has the potential to bounce from here. SOLUSDT is trading within a descending channel, but if it breaks above 139.00, the next target will be 143.00. Additionally, the Ichimoku indicator shows positive signals, with the Ichimoku cloud beginning to thin out.
The current trading strategy is to buy when SOLUSDT holds above 128.00 and breaks through 139.00, with a target of 143.00. Place a stop loss below 128.00 to protect your capital.
However, if the price fails to hold the 128.00 support and falls below it, the upward trend will be invalidated, and the price may return to a downtrend.
GBP/USD Heading Towards Support Breakdown?Hello everyone, today we will analyze the GBP/USD pair in the context of the current market situation.
Regarding the news, the GBP is under significant pressure as data from the UK shows the unemployment rate has risen to 5% , raising concerns among investors about the economic situation and the possibility that the Bank of England (BoE) may have to cut interest rates in the near future. Additionally, the USD is strengthening, driven by the market's expectation that the Fed will maintain high interest rates, putting further downward pressure on GBP/USD.
Technically, the chart shows that GBP/USD is trading in an ascending channel . However, the price has failed to break through the important resistance level at 1.31800 in the most recent attempt. This suggests that buying pressure is weakening, and if this level cannot be breached, the downtrend may continue.
The strong support level currently lies at 1.31300. If the price breaks below this level, the pair could drop further, heading towards the next support zone at 1.31000. These are crucial levels that traders should watch in the coming hours.
In conclusion, with the current news and technical analysis, it is highly likely that GBP/USD will continue its downward trend in the next 24 hours, unless there are significant changes in policy or data from the BoE or Fed . Make sure to monitor the key support and resistance levels to make informed trading decisions. Good luck with your trades!

BTC hitting the Monthly 20EMA supportBTC has touched the Monthly 20EMA (overlayed on this 4H chart) on a huge sell off, should make a strong bounce here or it's off to the pits of hell going into December.

Reversal Signal: Is EURUSD Ready to Break Higher?EURUSD is beginning to show a notable recovery after several days of correction. What stands out is that both the news flow and price action are now aligning with a bullish outlook — a strong indication that buyers are regaining control in the short term.
On the news side, the USD weakened after Fed Governor Waller warned about risks to the labor market and suggested an additional 0.25% rate cut at the upcoming December 9–10 meeting. This softer Fed stance typically pressures the USD, creating a supportive environment for EURUSD to rise.
At the same time, the Euro has improved as political risks in France eased. EURUSD bounced back to 1.1593, ending a three-day losing streak — a clear sign that selling pressure is fading.
On the chart, price reacted strongly at the 1.1550 support zone and continues forming higher lows, showing that buying interest is quietly strengthening. If this short-term support holds, EURUSD may head toward 1.1600 and potentially the major resistance at 1.1650.
In summary, with both fundamentals and technicals leaning bullish, the upward trend remains the favored scenario . A sensible approach is to wait for a retest of 1.1550–1.1580 before considering the next long entry.

Uptrend Retest PlayGold has continued to maintain a strong bullish structure on the 15-minute timeframe, creating a series of higher highs and higher lows while respecting the ascending trendline that has been guiding the current uptrend. After an initial impulsive move to the upside, price broke above a key intraday resistance level, confirming buyer strength and shifting that previous resistance into a fresh support zone.
Following the breakout, price is now pulling back toward a high-probability demand area where multiple technical factors converge. This zone aligns with:
1️⃣ The retest of the prior resistance, now acting as support.
2️⃣ The ascending trendline, which has been consistently defended by buyers.
3️⃣ A small liquidity sweep, as price has dipped below a minor intraday low to collect resting sell-side liquidity.
4️⃣ A fresh demand block, created by the last bullish candle before the recent impulsive breakout.
These elements together form a strong confluence area where buyers have historically been active, suggesting the market may be preparing for another bullish continuation leg. If price reacts positively within the blue entry zone and forms bullish confirmations (rejection wicks, displacement candles, or a break in micro-structure), the probability of continuation toward the marked upside target increases significantly.
Moreover, the broader trend remains intact, with no break of structure to the downside. As long as price continues to respect the support zone and the trendline, the bullish bias remains valid. This pullback should be viewed as a corrective move within a trending market rather than a reversal, and deeper retracements into the demand region may provide even higher-quality entries for traders waiting for confirmation.
Overall, current conditions favor bulls as long as support holds. A strong reaction from the entry zone could lead to renewed momentum and an attempt to push toward the next liquidity level and the projected target above.

XAUUSD: Light Downtrend, Targeting Lower LevelsGold prices declined during the Asian trading session on Tuesday, continuing the recent downtrend. The weakening confidence in the Federal Reserve's potential rate cut in December has provided strong support for the US dollar , putting pressure on gold and other non-yielding assets. Furthermore, the caution ahead of the delayed September non-farm payroll report, expected to be released this week, is also benefiting the US dollar and driving gold prices lower.
On the chart, we can see that gold is currently moving within a mild downtrend, with a price structure forming a “cup and handle” pattern, setting up for a possible pullback. The resistance level at 4,120,000 USD is quite strong, and if the price fails to break this level, gold is likely to continue its decline toward the next support levels around 4,080,000 USD and 4,000,000 USD.
In particular, the support zone near 4,000,000 USD is a key area to watch, where prices may bounce if selling pressure is not too strong. However, given the current downtrend, the potential for further declines below 4,000,000 USD is highly probable.
Trade Strategy Recommendations:
Sell: If gold fails to break the resistance at 4,120,000 USD and continues to decline, consider opening a sell position with targets near 4,080,000 USD and 4,000,000 USD.
Buy Against the Trend: Consider short-term buy orders if gold rebounds from the 4,000,000 USD support zone, but only trade with low risk and within a short time frame.
Be sure to closely monitor the important resistance and support levels , particularly around 4,080,000 USD and 4,000,000 USD, to make accurate trading decisions.

EURCAD testing weekly SMA on 1H oversold RSIAs per subject, standard simple setup, EURCAD testing the weekly 20SMA on an oversold RSI on hourly. Also hitting the top of FVG created on Sept 5th. Nothing is certain. Tight SL.

A clear long term support that could be used to buyIn the last 5 years this has been a multi year support, many instances we went up from here.
Also ex dividend payment on 24 nov, some free money.

DOT forming dual flag structure with supportDOT has formed a bullish flag on the global chart, and a similar pattern has formed more locally.
DOT's attempt to consolidate above the MA50 and MA200 was unsuccessful, but given these patterns, we are more likely to see a retest of them in the near future
Currently, we are at support at $2.668
A reversal and a breakout of the MA50 and MA200 resistance levels are more likely to occur
A move below the purple area will indicate a continuation of the downward movement
More detailed analysis, additional charts, and key levels to watch are available on our site

Is Gold About to Collapse?There are moments when the market doesn’t need to shout for us to sense that a storm is coming . Gold right now is the clearest example: after a wild surge of more than 245 USD in just a few sessions, the market has gone quiet — but it’s the kind of quiet that doesn’t feel safe.
The news backdrop is working against gold . The U.S. government reopening after 43 days means critical data is about to be released, giving the USD room to recover. At the same time, Fed officials continue to deliver hawkish messages , emphasizing they are not ready to cut rates while inflation remains high. This immediately tightens market expectations and puts direct downward pressure on XAUUSD.
Looking at the chart, the recent drop was no surprise: price has broken the ascending trendline and is now retesting the 4,100 resistance zone , where the Ichimoku cloud forms dynamic resistance. Each bounce is getting weaker, showing the bulls are running out of strength . If gold keeps getting rejected at 4,100, a deeper decline becomes almost certain, with the first target near 3,980 — a confluence of previous lows and horizontal support, and a prime area for liquidity sweeps before a potential bottom forms.
In summary, with unfavorable news, weak retracements , and technical structure leaning strongly bearish , gold is facing a very real risk of continuing its downward slide.

ES Supply-Demand Long IdeaSee chart for analysis.
Technicals = mixed but long-term bulllish
Fundamentlas = bullish
Sentiment = mixed

Scalp Long – AIA📈 Scalp Long – AIA
Price has broken out of the downtrend, signaling a potential shift into a recovery phase. On the 15-minute timeframe, RSI shows a strong bullish divergence, indicating weakening selling pressure and a return of buyer momentum. With just these two core signals, AIA has a solid chance of retesting the local high.
🎯 Trade Setup:
TP: 1.5817
SL: 0.7087
RR: 1 : 2.9
A clean long setup — concise, focused, and in true Elizy style: emphasizing momentum, market structure, and RSI confirmation.

EURCHF Daily market structure EURCHF in a daily time frame has touches its demand zone now time for upwards wait and watch market structure never lies ....
always puts stoploss

EURUSD Quietly Accumulates – Getting Ready to Break Higher?There are moments when the market isn’t loud, yet it whispers clues about what may come next. EURUSD right now is exactly that — calm on the surface, but each price swing hints at a potential bullish story forming beneath.
From a news perspective, the USD is weakening as the market waits for delayed U.S. economic data. Expectations that the Fed may slow down its tightening pace are also giving the Euro a supportive backdrop. This creates a solid foundation for EURUSD to maintain its recovery.
On the chart, the bullish structure is very clear: price is climbing within a smooth ascending channel, consistently forming higher lows. The recent pullback toward 1.1590 aligns perfectly with the Ichimoku cloud edge and the lower boundary of the channel — a highly attractive buying zone.
If EURUSD holds this rebound area, we could soon see a push toward 1.1650, where strong resistance and the channel top converge. This zone represents the most reasonable target for the current bullish wave.
In short, with supportive fundamentals, clean technical structure , and buyers consistently stepping in at key levels, EURUSD is clearly leaning toward an upward trend. As long as 1.1590 remains intact, the path toward 1.1650 is fully within reach.
